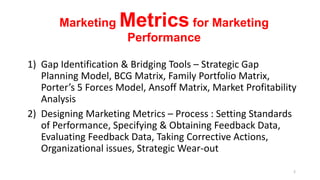
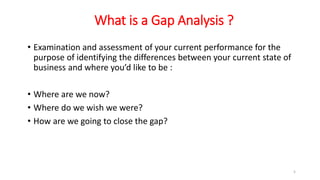
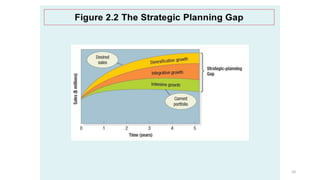
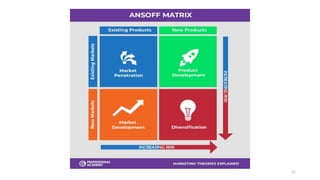
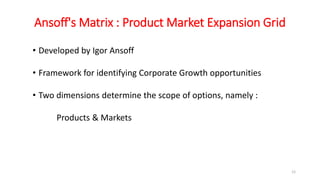
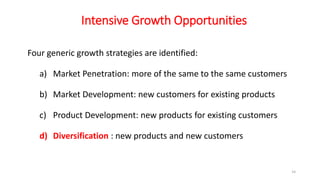
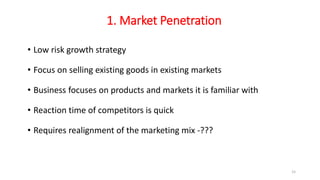
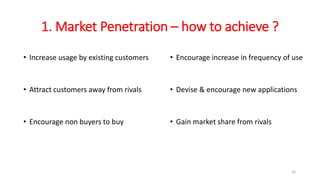
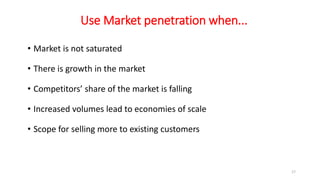
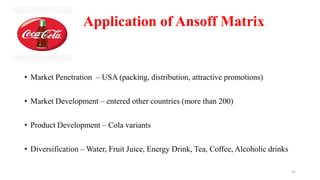
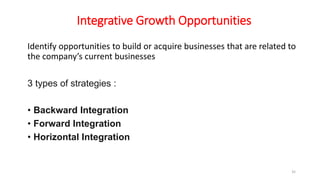
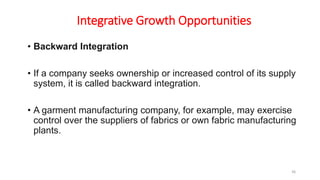
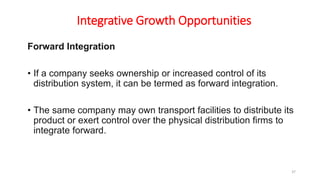
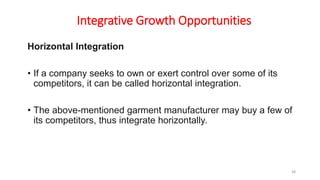
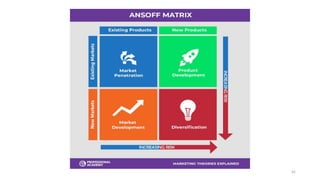
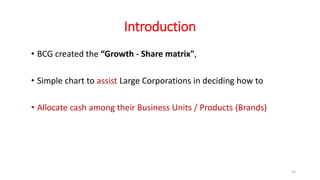
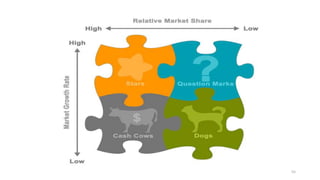
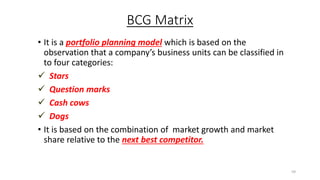
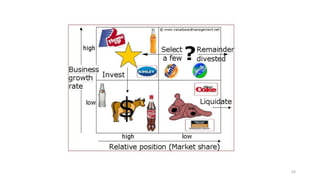
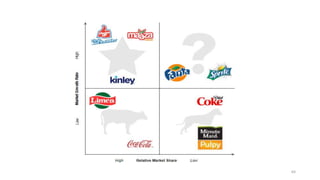
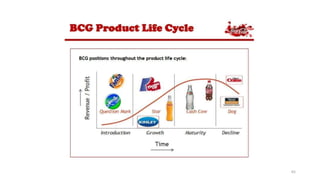
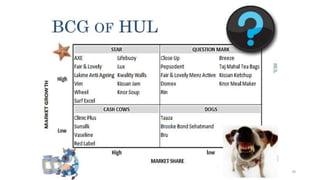
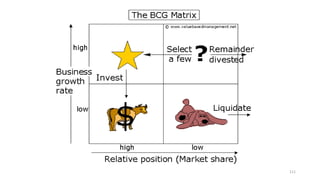
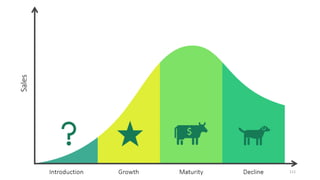
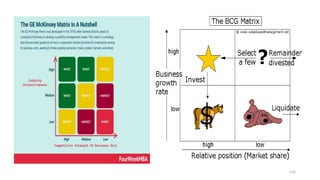
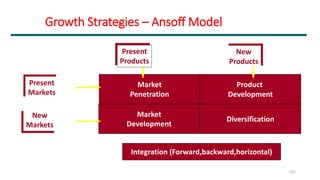
2. Marketing Metrics for Marketing
Performance
1) Gap Identification & Bridging Tools – Strategic Gap
Planning Model, BCG Matrix, Family Portfolio Matrix,
Porter’s 5 Forces Model, Ansoff Matrix, Market Profitability
Analysis
2) Designing Marketing Metrics – Process : Setting Standards
of Performance, Specifying & Obtaining Feedback Data,
Evaluating Feedback Data, Taking Corrective Actions,
Organizational issues, Strategic Wear-out
2
3. Metrics – a system or standard of measurement
• Sales
• Profit
• Market share
• Return on investment
• Customer Satisfaction/reviews,
• Overall Quality
• Service level
• Reputation in a marketplace
3
4. Gap Identification & Bridging Tools
• Strategic Gap Planning Model
• BCG Matrix
• Family Portfolio Matrix
• Porter’s 5 Forces Model
• Ansoff Matrix
• Market Profitability Analysis
4
5. What is a Gap Analysis ?
• Examination and assessment of your current performance for the
purpose of identifying the differences between your current state of
business and where you’d like to be :
• Where are we now?
• Where do we wish we were?
• How are we going to close the gap?
5
6. Gap Analysis
Conducting a gap analysis can help you improve your :
• Business efficiency, product, and profitability by allowing you to
pinpoint “gaps” present in your company.
• Better focus your resources and energy on those identified areas in
order to improve them.
6
7. Strategic Planning Gap
• Gap between Current Performance of an Organization and its Desired
Performance (Sales & Profits)
• Threat to the future performance & even survival of an Organization
• Real and exists within most organizations
• “Fortune magazine” - 70% of CEOs’ failures were the result of poor
execution rather than poor strategies
7
8. How can a Company Fill the Strategic Planning Gap?
• What is your response ???
8
9. Strategic Gap Planning Model
1.Intensive Growth
2. Integrative Growth
3. Diversification Growth
9
12. Ansoff's Matrix : Product Market Expansion Grid
• Developed by Igor Ansoff
• Framework for identifying Corporate Growth opportunities
• Two dimensions determine the scope of options, namely :
Products & Markets
12
13. Intensive Growth Opportunities
• Identify opportunities to achieve further growth within the
companies current businesses
• First course of Action – improve existing business
• whether the existing products can be improved to provide more
satisfaction to the existing customers
• How will you do it ?
13
14. Intensive Growth Opportunities
Four generic growth strategies are identified:
a) Market Penetration: more of the same to the same customers
b) Market Development: new customers for existing products
c) Product Development: new products for existing customers
d) Diversification : new products and new customers
14
15. 1. Market Penetration
• Low risk growth strategy
• Focus on selling existing goods in existing markets
• Business focuses on products and markets it is familiar with
• Reaction time of competitors is quick
• Requires realignment of the marketing mix -???
15
16. 1. Market Penetration – how to achieve ?
• Increase usage by existing customers
• Attract customers away from rivals
• Encourage non buyers to buy
• Encourage increase in frequency of use
• Devise & encourage new applications
• Gain market share from rivals
16
17. Use Market penetration when...
• Market is not saturated
• There is growth in the market
• Competitors’ share of the market is falling
• Increased volumes lead to economies of scale
• Scope for selling more to existing customers
17
18. 2. Market Development
• Medium risk growth strategy
• Selling existing products / services in new markets
• How to do it ?
18
19. 2. Market Development
• Using new distribution channels;
• changing the price;
• appealing packaging
Success of a product in one country does not necessarily guarantee
success in another
19
20. Market development is used when…
• Untapped markets are beckoning
• The firm has excess capacity
• There are attractive channels to access new market
20
21. 3. Product Development
• Medium risk strategy
• New product development
• For existing markets
• How to do it ?
21
22. 3. Product Development
• Launch New products
• Modify an existing product to make it more marketable,
• Develop mini packs / family-sized packs in addition to regular sizes.
• Product extension strategies – expand product line to offer more
choice or a wider variety to existing customers
22
23. Diversification Growth
• Identify opportunities to add attractive businesses unrelated to the
companies’ current businesses
• Completely outside the core marketing system of the company.
• New products sold to new markets
• New products for new customers
Makes sense for a company under the following situations:
• No additional opportunity for growth or profit in current system
• Opportunities outside present marketing system are superior
23
25. Diversification Growth
Concentric Diversification
• If a company seeks to add new products in its product line (s)
with technological or marketing synergies with the existing
product line/s, it is named concentric diversification
• New classes of customers are usually attracted to these
products.
25
26. Diversification Growth
Horizontal Diversification
• If a company seeks to add new products to its existing product
line(s) that could appeal to its present customers, it is termed
horizontal diversification.
• The added products are technologically unrelated to their
present product line.
26
27. Diversification Growth
Conglomerate Diversification
• If a company plans to add new products into the existing
product line (s) for new customers, it is called conglomerate
diversification.
The added products have no relationship to the company’s
current market, products, or technology.
The company makes such a decision because it represents a
great environmental opportunity (Very High Risk)
27
31. Application of Ansoff Matrix
• Market Penetration – USA (pricing, ads, kids happy meal, drive through)
• Market Development – entered other countries (more than 120)
• Product Development – Country specific menu
• Diversification – McCafe, McStops, The Golden Arch Hotel (Switzerland)
31
33. Application of Ansoff Matrix
• Market Penetration – USA (packing, distribution, attractive promotions)
• Market Development – entered other countries (more than 200)
• Product Development – Cola variants
• Diversification – Water, Fruit Juice, Energy Drink, Tea, Coffee, Alcoholic drinks
33
34. Uses of the Ansoff Matrix
• Framework to explore directions for strategic growth
• Most commonly used model for analysing the possible strategic direction that a
business should take
• Not only identifies and analyses different growth opportunities it also encourages
planners to consider both expected returns and risks
34
35. Integrative Growth Opportunities
Identify opportunities to build or acquire businesses that are related to
the company’s current businesses
3 types of strategies :
• Backward Integration
• Forward Integration
• Horizontal Integration
35
36. Integrative Growth Opportunities
• Backward Integration
• If a company seeks ownership or increased control of its supply
system, it is called backward integration.
• A garment manufacturing company, for example, may exercise
control over the suppliers of fabrics or own fabric manufacturing
plants.
36
37. Integrative Growth Opportunities
Forward Integration
• If a company seeks ownership or increased control of its
distribution system, it can be termed as forward integration.
• The same company may own transport facilities to distribute its
product or exert control over the physical distribution firms to
integrate forward.
37
38. Integrative Growth Opportunities
Horizontal Integration
• If a company seeks to own or exert control over some of its
competitors, it can be called horizontal integration.
• The above-mentioned garment manufacturer may buy a few of
its competitors, thus integrate horizontally.
38
53. Introduction
• BCG created the “Growth - Share matrix",
• Simple chart to assist Large Corporations in deciding how to
• Allocate cash among their Business Units / Products (Brands)
53
56. Relative Market Share(RMS)
•Market share is the percentage of the total market that is being
serviced by your company, measured either in revenue terms or unit
volume terms.
•RMS = Business unit sales this year
Leading rival sales this year
•The higher your market share, the higher proportion of the market
you control.
56
57. Market Growth Rate(MGR)
• Market growth is used as a measure of a market’s attractiveness.
• MGR = Total Market sales - Total Market sales
this year last year
Total Market sales last year
• Markets experiencing high growth are ones where the total market
share available is expanding, and there’s plenty of opportunity for
everyone to make money.
57
58. Strategic Business Unit (SBU)
• A strategic business unit (SBU) is a profit centre which focuses
on product offering and market segment.
• SBU may be characterized by multiple categories and multiple
product lines.
• For example, HUL may have a line of products in the shampoo
category.
• Thus to track the investments against return, they may classify
the category as a different SBU itself
58
59. BCG Matrix
• It is a portfolio planning model which is based on the
observation that a company’s business units can be classified in
to four categories:
Stars
Question marks
Cash cows
Dogs
• It is based on the combination of market growth and market
share relative to the next best competitor.
59
60. STARS
• Leaders in business.
• Require heavy investment,
to maintain its large market
share.
• Leads to large amount of
cash consumption and cash
generation.
CASH COWS
• Are foundation of the
company and often the stars
of yesterday.
• Generate more cash than
required.
• Located in an industry that is
mature, not growing or
declining.
60
61. DOGS
• Are the cash traps.
• Do not have potential to
bring in much cash.
• Number of dogs in the
company should be
minimized.
Question Marks
• Most businesses start of as
question marks.
• Question marks have potential
to become star and eventually
cash cow but can also become
a dog.
• Investments should be high for
question marks.
61
67. Strategies : STARS
• Build sales and/or grow
market share.
• Invest in the product to
maintain your market
leadership position.
• Repel the challenge of
competitors.
• Obviously, it can cost to
defend a market leading
product.
• Star products could be loss -
making as the cost of
maintaining the market
leader position.
67
68. Strategies : Cash Cows
• Hold sales levels and
market share.
• Defend your market
position.
• Use the cash generated
by a cash cow to support
star products
• Also to select problem
children for development.
68
69. Strategies : Problem Children / Question
Marks
Select problem children for
investment.
Divest the rest,
Harvest them for cash or
focus on a defendable
market niche.
69
70. Strategies : Dogs
• Harvest them for cash;
divest, or focus on a
defendable niche.
• The aim of the matrix is to
ensure that your company
has a balanced portfolio of
products.
• If all your products are
Dogs, your business will
likely fail.
70
71. BENEFITS
• Simple and easy to understand
• Helps you to quickly and simply screen the opportunities open to you,
and helps you think about how you can make the most of them.
• Used to identify how corporate cash resources can best be used to
maximize a company’s future growth and profitability.
71
72. LIMITATIONS
• BCG MATRIX uses only two dimensions, Relative market share and
market growth rate.
• Problems of getting data on market share and market growth.
• High market share does not mean profits all the time.
• Business with low market share can be profitable too.
72
73. LIMITATIONS
• Time- consuming and costly to implement
• Focus on classifying the current businesses but provide little advice
for future.
• High market share/Growth is not the only success factor.
• Linkage between market share and profitability is questionable.
73
84. CONCLUSION
• Though BCG MATRIX has its limitations
• Most FAMOUS AND SIMPLE portfolio planning matrix
• Used by large companies having multi-products
84
91. Auditing the Marketing Environment
SWOT Analysis – of Indian IT Industry ????
S - Strength
W - Weakness
O - Opportunities
T – Threats
Minimum 3 points each
91
93. Porter’s 5 Forces Model
• Better alternative to simple SWOT Analysis
• Method for analyzing Competition of a Business
• 5 forces close to the company determine the competitive intensity
• Affect its ability to serve its customers and make a Profit
• Attractiveness of an industry in terms of its profitability
93
95. Porter’s 5 Forces Model
Other Factors impacting Business :
• Industry Growth Rate
• Technology and Innovation
• Government Policies
• Complementary Products & Services (Car & Fuel)
95
113. Drawbacks of the BCG Matrix
• No consideration of risk - the firm
does not know the level of risk
involved in each strategic option.
• Model only operates in growth
markets – it is not able to consider
negative rates of growth
• Many markets being in decline,
the model cannot take this into
account.
• Where ‘new’ markets are created &
have a low initial rate of growth,
products will be immediately shown
as Cash Cows or Dogs when this will
not be the case.
• No guidelines exist for the ‘correct’
portfolio - correct balance for one firm
may be very different to another.
• Companies may invest too heavily in
Dogs (waste), hoping that an already
failing position will improve
113
114. Drawbacks of the BCG Matrix
• Market attractiveness is measured
using growth rates - may not show
future potential within the market.
• Competitive strength cannot simply
be shown by relative market share -
Other factors come into play such as
efficiency, margin and profitability,
with market share only playing a
small role.
• Cash flow is the performance
criterion used - helpful in short-term
but long-run profitability is a better
measure of performance.
• Model assumes that business units
are independent - removing a
Question Mark or Dog from the
portfolio might allow a competitor to
enter or increase their profits.
• Results are very sensitive to variations
- how growth and market share are
measured - open to personal
interpretation, causing inaccuracy
114
117. GE Portfolio Matrix
• Technique to help the Top Management to evaluate Business
Portfolio of a Large Company
• Assess strength of each SBU / Product & decide which
opportunities in the market they should invest in and which ones to
sell off
• 2 Factors – Industry Attractiveness & Business Strength
• Conceptually similar to BCG Matrix, but more complicated
117
118. GE Portfolio Matrix
Industry (Market) attractiveness
• How beneficial it is for a company to enter and compete
within this market
• Based on various factors - market size, growth rate,
possibility of profit, the number of competitors within the
industry and their weaknesses
118
119. GE Portfolio Matrix
Business/competitive strength
• Helps decide whether a company is competent enough to
compete in the given markets.
• Determined by various factors – assets, market share &
growth, brand position in the market, customer loyalty,
NPD etc
119
120. GE Portfolio Matrix
Investment strategies
• When considering investment, it must first be seen which
box of the matrix an SBU falls in ;
• Grow / Invest
• Selectivity / Protect
• Harvest / Divest
120
121. GE Portfolio Matrix
Grow / Invest
• SBUs attract company's investment
• Expected to yield high returns in the future
• Invest in R&D, Production, Acquisition, Advertising etc
121
122. GE Portfolio Matrix
Selectivity / Protect
• SBUs hold a lot of ambiguity fall into this category,
• Only invested in if there is any prospect of competencies in
managerial and corporate capabilities and
• If companies have any money left after investments in
'grow' business units.
122
123. GE Portfolio Matrix
Harvest / Divest
• SBU' performing poorly in unattractive industries,
• Companies only invest in them if they generate enough
cash to equal the investment amount,
• Otherwise, they may be liquidated.
123
125. GE Portfolio Matrix
Advantages
• Raises awareness between managers about the performance of their
products in the market
• Aids in developing strategies to get maximum returns from the resources
available
• Helps extract information about a business unit's strengths and weaknesses
• To devise strategies to accelerate and improve performance
• Aids the business in growing and in providing information about potential 125
126. GE Portfolio Matrix : Advantages
• Raises awareness between
managers about the performance
of their products in the market
• Aids in developing strategies to get
maximum returns from the
resources available
• Helps extract information about a
business unit's strengths and
weaknesses
• To devise strategies to
accelerate and improve
performance
• Aids the business in growing
• Providing information about
potential market opportunities
126
132. Family Portfolio Matrix
EXPANDING THE BCG CONCEPT
• BCG model is important due to its emphasis on a portfolio of
products, balancing mature and declining products with those
essential for future success
• Clearest limitation of the BCG matrix is its inability to operate in
negative growth markets.
132
133. Family Portfolio Matrix
• The Product Life Cycle Portfolio Matrix introduces this ability, together with
the introduction of new products.
• Essentially extending the model vertically above and below the BCG
approach, it follows the product life cycle concept but only considers
aspects where the product is actually being sold.
• Future investments are not part of the model.
• These also require cash, and an extension to the BCG Matrix created by
McDonald allows for this approach
133
134. Family Portfolio Matrix
• Overall management of Portfolio - needs cradle-to-grave approach
• Clear management of the process - before launch of the product and
continuing after the product has been withdrawn from sale.
• Reminders of old products can continue for many years after they are no
longer for sale, potentially re-appearing years later
• Prior to the commencement of R & D, products start as ideas - allocation
of some resources to conceptual development prior to full research
134
136. Family Portfolio Matrix
• Leeds Metropolitan University published a conference paper which
extended the BCG matrix.
• Called the Family Portfolio matrix, it suggested several new product
categories
• Comprises components of both the Product Life Cycle Portfolio Matrix
and addition of Research and Development approach
136
137. Family Portfolio Matrix
1. Infants – These are new products to the market which generate cash for
a low spend, they have a low market growth rate and a medium to high
market share.
2. Ideas and Concepts – These are products that are in development. They
are new to the market. The producer of these goods however are
spending on their introduction to the market. Cash generation will be nil
and therefore a resulting negative cash flow will occur.
137
138. Family Portfolio Matrix
3. Research and Development – These are products have a high potential
market growth rate but are yet to be placed on the market. They have no
market share and make no income. There is significant spend on these
products as they are prepared for the market.
4. Hibernating Squirrels – These are products which have been withdrawn
from sale but which may be returned to the market at a later date or sold to
competitor. There is a small cost to these products e.g. the maintenance of
intellectual property rights, storage of equipment etc, will result in a small
negative cash flow. It does not disappear from the portfolio although no
income is generated.
138
139. Family Portfolio Matrix
5. Warhorses – These are products with a high relative market share
but a negative growth rate. A product in decline but which still makes
money.
6. Dodos – These are products which have a low relative market
share and a negative market growth rate. These are products on the
road to divestment.
139
140. Family Portfolio Matrix
7. Lingering Memories :
• These are products which have long-been removed from the market but still
resonate in the minds of consumers.
• Competitors may make a version of this product so there may be some residual
benefit which can be drawn upon.
• No income or overall cost, this presents a potential future source of income if
the residual benefit can be capitalised upon.
140
141. Family Portfolio Matrix
• Desired strategy is aimed to lead to the greatest overall cash flow
• Many pitfalls when launching new products – very high failure rate
• Firm should aim to invest in the idea - Once launched
• Further investment required to allow the new product to grow – gaining
market share
• As market growth slows, consolidation is required by purchasing
competitors.
141
142. Family Portfolio Matrix
• Alternatively, the undesired strategy takes the investment in a product and
either invests in a product which will ultimately fail or fails to capitalise on the
potential.
• The subsequent result is poor return on investment, which may lead to a
detraction from investment in future products.
• Carries the concept of portfolio management way beyond the simple sale of
current product
• Brings into play the overall management of past and future SBUs or products –
creating a cradle-to-grave approach beyond that of the BCG Matrix
142
148. Purpose of Business ?
According to according to Peter Drucker :
• The purpose of business, is “to Find, Keep and Grow
the Right customer”.
• Identify who is the Right customer and the profitable
customer, in the Right market.”
148
149. Profitability
• Profitability is the most significant measure to evaluate
the success of any business.
• For a business to be profitable and successful in the long
term, business owners need to identify the right strategic
path.
• Eg. Zomato, PayTM, Nykaa
149
150. Profitability Analysis
• The 20-80 marketing principle says that 80% of the
profits arrive from 20% of customers.
• the principle can be modified as 20-80-30,
• wherein 80% of the profits come from 20% of the
customers and 30% of this profit is spent in managing
the unprofitable customers!!
A startling revelation.
150
151. Profitability Analysis
• Understanding the profitability of significant customers
or markets helps the business to evaluate the success
of trading with those customers or in those markets.
• Profitability analysis as an “analysis of cost and revenue
of the firm which determines whether or not the firm is
profiting.
151
152. Profitability Analysis
• Allows companies to maximize their profit
• Maximizes the opportunities they can take advantage of in
an extremely dynamic, competitive, and vibrant market.
• Useful and essential for growing companies - help identify
growth opportunities for future
• Spells the difference between shutting down and keeping
afloat
152
153. 1)Market Profitability Analysis
Market profitability analysis measures the net profit
earned by undertaking business in a particular market.
Trading in a market usually means trading with more than
one customer. Wholesale and retail or public sector and
private sector, are examples of different markets
153
154. WHAT ARE THE BENEFITS?
• To identify the right strategic path for your business.
• To evaluate the success of trading with the right customers
or in the most favourable markets, taking account of all
business costs including overheads.
• Resources can be focussed on trading with profitable
customers or in profitable markets with the business,
therefore, maximising its performance and value.
154
155. WHAT IS THE DIFFERENCE :
CUSTOMER & MARKET PROFITABILITY ANALYSIS?
• Customer profitability analysis measures the net profit
earned by doing business with the customer.
• Market profitability analysis measures the net profit earned
by undertaking business in a particular market. Trading in a
market usually means trading with more than one customer.
Wholesale and retail or public sector and private sector, are
examples of different markets.
155
156. WHAT IS A PROFITABLE CUSTOMER OR MARKET?
• A profitable customer is a person, organisation, business
or a company that over time yields revenue that exceeds, by
an acceptable amount, the cost of attracting, selling and
servicing that customer.
• A profitable market is a market for the business that over
time yields revenue that exceeds, by an acceptable amount,
the cost of attracting, selling and servicing the group of
customers with which they trade within that market.
156
158. Profitability Analysis
• The methodology of Marketing-Profitability Analysis consist
of primarily three steps:
• Identifying the functional expenses
• Assigning the functional expenses to the marketing
entities
• Preparing a profit-and-loss statement for each
marketing entity
158
159. Profitability Analysis
• Identifying the functional expenses
• determine the expenses being incurred for the marketing
activities such as selling, advertising, distribution, packing,
billing, and collection, et al.
• Next task is to break each expense and allocate it to different
marketing functions. For example, if most salary went to sales
representatives and rest went to advertising manager,
packing, office accountant, then the total salary will be
allocated according to these activities.
• Finally, all the natural expenses of salary, rent, etc are
mapped onto each functional expense of say, selling,
advertising, billing, etc.
159
160. Profitability Analysis
• Assigning the functional expenses to the marketing
entities
• measure how much functional expense is associated with
each type of channel.
• For example, based on the number of orders placed through
each channel, the company can allocate accounting
expenses.
• Also, based on the number of ads placed for each channel,
the advertising expense can be allocated. This way an
average cost can be calculated based on the total number of
ads.
• Based on the amount of sales efforts required for each 160
161. Profitability Analysis
Preparing a profit-and-loss statement for each marketing
entity
• The last step is to prepare a profit and loss statement for
each type of channel.
• The cost of goods is assigned according to the number of
sales for each channel,
• e.g. if one channel achieved half of the total sales then the
cost of goods allocated to that channel will be half of the
total cost of goods sold.
161
162. COST ALLOCATION
• Direct costs are those costs incurred to generate revenue,
such as the purchase or production cost of units sold or
services delivered
• Indirect costs or overheads are those costs that cannot be
directly attributed to generating revenue, such as the cost
of finance, marketing, communications and administration.
162
163. COST ALLOCATION
• The challenge of any profitability analysis is to find a way of
allocating the indirect costs to the significant customers or
markets.
• To allocate indirect costs fairly, the key drivers for those
costs need to be identified.
163
164. COST ALLOCATION
Examples of drivers for indirect cost are:
• Revenue
• Labour cost or time
• Production cost or time
• Number of transactions (purchase orders or sales orders)
• Time spent servicing the customers or markets
164
165. Importance of Profitability Analysis
Gives business owners a 360° view of your company’s profits
Profitability Ratios –
1.Margin ratios - Gross Profit, Operating Profit, Net Profit,
Cashflow
2. Return ratios – ROE, ROCA, ROA, ROMI
165
166. Designing Marketing Metrics
Steps in the Process :
1) Setting Standards of Performance,
2) Specifying & Obtaining Feedback Data,
3) Evaluating Feedback Data,
4) Taking Corrective Actions,
5) Organizational issues,
6) Strategic Wear-out
166
167. Designing Marketing Metrics
• Evaluating marketing performance guides future marketing
initiatives and helps a company achieve its goals.
• Marketing performance metrics or (KPIs)
• useful for marketing & non-marketing executives.
• gauge how marketing activities and spending impact the
company’s bottom line
167
168. Designing Marketing Metrics
• Pressure to show a return on investment (ROI) on their activities
- measure the degree to which marketing spending contributes
to profits, sales and customer service.
• Monitoring marketing’s progress towards its annual goals
• Determining what areas of the marketing mix – product, price,
place, and promotion – need modification or improvement to
increase some aspect of performance
168
169. Designing Marketing Metrics
• Assessing whether company goods, services, and ideas meet
customer and stakeholder needs
• Establishing marketing performance metrics is integral to helping
brands satisfy customers, establishing a clear company image,
being proactive in the market, and fully incorporating marketing
into the company’s overall business strategy.
169
170. Designing Marketing Metrics
• Marketing metrics are numeric data that allow marketers to
evaluate their performance against organizational goals.
• Include all Marketing activities
170
171. Designing Marketing Metrics
• Market share
• Awareness
• Knowledge
• Consumer beliefs
• Purchase intention
• Loyalty
• Willingness to recommend
• Trial
• Repeat volume
• Retention rate / CLV
• Profit/(Loss)
• Growth
• Good cash flow
• net sales billed,
• Contribution / margin
• NPV / IRR / ROI
• number of product or design
registrations, and
• Channel margin
• Acquisition / Retention cost
171
173. Strategic wear-out
Strategic wear-out occurs when an organisation no longer
meets customer needs and the pursed strategy is surpassed
by competitors
There are many examples of companies that once had a
successful strategy but have failed to adapt to the changing
environment and have therefore suffered from 'strategic
wear-out'
173
175. Reasons for Strategic wear-out
1. Market changes that take the organization by surprise or go undetected
for a significant length of time (Environmental shocks as 11th
September had on airline industry)
2. Changes in customer needs and expectations (e.g. increased
environmental awareness)
3. Development in distribution system (e.g. internet)
4. Competition - from existing or, more likely new competitors.
175
176. Reasons for Strategic wear-out
3. Internal factors:
• Insufficient or inconsistent investment
• Poor control of Company Costs by Management
• Misguided changes to winning strategy
• In order to avoid strategic wear-out companies should undertake
regular and detailed reviews of each element that makes up the
external environment
176
177. How to avoid Strategic wear-out
• Companies should undertake regular
and detailed reviews of each
element that makes up the external
environment
• Identify the ways in which these
elements and the environment.
• Evaluate the impact of these
changes on the organization.
• Undertake an internal audit to
establish the appropriateness of
current and future actions to ensure
customer needs are met.
• An organization should be market
orientated and continually focused
on customers changing needs and
other changes in its and
environment to avoid strategic
wearout
177
186. Perception Map
• A perception map, also known as a perceptual map, is
a graphical representation of how customers and
prospects feel about a variety of brands, products,
and ideas.
• It is a market research tool.
186