Download to read offline

![CAPITALSTARS FINANCIAL RESEARCH PVT. LTD.
Daily Equity Report
MARKET MOVERS UPSIDE NIFTY SPOT
TREND STRATEGY
BULLISH BUY ON DIPS
PIVOT POINTS
S3 S2 S1 P R1 R2 R3
8617 8706 8752 8796 8841 8886 8975
NIFTY
SUPPORT RESISTANCE
S1-8750 R1-8950
S2-8705 R2-9015
BANK NIFTY FUTURE
TREND STRATEGY
BULLISH BUY ON DIPS
PIVOT POINTS
S3 S2 S1 P R1 R2 R3
19111 19549 19800 19986 20238 20423 20861
BANK NIFTY
SUPPORT RESISTANCE
S1-19700 R1-20350
S2-19520 R2-20600
SCRIPT CLOSE
CHANGE
(%)
TCS 2514.20 1.3
HDFC BANK 1081.60 0.39
HDFC 1269.30 0.54
SUNPHARMA 929.10 1.24
MARKET MOVERS DOWNSIDE
SCRIPT CLOSE
CHANGE
(%)
ONGC 349.85 [0.43]
RELIANCE 908.05 [0.79]
ITC 360.65 [2.14]
SBIN 307.50 [0.47]
FII & DII ACTIVITY
INSTITUTION
NET BUY
(CR.)
NET SELL
(CR)
FII 5639.15 6269.12
DII 1747.14 1971.21
NSE TOTALS
INDICES ADVANCES DECLINES
NIFTY 22 28
BANK NIFTY 8 4](https://image.slidesharecdn.com/stocks-150203005427-conversion-gate01/85/Stocks-3-320.jpg)

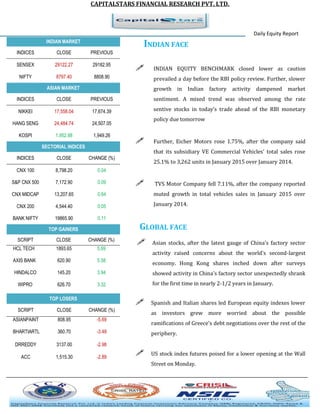
The daily equity report from CapitalStars Financial Research provides an overview of the Indian and global stock markets. In India, key stock indices closed lower due to concerns ahead of the upcoming RBI policy review and slower growth in factory activity. Selected automobile companies such as Eicher Motors rose while TVS Motor fell. In Asia, Chinese factory data raised concerns and stocks declined, while European markets also fell. US futures pointed to a lower open. The report provides sector index performance, notable stock gainers and losers, and commentary on company earnings news.


