Download to read offline

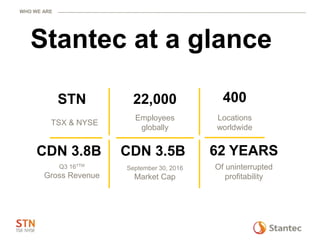
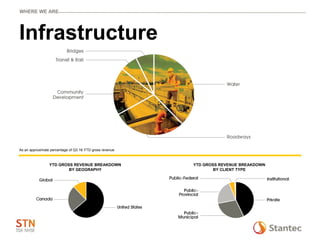
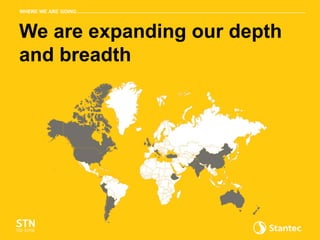

1) Stantec is an international design firm focused on engineering, architecture, and environmental services with over 22,000 employees globally. 2) The document discusses Stantec's financial performance over the past 10 years, including 17% annual gross revenue growth and 19% annual growth in gross revenue backlog. 3) Stantec's strategy is to continue growing organically and through acquisitions, with a goal of becoming a top 10 global design firm. A major recent acquisition was the $1.8 billion purchase of MWH Global to expand its water services globally.


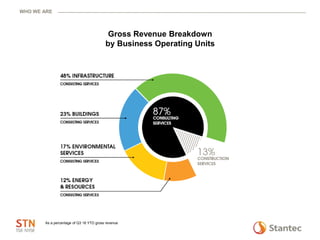
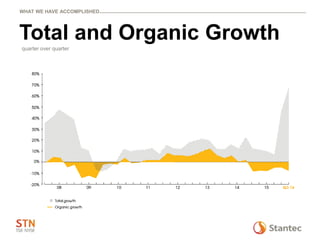
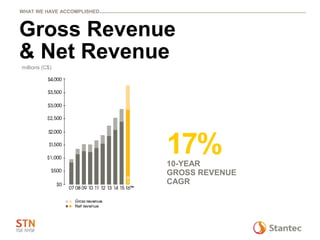
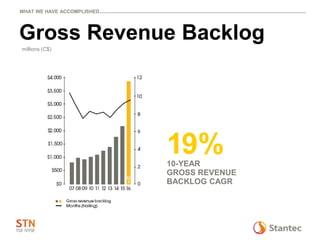
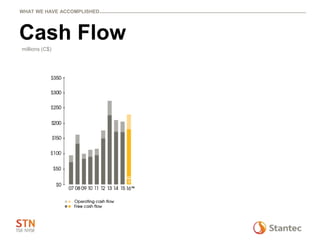
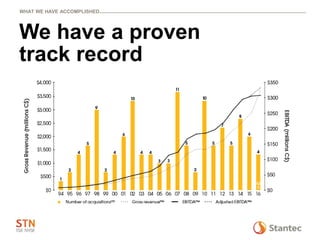
![[ls머트리얼즈]LS Materials 417200 Algorithm Investment Report](https://cdn.slidesharecdn.com/ss_thumbnails/lsmaterials417200algorithminvestmentreport-260202182715-66072c7b-thumbnail.jpg?width=640&height=640&fit=bounds)