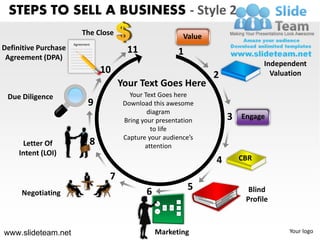
The steps to sell a business involve:
1. Engaging in negotiations with potential buyers.
2. Creating a letter of intent that outlines the agreement.
3. Conducting due diligence and an independent valuation.
4. Finalizing the sale with a definitive purchase agreement.
To anticipate production losses 12 stages business plan for small power point...SlideTeam.net
The document outlines a 12-stage linear process for anticipating production losses. It includes stages numbered 1 through 12 arranged in a linear flowchart. The purpose is to provide a step-by-step method for predicting potential production issues.
The document describes a product lifecycle model with five levels or stages: initial/ad-hoc, repeatable, defined, managed and measured, and optimized. Each increasing level represents more refined processes, standardized documentation, and quantitative management techniques. The five levels are arranged visually from left to right in order of ascending process maturity and control.
End of life complete product lifecycle style design 2 powerpoint ppt templates.SlideTeam.net
The document describes a five level product lifecycle model. Level 1 represents the initial or ad-hoc stage. Level 2 is the repeatable stage. Level 3 is the defined stage. Level 4 is the managed and measured stage. Level 5 is the optimized stage.
End of life complete product lifecycle design 2 powerpoint presentation templ...SlideTeam.net
The document describes a five level product lifecycle model. Level 1 represents the initial or ad-hoc stage. Level 2 is the repeatable stage. Level 3 is the defined stage. Level 4 is the managed and measured stage. Level 5 is the optimized stage.
End of life complete product lifecycle style design 2 powerpoint ppt slides.SlideTeam.net
The document describes a five level product lifecycle model. Level 1 represents the initial or ad-hoc stage. Level 2 is the repeatable stage. Level 3 is the defined stage. Level 4 is the managed and measured stage. Level 5 is the optimized stage.
End of life complete product lifecycle style design 2 powerpoint presentation...SlideTeam.net
The document describes a five level product lifecycle model. Level 1 represents the initial or ad-hoc stage. Level 2 is the repeatable stage. Level 3 is the defined stage. Level 4 is the managed and measured stage. Level 5 is the optimized stage.
End of life complete product lifecycle design 2 powerpoint ppt slides.SlideTeam.net
The document describes a five level product lifecycle model. Level 1 represents the initial or ad-hoc stage. Level 2 is the repeatable stage. Level 3 is the defined stage. Level 4 is the managed and measured stage. Level 5 is the optimized stage.
The document describes a 5-level product lifecycle model. Level 1 represents the initial/ad-hoc stage, level 2 is repeatable, level 3 is defined, level 4 is managed and measured, and level 5 is optimized. The model shows progression from an immature to optimized process as the product moves through each stage of the lifecycle.
End of life complete product lifecycle design 2 powerpoint ppt templates.SlideTeam.net
The document describes a five level product lifecycle model. Level 1 represents the initial or ad-hoc stage. Level 2 is the repeatable stage. Level 3 is the defined stage. Level 4 is the managed and measured stage. Level 5 is the optimized stage.
End of life complete product lifecycle design 2 powerpoint presentation slides.SlideTeam.net
The document describes a five level product lifecycle model. Level 1 represents the initial or ad-hoc stage. Level 2 is the repeatable stage. Level 3 is the defined stage. Level 4 is the managed and measured stage. Level 5 is the optimized stage.
This document outlines key topics in supply chain management including strategies, risks, economics, and ethics. It discusses Darden Restaurants' supply chain operations and presents learning objectives, principles, and concepts related to optimizing supply chain performance. Examples are provided to illustrate various supply chain strategies like many suppliers, few suppliers, vertical integration, and joint ventures.
The document is a PowerPoint presentation on layout strategies. It discusses different types of layouts including office, retail, warehouse, fixed position, process oriented, work cell, and product oriented layouts. It provides examples of each type of layout and considerations for designing effective layouts. The presentation also covers topics like cross docking, random stocking, servicescapes, McDonald's innovations in layout, and how to minimize costs in a process oriented facility layout.
This document provides a summary of a presentation on developing a Composability Index to evaluate how well designed SOA interfaces support composition. The presentation discusses 11 composability quality aspects that could be used to calculate an Index, including considerations around ACID transactions, loop invocations, exception handling, availability and statelessness. The goal of the Index is to provide a quick way to assess how useful a given SOA design would be when components need to be composed together.
Business power point templates linear arrows steps to create plan sales ppt s...SlideTeam.net
The document outlines 11 steps to create a business plan using linear arrows. Each step includes a text box for describing that element of the business plan. The linear arrows and text boxes provide a structured, graphical way to map out the various sections and details of a business plan.
The document discusses the FIX session layer and message sequencing. It introduces FIX sessions, including how they are initiated with logon messages and maintained with heartbeats. A FIX session guarantees that messages are delivered in the order they are sent through use of sequence numbers that each party tracks for incoming and outgoing messages. Sequence numbers help identify if messages are received out of order.
How to Improve and Accelerate your S&OP process April 20th 2010 Logichem Düsseldorf
By Elke Servaes
LogiChem 2011 will be the event's tenth anniversary and an opportunity for the most senior chemical supply chain & global logistics directors from the European chemicals community to come together once again share experiences, make new contacts and benchmark the latest chemical supply chain initiatives.
Not only will LogiChem 2011 be a chance for the chemical industry to reminisce about the last ten years but an opportunity to shape the next decade. To celebrate a decade of LogiChem, there will be an exciting three day programme filled with networking opportunities in our new location, Antwerp.
Free download flow 9 diverging arrows process model cycle diagram power point...SlideTeam.net
The document shows a business flow diagram with 9 diverging arrows. It demonstrates how to edit images in PowerPoint, including ungrouping objects, changing colors, and using theme colors. Key steps include right clicking objects to ungroup or access formatting options, then selecting fill colors or theme colors to customize the appearance. The purpose is to bring presentations to life by editing images.
To good world business powerpoint templates ideas processs andSlideTeam.net
The document contains instructions for editing business diagram images in PowerPoint. It explains how to ungroup objects, edit colors, and change colors using built-in theme colors. The purpose is to allow users to customize diagram images for business presentations.
Steps new business powerpoint presentation diverging processes radial chart t...SlideTeam.net
The document appears to be a template for a presentation with editable icons and text boxes. It includes instructions on how to ungroup objects, edit colors, and change colors using built-in theme colors in PowerPoint. The purpose is to allow customizable editing of icons and text to bring presentations to life and capture audience attention.
Diverging arrow pointing strategic planning process arrows network software p...SlideTeam.net
The document describes a diverging arrow diagram for strategic planning. It includes placeholders for text and logos. The diagram has 11 points connected by arrows and can be edited in PowerPoint. It is meant to help presentations and capture audience attention.
Diverging arrow pointing strategic planning process arrows network software p...SlideTeam.net
The document describes a diverging arrow diagram for strategic planning. It includes 11 points labeled 1 through 11 with arrows pointing in different directions. Below the diagram are bullet points describing how the diagram can be used to bring presentations to life, capture audiences' attention, and is fully editable in PowerPoint by changing colors, sizes, orientations of icons, ungrouping objects, and editing colors using theme colors. The document provides instructions for customizing a diverging arrow diagram template for strategic planning presentations.
Powerpoint presentations process management solution cycle flow network templ...SlideTeam.net
The document describes a 7 step converging arrows business process management solution. It includes 7 steps represented by arrows that converge on a central text box. All images are 100% editable in PowerPoint and allow the user to change color, size, orientation or any icon to their liking. The document also provides instructions on how to ungroup objects and edit their color using theme colors or by selecting fill and solid options.
Powerpoint presentations flow connecting diverging 9 arrows charts and diagra...SlideTeam.net
The document is a business flow diagram with 9 arrows diverging from a central point. The diagram and accompanying text provide guidance on using the image in a PowerPoint presentation to bring the presentation to life, capture the audience's attention, and pitch ideas convincingly. The images are fully editable and the diagram can be downloaded.
Points business powerpoint theme process relative circular flow arrow diagram...SlideTeam.net
The document provides instructions for editing icons in PowerPoint presentations. It explains how to ungroup objects, change colors, and edit colors using theme colors. Key steps include right clicking objects to ungroup or format shape colors, selecting solid or gradient fill options, and choosing from built-in theme colors. The overall purpose is to demonstrate how to customize and edit icons for presentations.
10 world business powerpoint templates steps diverging circular motion proces...SlideTeam.net
The document describes how to edit and customize a diagram template for business presentations. It includes 10 steps represented by icons that can be arranged, grouped, ungrouped, and edited by changing colors individually or using theme colors in PowerPoint. The icons and text are fully editable to customize the template for any presentation needs.
Diverging arrows pointing specific directions processs and power point templatesSlideTeam.net
The document shows a diagram with diverging arrows pointing in different directions. The arrows can be edited in PowerPoint by ungrouping the object, changing the color using the format shape option or theme colors, and dragging the arrow to change its orientation. The diagram brings presentations to life and captures audiences' attention. It is fully editable and customizable in PowerPoint.
Seven factors arrow pointing business process charts and power point slidesSlideTeam.net
The document appears to be a template for a diagram or presentation with 7 factors pointing to a central business process. The template includes placeholder text and images that can be customized. It is meant to bring presentations to life and capture audience attention. All elements are editable in PowerPoint.
Twelve diverging stages flow chart circular spoke diagram power point slidesSlideTeam.net
The document describes how to edit images in a PowerPoint presentation. It includes instructions on ungrouping objects, editing colors, and changing colors using theme colors. The key steps are to right click objects to ungroup or format shape, select fill and solid or gradient options to change colors, and use built-in theme colors. This allows full editing of images to customize a presentation.
In new business powerpoint presentation process circular flow layout templatesSlideTeam.net
The document describes how to edit icons in a PowerPoint presentation. It explains how to ungroup objects to edit them individually, change the color of objects by selecting format options, and change colors using built-in theme colors. The purpose is to provide instructions for modifying images to suit presentation needs.
Arrow business powerpoint theme process 12 concepts cycle slidesSlideTeam.net
The document describes how to edit images in a PowerPoint presentation. It states that all images are 100% editable and allows the user to change color, size, and orientation of any icon. It then provides instructions on how to ungroup objects, edit colors, and change colors using theme colors in PowerPoint. The instructions include selecting shapes, right clicking to access formatting options, and selecting fill colors and built-in theme colors to change the appearance of images.
Business powerpoint presentations process diagram six decisions cycle flow ch...SlideTeam.net
The document describes how to edit and customize a business process diagram template in PowerPoint. It includes 6 steps represented by diverging arrows. At each step, text or images can be added and modified. All images are fully editable in terms of color, size, orientation, and other properties using the formatting and drawing tools in PowerPoint. This allows the template to be customized while maintaining a consistent visual structure.
Business powerpoint presentations process diagram six decisions cycle flow ch...SlideTeam.net
The document shows a diverging arrows business process diagram with 6 decision points. The diagram can be edited in PowerPoint by changing the text, ungrouping objects to edit individual parts, and changing colors. All images are fully editable and the diagram is meant to capture audience attention and bring presentations to life.
Layout of converging 12 steps linear flow cycle chart power point templatesSlideTeam.net
The document describes how to edit and customize a diagram template for presentations. It includes 12 steps represented by text blocks that converge on the center. The text blocks and overall diagram can be edited by changing colors, sizes, orientations, and positions. All images in the template are fully editable in PowerPoint to customize the presentation to the user's needs and capture audience attention.
Correlated circular diverging 9 stages process cycle network power point temp...SlideTeam.net
The document describes how to edit and customize diagram elements in PowerPoint. It shows a 9 stage correlated circular diverging diagram template that can be edited. Instructions are provided on how to ungroup objects, change colors, and edit colors using built-in theme colors. The purpose is to allow users to bring presentations to life by customizing diagrams and capturing audience attention.
Nine stages diverging factors flow diagram processs and power point slidesSlideTeam.net
The document describes how to edit and customize a flow diagram template for presentations. It includes instructions on ungrouping objects, changing colors, and editing colors using built-in theme colors. The template contains a 9 stage diverging factors flow diagram that can be customized with text and colors then downloaded to bring presentations to life.
Similar to Steps to sell a business value engage marketing 2 powerpoint presentation templates. (20)
Group of nine coverging arrows circular layout process power point slidesSlideTeam.net
The document describes how to edit a group of nine converging arrows diagram in PowerPoint. It includes instructions on ungrouping the object, editing the color, and editing the color by theme colors. The diagram can be customized by changing the color, size, and orientation of any icon. All images are fully editable in PowerPoint.
Four leading reason for cause cycle process diagram power point slidesSlideTeam.net
The document discusses editing images in PowerPoint. It provides instructions on how to ungroup objects, edit colors, and change colors using theme colors. The key steps are to right click objects to ungroup or access formatting options, select fill and color options to change the appearance, and choose from built-in theme colors.
Three converging arrows managing process layout cycle network power point slidesSlideTeam.net
The document describes how to edit icons in a PowerPoint presentation. It provides instructions on ungrouping objects, changing colors, and using theme colors. The steps include right clicking objects, choosing format options, and selecting fill and color options. The overall purpose is to demonstrate how to customize icons and make images fully editable.
Six coverging arrows for process to carried out charts and power point slidesSlideTeam.net
The document describes how to edit a diagram template with six converging arrows. Key points:
- The template can be used to bring presentations to life and capture audiences' attention.
- All images are 100% editable in PowerPoint, allowing the user to change color, size, and orientation of any icon.
- To ungroup objects, right click, select "Ungroup", and drag the selection arrow over parts to edit individually.
- To change an object's color, right click it, select "Format Shape", and choose a "Fill" color or gradient from the options provided. Colors can also be changed using the built-in theme colors.
Templates process diagram with diverging arrows circular layout power point s...SlideTeam.net
The document is an illustration of a business process diagram with diverging arrows. It shows a process splitting into multiple parallel processes represented by arrows branching in different directions. All images in the diagram are fully editable in PowerPoint and can be modified by changing properties like color, size, and orientation. The document provides instructions on how to perform actions like ungrouping objects and editing colors using options in the PowerPoint interface.
Steps layout with converging arrows pointing to center cycle process power po...SlideTeam.net
The document describes how to edit icons in a PowerPoint presentation. It provides instructions for ungrouping objects, editing colors, and changing colors using built-in theme colors. The steps allow presenters to customize icons by changing their size, orientation, and colors to suit their liking.
Diverging arrows pointing different directions circular motion network power ...SlideTeam.net
The document shows a diagram template with diverging arrows pointing in different directions. The template can be customized with text in 8 boxes to bring presentations to life and capture audience attention. The images are fully editable in PowerPoint.
Diverging arrow process project activity diagram cycle power point slidesSlideTeam.net
The document describes a diverging arrow process project activity diagram. It includes steps numbered 1 through 5 with arrows connecting each step. Text placeholders throughout suggest editing the text to describe your own process. The document encourages downloading the diagram and editing it in PowerPoint to bring your own presentation to life and capture your audience's attention. It specifies that all images are 100% editable in terms of color, size, orientation, and text.
Diverging arrows graphical view of different aspects cycle flow chart power p...SlideTeam.net
The document describes how to edit and customize diverging arrow diagrams created in PowerPoint. It includes 6 arrows branching from a central point and labeled text boxes that can be edited. The summary provides instructions on how to:
1. Ungroup individual elements to edit them separately.
2. Change colors by right clicking, selecting format shape, and choosing a solid or gradient fill color.
3. Change colors using built-in theme colors under the Design tab.
Business powerpoint templates download process diagram cycleSlideTeam.net
The document is a 9 step converging arrows business process diagram template that allows users to customize each step with text and download the finished diagram. It provides an editable template to create a process flow chart for presentations.
Arrow diagram shows required order of tasks arrows software power point templ...SlideTeam.net
The document describes how to edit an arrow diagram in PowerPoint. It outlines the following steps:
1. Ungroup the object by right clicking, selecting group, and then ungroup to edit individual elements.
2. Edit the color of shapes by right clicking, selecting format shape, and choosing a solid or gradient fill color from the options.
3. Alternatively, colors can be changed by selecting a shape and choosing from the built-in theme colors in the design tab.
8 steps converging arrows workflow diagram chart software power point templatesSlideTeam.net
The document describes an 8 step converging arrows workflow diagram template that can be customized with text and logos. Key points:
- It is an 8 step workflow diagram template with converging arrows and text/logo placeholders at each step.
- All images are 100% editable in PowerPoint so the colors, sizes, and orientations of the icons and arrows can be changed to suit the presentation needs.
- The template allows users to easily create customized workflow diagrams to bring presentations to life and capture audience attention.
An illustration of pointing arrows circular layout diagram power point slidesSlideTeam.net
The document shows how to edit pointing arrow diagrams in PowerPoint. It demonstrates how to ungroup objects, change colors, and select from built-in theme colors. Steps include right clicking objects, using format shape options, and choosing fill and color options. The goal is to allow customizing arrow diagrams by changing size, color, and orientation of icons.
10 converging steps of a single process arrows software power point slidesSlideTeam.net
The document describes how to edit icons in PowerPoint presentations. It explains how to ungroup objects, change the color of objects by using the format shape dialog box or theme colors, and change the size and orientation of icons. The overall process described allows presenters to customize icons for their PowerPoint presentations.
Arrow diagram indicate the tasks charts and networks power point templatesSlideTeam.net
The document describes how to edit an arrow diagram template in PowerPoint. It includes instructions on ungrouping objects, changing colors, and editing colors using built-in theme colors. The template contains editable arrows and text that can be customized to bring a presentation to life and capture an audience's attention.
7 stages diverging arrows schematic diagram circular chart power point slidesSlideTeam.net
The document describes how to edit an 7 Stages Diverging Arrows Schematic Diagram. It consists of 7 stages represented by arrows that can be customized with text and logos. The images are fully editable in PowerPoint to change color, size, orientation or grouping of icons. Instructions are provided on ungrouping objects, editing colors using the format shape dialog box or theme colors.
7 steps coverging arrows process pathway circular flow chart power point slidesSlideTeam.net
The document describes how to edit icons in a 7-step converging arrows process pathway diagram in PowerPoint. It explains how to ungroup objects, change colors by selecting objects and using the format shape dialog box or theme colors, and resize or reorient icons as needed. The purpose is to allow fully customizable editing of icons to suit the presenter's liking.
7 stages diverging arrow process diagram circular flow chart power point slidesSlideTeam.net
The document describes a 7 stages diverging arrow process diagram template for PowerPoint. It includes instructions on how to edit the diagram template by ungrouping objects, changing colors, and using theme colors. The template contains editable text boxes and arrows to depict a 7 stage process and is intended to bring presentations to life and capture audience attention.
5 diverging arrows alternative paths charts and power point templatesSlideTeam.net
The document shows 5 diverging arrows with alternative paths and text boxes that can be edited in PowerPoint. The arrows represent alternative paths that a presentation can take. The text boxes throughout the diagram can be modified by right clicking and editing text. Additionally, the colors, size, and orientation of icons in the diagram can be altered to suit preferences.
5 steps converging arrows towards center process software power point templatesSlideTeam.net
The document describes a 5 step process with converging arrows towards the center. It includes instructions on how to edit and customize the diagram elements in PowerPoint, including ungrouping objects, changing colors, and using built-in theme colors. The goal is to bring presentations to life and capture audience attention.
HCL Notes und Domino Lizenzkostenreduzierung in der Welt von DLAUpanagenda
Webinar Recording: https://www.panagenda.com/webinars/hcl-notes-und-domino-lizenzkostenreduzierung-in-der-welt-von-dlau/
DLAU und die Lizenzen nach dem CCB- und CCX-Modell sind für viele in der HCL-Community seit letztem Jahr ein heißes Thema. Als Notes- oder Domino-Kunde haben Sie vielleicht mit unerwartet hohen Benutzerzahlen und Lizenzgebühren zu kämpfen. Sie fragen sich vielleicht, wie diese neue Art der Lizenzierung funktioniert und welchen Nutzen sie Ihnen bringt. Vor allem wollen Sie sicherlich Ihr Budget einhalten und Kosten sparen, wo immer möglich. Das verstehen wir und wir möchten Ihnen dabei helfen!
Wir erklären Ihnen, wie Sie häufige Konfigurationsprobleme lösen können, die dazu führen können, dass mehr Benutzer gezählt werden als nötig, und wie Sie überflüssige oder ungenutzte Konten identifizieren und entfernen können, um Geld zu sparen. Es gibt auch einige Ansätze, die zu unnötigen Ausgaben führen können, z. B. wenn ein Personendokument anstelle eines Mail-Ins für geteilte Mailboxen verwendet wird. Wir zeigen Ihnen solche Fälle und deren Lösungen. Und natürlich erklären wir Ihnen das neue Lizenzmodell.
Nehmen Sie an diesem Webinar teil, bei dem HCL-Ambassador Marc Thomas und Gastredner Franz Walder Ihnen diese neue Welt näherbringen. Es vermittelt Ihnen die Tools und das Know-how, um den Überblick zu bewahren. Sie werden in der Lage sein, Ihre Kosten durch eine optimierte Domino-Konfiguration zu reduzieren und auch in Zukunft gering zu halten.
Diese Themen werden behandelt
- Reduzierung der Lizenzkosten durch Auffinden und Beheben von Fehlkonfigurationen und überflüssigen Konten
- Wie funktionieren CCB- und CCX-Lizenzen wirklich?
- Verstehen des DLAU-Tools und wie man es am besten nutzt
- Tipps für häufige Problembereiche, wie z. B. Team-Postfächer, Funktions-/Testbenutzer usw.
- Praxisbeispiele und Best Practices zum sofortigen Umsetzen
Dive into the realm of operating systems (OS) with Pravash Chandra Das, a seasoned Digital Forensic Analyst, as your guide. 🚀 This comprehensive presentation illuminates the core concepts, types, and evolution of OS, essential for understanding modern computing landscapes.
Beginning with the foundational definition, Das clarifies the pivotal role of OS as system software orchestrating hardware resources, software applications, and user interactions. Through succinct descriptions, he delineates the diverse types of OS, from single-user, single-task environments like early MS-DOS iterations, to multi-user, multi-tasking systems exemplified by modern Linux distributions.
Crucial components like the kernel and shell are dissected, highlighting their indispensable functions in resource management and user interface interaction. Das elucidates how the kernel acts as the central nervous system, orchestrating process scheduling, memory allocation, and device management. Meanwhile, the shell serves as the gateway for user commands, bridging the gap between human input and machine execution. 💻
The narrative then shifts to a captivating exploration of prominent desktop OSs, Windows, macOS, and Linux. Windows, with its globally ubiquitous presence and user-friendly interface, emerges as a cornerstone in personal computing history. macOS, lauded for its sleek design and seamless integration with Apple's ecosystem, stands as a beacon of stability and creativity. Linux, an open-source marvel, offers unparalleled flexibility and security, revolutionizing the computing landscape. 🖥️
Moving to the realm of mobile devices, Das unravels the dominance of Android and iOS. Android's open-source ethos fosters a vibrant ecosystem of customization and innovation, while iOS boasts a seamless user experience and robust security infrastructure. Meanwhile, discontinued platforms like Symbian and Palm OS evoke nostalgia for their pioneering roles in the smartphone revolution.
The journey concludes with a reflection on the ever-evolving landscape of OS, underscored by the emergence of real-time operating systems (RTOS) and the persistent quest for innovation and efficiency. As technology continues to shape our world, understanding the foundations and evolution of operating systems remains paramount. Join Pravash Chandra Das on this illuminating journey through the heart of computing. 🌟
Best 20 SEO Techniques To Improve Website Visibility In SERPPixlogix Infotech
Boost your website's visibility with proven SEO techniques! Our latest blog dives into essential strategies to enhance your online presence, increase traffic, and rank higher on search engines. From keyword optimization to quality content creation, learn how to make your site stand out in the crowded digital landscape. Discover actionable tips and expert insights to elevate your SEO game.
Introduction of Cybersecurity with OSS at Code Europe 2024Hiroshi SHIBATA
I develop the Ruby programming language, RubyGems, and Bundler, which are package managers for Ruby. Today, I will introduce how to enhance the security of your application using open-source software (OSS) examples from Ruby and RubyGems.
The first topic is CVE (Common Vulnerabilities and Exposures). I have published CVEs many times. But what exactly is a CVE? I'll provide a basic understanding of CVEs and explain how to detect and handle vulnerabilities in OSS.
Next, let's discuss package managers. Package managers play a critical role in the OSS ecosystem. I'll explain how to manage library dependencies in your application.
I'll share insights into how the Ruby and RubyGems core team works to keep our ecosystem safe. By the end of this talk, you'll have a better understanding of how to safeguard your code.
Driving Business Innovation: Latest Generative AI Advancements & Success StorySafe Software
Are you ready to revolutionize how you handle data? Join us for a webinar where we’ll bring you up to speed with the latest advancements in Generative AI technology and discover how leveraging FME with tools from giants like Google Gemini, Amazon, and Microsoft OpenAI can supercharge your workflow efficiency.
During the hour, we’ll take you through:
Guest Speaker Segment with Hannah Barrington: Dive into the world of dynamic real estate marketing with Hannah, the Marketing Manager at Workspace Group. Hear firsthand how their team generates engaging descriptions for thousands of office units by integrating diverse data sources—from PDF floorplans to web pages—using FME transformers, like OpenAIVisionConnector and AnthropicVisionConnector. This use case will show you how GenAI can streamline content creation for marketing across the board.
Ollama Use Case: Learn how Scenario Specialist Dmitri Bagh has utilized Ollama within FME to input data, create custom models, and enhance security protocols. This segment will include demos to illustrate the full capabilities of FME in AI-driven processes.
Custom AI Models: Discover how to leverage FME to build personalized AI models using your data. Whether it’s populating a model with local data for added security or integrating public AI tools, find out how FME facilitates a versatile and secure approach to AI.
We’ll wrap up with a live Q&A session where you can engage with our experts on your specific use cases, and learn more about optimizing your data workflows with AI.
This webinar is ideal for professionals seeking to harness the power of AI within their data management systems while ensuring high levels of customization and security. Whether you're a novice or an expert, gain actionable insights and strategies to elevate your data processes. Join us to see how FME and AI can revolutionize how you work with data!
Building Production Ready Search Pipelines with Spark and MilvusZilliz
Spark is the widely used ETL tool for processing, indexing and ingesting data to serving stack for search. Milvus is the production-ready open-source vector database. In this talk we will show how to use Spark to process unstructured data to extract vector representations, and push the vectors to Milvus vector database for search serving.
Have you ever been confused by the myriad of choices offered by AWS for hosting a website or an API?
Lambda, Elastic Beanstalk, Lightsail, Amplify, S3 (and more!) can each host websites + APIs. But which one should we choose?
Which one is cheapest? Which one is fastest? Which one will scale to meet our needs?
Join me in this session as we dive into each AWS hosting service to determine which one is best for your scenario and explain why!
Salesforce Integration for Bonterra Impact Management (fka Social Solutions A...Jeffrey Haguewood
Sidekick Solutions uses Bonterra Impact Management (fka Social Solutions Apricot) and automation solutions to integrate data for business workflows.
We believe integration and automation are essential to user experience and the promise of efficient work through technology. Automation is the critical ingredient to realizing that full vision. We develop integration products and services for Bonterra Case Management software to support the deployment of automations for a variety of use cases.
This video focuses on integration of Salesforce with Bonterra Impact Management.
Interested in deploying an integration with Salesforce for Bonterra Impact Management? Contact us at sales@sidekicksolutionsllc.com to discuss next steps.
Nunit vs XUnit vs MSTest Differences Between These Unit Testing Frameworks.pdfflufftailshop
When it comes to unit testing in the .NET ecosystem, developers have a wide range of options available. Among the most popular choices are NUnit, XUnit, and MSTest. These unit testing frameworks provide essential tools and features to help ensure the quality and reliability of code. However, understanding the differences between these frameworks is crucial for selecting the most suitable one for your projects.
Skybuffer AI: Advanced Conversational and Generative AI Solution on SAP Busin...Tatiana Kojar
Skybuffer AI, built on the robust SAP Business Technology Platform (SAP BTP), is the latest and most advanced version of our AI development, reaffirming our commitment to delivering top-tier AI solutions. Skybuffer AI harnesses all the innovative capabilities of the SAP BTP in the AI domain, from Conversational AI to cutting-edge Generative AI and Retrieval-Augmented Generation (RAG). It also helps SAP customers safeguard their investments into SAP Conversational AI and ensure a seamless, one-click transition to SAP Business AI.
With Skybuffer AI, various AI models can be integrated into a single communication channel such as Microsoft Teams. This integration empowers business users with insights drawn from SAP backend systems, enterprise documents, and the expansive knowledge of Generative AI. And the best part of it is that it is all managed through our intuitive no-code Action Server interface, requiring no extensive coding knowledge and making the advanced AI accessible to more users.
Digital Marketing Trends in 2024 | Guide for Staying AheadWask
https://www.wask.co/ebooks/digital-marketing-trends-in-2024
Feeling lost in the digital marketing whirlwind of 2024? Technology is changing, consumer habits are evolving, and staying ahead of the curve feels like a never-ending pursuit. This e-book is your compass. Dive into actionable insights to handle the complexities of modern marketing. From hyper-personalization to the power of user-generated content, learn how to build long-term relationships with your audience and unlock the secrets to success in the ever-shifting digital landscape.
A Comprehensive Guide to DeFi Development Services in 2024Intelisync
DeFi represents a paradigm shift in the financial industry. Instead of relying on traditional, centralized institutions like banks, DeFi leverages blockchain technology to create a decentralized network of financial services. This means that financial transactions can occur directly between parties, without intermediaries, using smart contracts on platforms like Ethereum.
In 2024, we are witnessing an explosion of new DeFi projects and protocols, each pushing the boundaries of what’s possible in finance.
In summary, DeFi in 2024 is not just a trend; it’s a revolution that democratizes finance, enhances security and transparency, and fosters continuous innovation. As we proceed through this presentation, we'll explore the various components and services of DeFi in detail, shedding light on how they are transforming the financial landscape.
At Intelisync, we specialize in providing comprehensive DeFi development services tailored to meet the unique needs of our clients. From smart contract development to dApp creation and security audits, we ensure that your DeFi project is built with innovation, security, and scalability in mind. Trust Intelisync to guide you through the intricate landscape of decentralized finance and unlock the full potential of blockchain technology.
Ready to take your DeFi project to the next level? Partner with Intelisync for expert DeFi development services today!
How to Interpret Trends in the Kalyan Rajdhani Mix Chart.pdfChart Kalyan
A Mix Chart displays historical data of numbers in a graphical or tabular form. The Kalyan Rajdhani Mix Chart specifically shows the results of a sequence of numbers over different periods.
Taking AI to the Next Level in Manufacturing.pdfssuserfac0301
Read Taking AI to the Next Level in Manufacturing to gain insights on AI adoption in the manufacturing industry, such as:
1. How quickly AI is being implemented in manufacturing.
2. Which barriers stand in the way of AI adoption.
3. How data quality and governance form the backbone of AI.
4. Organizational processes and structures that may inhibit effective AI adoption.
6. Ideas and approaches to help build your organization's AI strategy.
Let's Integrate MuleSoft RPA, COMPOSER, APM with AWS IDP along with Slackshyamraj55
Discover the seamless integration of RPA (Robotic Process Automation), COMPOSER, and APM with AWS IDP enhanced with Slack notifications. Explore how these technologies converge to streamline workflows, optimize performance, and ensure secure access, all while leveraging the power of AWS IDP and real-time communication via Slack notifications.
Steps to sell a business value engage marketing 2 powerpoint presentation templates.
1. STEPS TO SELL A BUSINESS - Style 2
The Close Value
Agreement
Definitive Purchase 11
Agreement (DPA)
1
Independent
10 2 Valuation
Your Text Goes Here
Due Diligence Your Text Goes here
9 Download this awesome
diagram
Bring your presentation 3 Engage
to life
Capture your audience’s
Letter Of 8 attention
Intent (LOI)
4 CBR
7
6 5 Blind
Negotiating
Text
Here
Text
Profile
Text Text
Here Here Text
Text
Text
www.slideteam.net Marketing Your logo
2. STEPS TO SELL A BUSINESS - Style 2
Value
11 1
10 2
Your Text Goes Here
Your Text Goes here
9 Download this awesome
diagram
Bring your presentation 3
to life
Capture your audience’s
8 attention
4
7
6 5
www.slideteam.net Your logo
3. STEPS TO SELL A BUSINESS - Style 2
Value
11 1
Independent
10 2 Valuation
Your Text Goes Here
Your Text Goes here
9 Download this awesome
diagram
Bring your presentation 3
to life
Capture your audience’s
8 attention
4
7
6 5
www.slideteam.net Your logo
4. STEPS TO SELL A BUSINESS - Style 2
Value
11 1
Independent
10 2 Valuation
Your Text Goes Here
Your Text Goes here
9 Download this awesome
diagram
Bring your presentation 3 Engage
to life
Capture your audience’s
8 attention
4
7
6 5
www.slideteam.net Your logo
5. STEPS TO SELL A BUSINESS - Style 2
Value
11 1
Independent
10 2 Valuation
Your Text Goes Here
Your Text Goes here
9 Download this awesome
diagram
Bring your presentation 3 Engage
to life
Capture your audience’s
8 attention
4 CBR
7
6 5
www.slideteam.net Your logo
6. STEPS TO SELL A BUSINESS - Style 2
Value
11 1
Independent
10 2 Valuation
Your Text Goes Here
Your Text Goes here
9 Download this awesome
diagram
Bring your presentation 3 Engage
to life
Capture your audience’s
8 attention
4 CBR
7
6 5 Blind
Profile
www.slideteam.net Your logo
7. STEPS TO SELL A BUSINESS - Style 2
Value
11 1
Independent
10 2 Valuation
Your Text Goes Here
Your Text Goes here
9 Download this awesome
diagram
Bring your presentation 3 Engage
to life
Capture your audience’s
8 attention
4 CBR
7
6 5 Blind
Text
Here
Text
Profile
Text Text
Here Here Text
Text
Text
www.slideteam.net Marketing Your logo
8. STEPS TO SELL A BUSINESS - Style 2
Value
11 1
Independent
10 2 Valuation
Your Text Goes Here
Your Text Goes here
9 Download this awesome
diagram
Bring your presentation 3 Engage
to life
Capture your audience’s
8 attention
4 CBR
7
6 5 Blind
Negotiating
Text
Here
Text
Profile
Text Text
Here Here Text
Text
Text
www.slideteam.net Marketing Your logo
9. STEPS TO SELL A BUSINESS - Style 2
Value
11 1
Independent
10 2 Valuation
Your Text Goes Here
Your Text Goes here
9 Download this awesome
diagram
Bring your presentation 3 Engage
to life
Capture your audience’s
Letter Of 8 attention
Intent (LOI)
4 CBR
7
6 5 Blind
Negotiating
Text
Here
Text
Profile
Text Text
Here Here Text
Text
Text
www.slideteam.net Marketing Your logo
10. STEPS TO SELL A BUSINESS - Style 2
Value
11 1
Independent
10 2 Valuation
Your Text Goes Here
Due Diligence Your Text Goes here
9 Download this awesome
diagram
Bring your presentation 3 Engage
to life
Capture your audience’s
Letter Of 8 attention
Intent (LOI)
4 CBR
7
6 5 Blind
Negotiating
Text
Here
Text
Profile
Text Text
Here Here Text
Text
Text
www.slideteam.net Marketing Your logo
11. STEPS TO SELL A BUSINESS - Style 2
Value
Agreement
Definitive Purchase 11
Agreement (DPA)
1
Independent
10 2 Valuation
Your Text Goes Here
Due Diligence Your Text Goes here
9 Download this awesome
diagram
Bring your presentation 3 Engage
to life
Capture your audience’s
Letter Of 8 attention
Intent (LOI)
4 CBR
7
6 5 Blind
Negotiating
Text
Here
Text
Profile
Text Text
Here Here Text
Text
Text
www.slideteam.net Marketing Your logo
12. STEPS TO SELL A BUSINESS - Style 2
The Close Value
Agreement
Definitive Purchase 11
Agreement (DPA)
1
Independent
10 2 Valuation
Your Text Goes Here
Due Diligence Your Text Goes here
9 Download this awesome
diagram
Bring your presentation 3 Engage
to life
Capture your audience’s
Letter Of 8 attention
Intent (LOI)
4 CBR
7
6 5 Blind
Negotiating
Text
Here
Text
Profile
Text Text
Here Here Text
Text
Text
www.slideteam.net Marketing Your logo
13. All images are 100% editable in Powerpoint
“Change color, size and orientation of any icon to your liking”
www.slideteam.net
14. Ungrouping the object
2
1
3
1. Right click the object.
2. Choose Group and then Ungroup.
3. Click beside the object and drag the arrow over it.
www.slideteam.net
15. Edit Color
1 2 3
1. Right click the object
2. Choose Format Shape in the dialog box
3. Choose “Fill” in the Format Shape box then “Solid” or “Gradient”
depending on the appearance of the object. Change colour as
shown in the picture.
www.slideteam.net