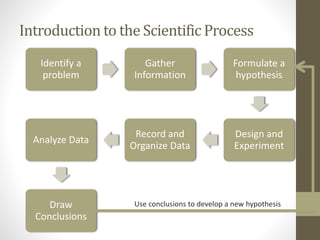
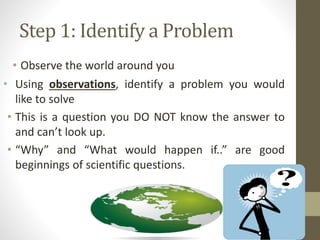
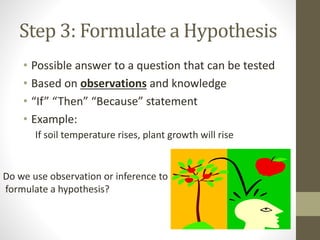
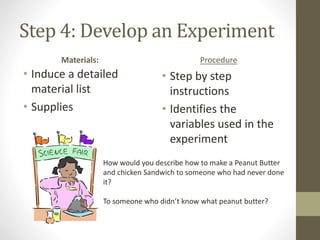
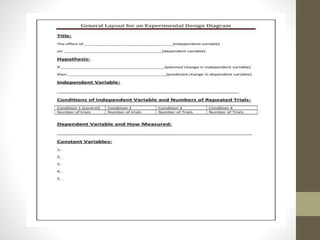
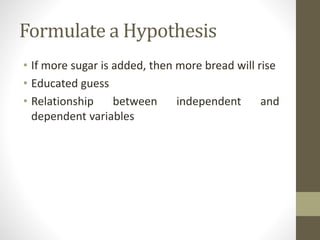
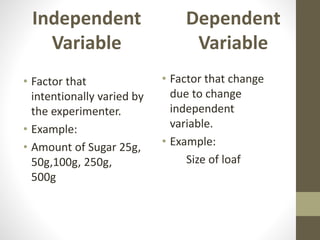
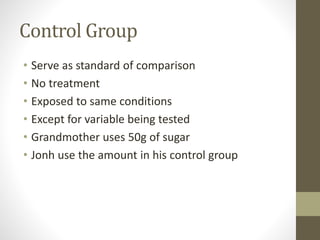
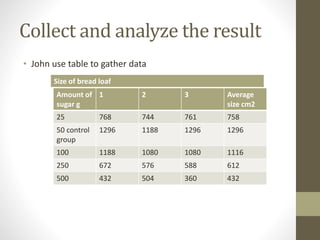
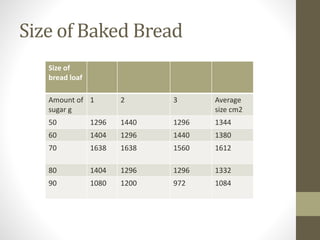
Steps of Scientific
Method
Theory
Lecture # 3 & 4
HND-603
Research Planning and Scientific Writing
3(3-0)
Semester 7th
Contents
• Scientific method
• Introduction
• Steps of scientific method
• Practical Example
• Summary
Introduction to the Scientific Method
• A logical, problem
solving technique
Introduction to the Scientific Process
Identify a
problem
Gather
Information
Formulate a
hypothesis
Design and
Experiment
Record and
Organize Data
Analyze Data
Draw
Conclusions
Use conclusions to develop a new hypothesis
Step 1: Identify a Problem
• Observe the world around you
• Using observations, identify a problem you would
like to solve
• This is a question you DO NOT know the answer to
and can’t look up.
• “Why” and “What would happen if..” are good
beginnings of scientific questions.
Step 2: Gather Information
• Use references to do
background research
• Books
• Journals
• Magazines
• Internet
• TV
• Videos
• Interview Experts
www.goldstarexterminators.net
Step 3: Formulate a Hypothesis
• Possible answer to a question that can be tested
• Based on observations and knowledge
• “If” “Then” “Because” statement
• Example:
If soil temperature rises, plant growth will rise
Do we use observation or inference to
formulate a hypothesis?
Step 4: Develop an Experiment
Materials:
• Induce a detailed
material list
• Supplies
Procedure
• Step by step
instructions
• Identifies the
variables used in the
experiment
How would you describe how to make a Peanut Butter
and chicken Sandwich to someone who had never done
it?
To someone who didn’t know what peanut butter?
Step 5: Analyze Data
• “Modify the procedure if needed
• Confirm the result by retesting
• Compare and look for trends and patterns using
graphs
Step 6: Make Conclusions
• You must repeat the experiment to make the data
valid
• You should run your experiment at least 3 times to
confirm your results
• You can run all the experiments at one time, or
run one after the other
• Each separate experiment is called a Repetition
(or Rep).
Step 7: Communicate the
Result
• Be prepared to present the project to the
audience.
• Except question from the audience.
Problem/ Question
• John watches his grandmother
• bake a bread
• He asked his grandmother what
• makes the bread rise.
• She explains that yeast releases
• a gas as it feeds on sugar
Observation/ Research
• John research the areas of baking fermentation
• To test his question
• He keeps all his information in a journal
Formulate a Hypothesis
• If more sugar is added, then more bread will rise
• Educated guess
• Relationship between independent and
dependent variables
Independent
Variable
• Factor that
intentionally varied by
the experimenter.
• Example:
• Amount of Sugar 25g,
50g,100g, 250g,
500g
Dependent
Variable
• Factor that change
due to change
independent
variable.
• Example:
Size of loaf
Control Group
• Serve as standard of comparison
• No treatment
• Exposed to same conditions
• Except for variable being tested
• Grandmother uses 50g of sugar
• Jonh use the amount in his control group
Constants
• Keep all other factors same
• Observe changes in bread
• Due to sugar amount
• Example
• Bread recipe, oven used rise time, cooking time,
type of pan temperature and humidity, Age of
yeast
Experiment
• John writes out his procedure along with
material list
• Trial:
John test each sugar variable 3 times
Collect and analyze the result
• John use table to gather data
Size of bread loaf
Amount of
sugar g
1 2 3 Average
size cm2
25 768 744 761 758
50 control
group
1296 1188 1296 1296
100 1188 1080 1080 1116
250 672 576 588 612
500 432 504 360 432
• John rejected his hypothesis
• Retest using amount of sugar between 50g to
100g
• Once again gather his material and carries out
his experiment
Size of Baked Bread
Size of
bread loaf
Amount of
sugar g
1 2 3 Average
size cm2
50 1296 1440 1296 1344
60 1404 1296 1440 1380
70 1638 1638 1560 1612
80 1404 1296 1296 1332
90 1080 1200 972 1084
Conclusion
• John finds that 70g of sugar produces the largest
loaf. His hypothesis is accepted
Communicate the result
• John tell his grandmother
• Prepares the project to present in his science
class
Summary
• What is Question ?
• Gathered all the information related to
experiment.
• Hypothesis either approved or rejected.
• Performed the experiment
• Collected and organized the results.
• Conclusion
• Shared the information

Steps of Scientific Method.pptx

  • 1.
    Steps of Scientific Method Theory Lecture# 3 & 4 HND-603 Research Planning and Scientific Writing 3(3-0) Semester 7th
  • 2.
    Contents • Scientific method •Introduction • Steps of scientific method • Practical Example • Summary
  • 3.
    Introduction to theScientific Method • A logical, problem solving technique
  • 4.
    Introduction to theScientific Process Identify a problem Gather Information Formulate a hypothesis Design and Experiment Record and Organize Data Analyze Data Draw Conclusions Use conclusions to develop a new hypothesis
  • 5.
    Step 1: Identifya Problem • Observe the world around you • Using observations, identify a problem you would like to solve • This is a question you DO NOT know the answer to and can’t look up. • “Why” and “What would happen if..” are good beginnings of scientific questions.
  • 6.
    Step 2: GatherInformation • Use references to do background research • Books • Journals • Magazines • Internet • TV • Videos • Interview Experts www.goldstarexterminators.net
  • 7.
    Step 3: Formulatea Hypothesis • Possible answer to a question that can be tested • Based on observations and knowledge • “If” “Then” “Because” statement • Example: If soil temperature rises, plant growth will rise Do we use observation or inference to formulate a hypothesis?
  • 8.
    Step 4: Developan Experiment Materials: • Induce a detailed material list • Supplies Procedure • Step by step instructions • Identifies the variables used in the experiment How would you describe how to make a Peanut Butter and chicken Sandwich to someone who had never done it? To someone who didn’t know what peanut butter?
  • 9.
    Step 5: AnalyzeData • “Modify the procedure if needed • Confirm the result by retesting • Compare and look for trends and patterns using graphs
  • 10.
    Step 6: MakeConclusions • You must repeat the experiment to make the data valid • You should run your experiment at least 3 times to confirm your results • You can run all the experiments at one time, or run one after the other • Each separate experiment is called a Repetition (or Rep).
  • 11.
    Step 7: Communicatethe Result • Be prepared to present the project to the audience. • Except question from the audience.
  • 12.
    Problem/ Question • Johnwatches his grandmother • bake a bread • He asked his grandmother what • makes the bread rise. • She explains that yeast releases • a gas as it feeds on sugar
  • 13.
    Observation/ Research • Johnresearch the areas of baking fermentation • To test his question • He keeps all his information in a journal
  • 15.
    Formulate a Hypothesis •If more sugar is added, then more bread will rise • Educated guess • Relationship between independent and dependent variables
  • 16.
    Independent Variable • Factor that intentionallyvaried by the experimenter. • Example: • Amount of Sugar 25g, 50g,100g, 250g, 500g Dependent Variable • Factor that change due to change independent variable. • Example: Size of loaf
  • 17.
    Control Group • Serveas standard of comparison • No treatment • Exposed to same conditions • Except for variable being tested • Grandmother uses 50g of sugar • Jonh use the amount in his control group
  • 18.
    Constants • Keep allother factors same • Observe changes in bread • Due to sugar amount • Example • Bread recipe, oven used rise time, cooking time, type of pan temperature and humidity, Age of yeast
  • 19.
    Experiment • John writesout his procedure along with material list • Trial: John test each sugar variable 3 times
  • 20.
    Collect and analyzethe result • John use table to gather data Size of bread loaf Amount of sugar g 1 2 3 Average size cm2 25 768 744 761 758 50 control group 1296 1188 1296 1296 100 1188 1080 1080 1116 250 672 576 588 612 500 432 504 360 432
  • 21.
    • John rejectedhis hypothesis • Retest using amount of sugar between 50g to 100g • Once again gather his material and carries out his experiment
  • 22.
    Size of BakedBread Size of bread loaf Amount of sugar g 1 2 3 Average size cm2 50 1296 1440 1296 1344 60 1404 1296 1440 1380 70 1638 1638 1560 1612 80 1404 1296 1296 1332 90 1080 1200 972 1084
  • 23.
    Conclusion • John findsthat 70g of sugar produces the largest loaf. His hypothesis is accepted
  • 24.
    Communicate the result •John tell his grandmother • Prepares the project to present in his science class
  • 25.
    Summary • What isQuestion ? • Gathered all the information related to experiment. • Hypothesis either approved or rejected. • Performed the experiment • Collected and organized the results. • Conclusion • Shared the information

Editor's Notes

  • #4 Who is the scientist?
  • #6 Develop a question or problem that can be solved through experimentation
  • #9 Develop and follow a procedure, A list of all the things you need
  • #10 Collect and analyze the data Tables, graphs and photographs
  • #11 Include statement that accept or reject the hypothesis Make recommendations for further study and possible improvements to the procedure
  • #13 John wonders if the amount of sugar used in the recipe will affect the size of bread loaf
  • #15 Johns talks with his teacher
  • #18 All experiment should have control group
  • #19 The constant in experiment are all factors that the experimenter attempt to keep the same Variation in sugar amount
  • #20  Trial: Refer to replicate groups that are exposed to same condition
  • #21 Notices his control work the best
  • #23 9