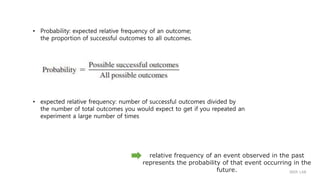
Chapter 3. Some Key Ingredients for Inferential Statistics
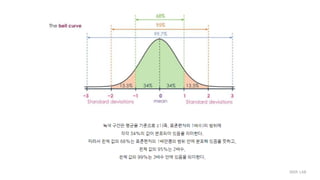
- Z Scores, the Normal Curve, Sample versus Population, and Probability
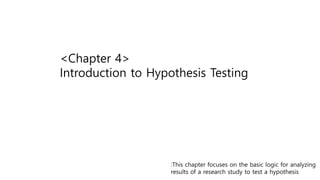
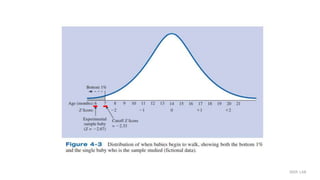
Chapter 4. Introduction to Hypothesis Testing
- basic logic for analyzing results of a research study to test a hypothesis


![[확률통계]04모수추정](https://cdn.slidesharecdn.com/ss_thumbnails/statistics4-190131081748-thumbnail.jpg?width=640&height=640&fit=bounds)


![제 23회 보아즈(BOAZ) 빅데이터 컨퍼런스 - [픽미] : 디저트 큐레이팅 플랫폼, 딸기로픽을 위한 데이터 기반 의사결정 프로세스 구축](https://cdn.slidesharecdn.com/ss_thumbnails/3-2boaz23rdconference-260203102931-15458767-thumbnail.jpg?width=640&height=640&fit=bounds)
![제 23회 보아즈(BOAZ) 빅데이터 컨퍼런스 - [어벤정스] : ToonP](https://cdn.slidesharecdn.com/ss_thumbnails/2-2boaz23rdconference-260203102006-3a01358e-thumbnail.jpg?width=640&height=640&fit=bounds)
![제 23회 보아즈(BOAZ) 빅데이터 컨퍼런스 - [JJAI] : Re:Buy - 고객 행동 패턴 기반 재구매 시점 예측 개인화 CRM 시스템](https://cdn.slidesharecdn.com/ss_thumbnails/1-3boaz23rdconferencejjai-260203100705-ab1ce027-thumbnail.jpg?width=640&height=640&fit=bounds)
![제 23회 보아즈(BOAZ) 빅데이터 컨퍼런스 - [OnLog]: Real-time Edge-to-Cloud Data Pipeline fo...](https://cdn.slidesharecdn.com/ss_thumbnails/3-4boaz23rdconferenceonlog-260204093729-11983ba7-thumbnail.jpg?width=640&height=640&fit=bounds)
![제 23회 보아즈(BOAZ) 빅데이터 컨퍼런스 - [북적북적] : 데이터 기반 독립출판사,서점 경영지원 대시보드](https://cdn.slidesharecdn.com/ss_thumbnails/1-1boaz23rdconference-260203093712-78abc1a0-thumbnail.jpg?width=640&height=640&fit=bounds)
![제 23회 보아즈(BOAZ) 빅데이터 컨퍼런스 - [백 투 더 엔지] : 분산환경 주문 이벤트 처리 플랫폼](https://cdn.slidesharecdn.com/ss_thumbnails/1-2boaz23rdconference-260203100241-73ce0aa8-thumbnail.jpg?width=640&height=640&fit=bounds)
![제 23회 보아즈(BOAZ) 빅데이터 컨퍼런스 - [F4] : 시켜줘, 금잔디 명예 플로리스트](https://cdn.slidesharecdn.com/ss_thumbnails/3-3boaz23rdconferencef4-260204011323-1cb48ec9-thumbnail.jpg?width=640&height=640&fit=bounds)
![제 23회 보아즈(BOAZ) 빅데이터 컨퍼런스 - [SimAI] : Omni_모든 콘텐츠 운영을 하나로](https://cdn.slidesharecdn.com/ss_thumbnails/1-4boaz23rdconferencesimai-260203101225-d673a594-thumbnail.jpg?width=640&height=640&fit=bounds)
![제 23회 보아즈(BOAZ) 빅데이터 컨퍼런스 - [셋이어때] : 헬퍼잇](https://cdn.slidesharecdn.com/ss_thumbnails/2-3boaz23rdconference-260203102432-6c8c7ed6-thumbnail.jpg?width=640&height=640&fit=bounds)
![제 23회 보아즈(BOAZ) 빅데이터 컨퍼런스 - [If Lab] : 실시간 투표 커뮤니티 서비스 기반 데이터 파이프라인 구축 및 성능 검증](https://cdn.slidesharecdn.com/ss_thumbnails/2-1boaz23rdconferenceiflab-260203101556-e51663dd-thumbnail.jpg?width=640&height=640&fit=bounds)