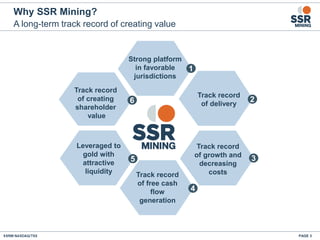
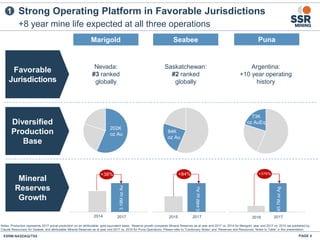
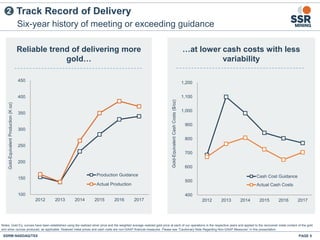
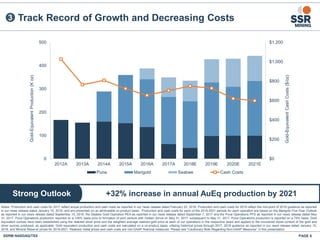
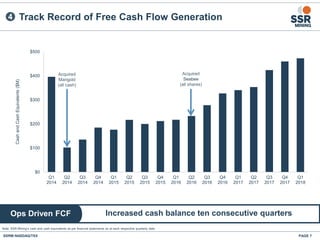
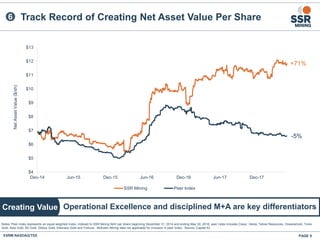
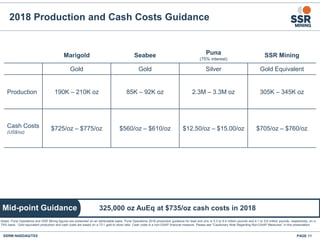
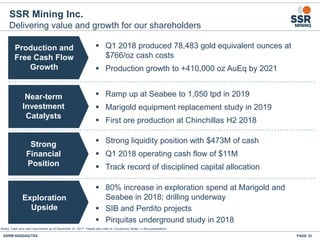
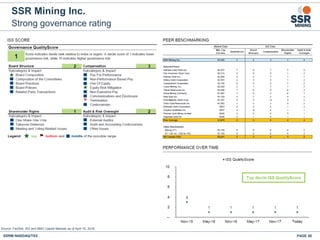
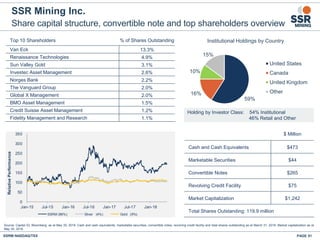
June 2018
A TRACK RECORD OF CREATING VALUE
Cautionary Notes
PAGE 2SSRM:NASDAQ/TSX
Cautionary Note Regarding Forward-Looking Statements
This presentation contai ns for ward-looking i nfor mation within the meani ng of C anadian securities laws and for war d-looking statements within the meaning of the U.S. Pri vate Securities Litigati on Reform Act of 1995 (collectivel y, “for ward-looking statements”).
All statements, other than statements of historical fact, are forward-looki ng statements. Generall y, for ward-looking statements can be identi fied by the use of words or phrases such as “expects,” “ antici pates,” “pl ans,” “projects,” “esti mates,” “assumes,” “intends,”
“strategy,” “goals,” “objectives,” “potential,” “believes,” or variations thereof, or stating that certain actions, events or results “ may,” “could,” “would,” “might” or “will” be taken, occur or be achieved, or the negative of any of these terms or similar expressions.
These for ward‐looking statements or information relate to, among other things: future producti on of preci ous metals; futur e costs of i nventor y, and cash costs and all-in sustaini ng costs (“AISC”) per payabl e ounce of preci ous metals sold; expected operating,
exploration and development expenditures; the prices of precious metals; the effects of laws, regulations and gover nment policies affecting our operations or potential futur e oper ations; future successful development of our projects; the sufficiency of our current
wor king capital , anticipated operating cash fl ow or our ability to raise necessary funds; esti mated producti on rates for precious metals; ti ming of devel opment and production and the cash costs and total costs of producti on at the Marigold mine, the Seabee
Gold Operation, Puna Operations and our other projects; the estimated cost of sustaining capital; our ability to discover new mineralization, to upgrade Mineral Resources and convert Miner al Resources to Mineral Reser ves, to extend forecasted mine life and
to i ncrease operati onal flexibility for the Marigold mi ne, the Seabee Gol d Operation and Puna Operations; opportunities to i ncrease the economics of the Marigold mi ne, the Seabee Gold Operati on and Puna Operati ons; our expected drill pr ograms at each of
the Marigold mine, the Seabee Gold Operation, Puna Operations and our other projects; timi ng for and potential of M arigold mine equipment repl acement study; timing and outcome of per mitting process for the Marigold mi ne EIS development; the anticipated
effect of haul truck and equi pment purchases at the M arigold mine on future production; expansion of the Seabee Gold Operati on based on the results of the Prelimi nar y Economic Assessment (“PEA”); the PEA repr esenting pr oduction growth, improved
margins and expansion of Miner al Resources; timing, amount and duration of future production of gold under the PEA; the estimates of economic r etur ns from the Seabee Gold Operati on under the PEA; expected timing for and potential of throughput ramp up
at the Seabee Gold Oper ation; the timi ng of the Pirquitas underground study and the potential for a Pirquitas underground operation to provide an additi onal, high grade ore str eam to the Pirquitas plant; expected timi ng of or e deli very from the Chinchillas
project to the Pirquitas mill and anticipated producti on resulting therefr om; expected ore supply generated from the Chinchillas project; the estimates of expected or anticipated economic returns from our mining pr ojects, including future sales of metals,
concentrate or other products; future successful exploration and development of our proj ects; ongoing or futur e development plans and capital replacement, improvement or remediati on programs; and our pl ans and expectati ons for our pr operties and
operations.
These forward-looking statements are subject to a variety of known and unknown risks, uncertainti es and other factors that could cause actual events or r esults to differ from those expr essed or i mplied, including, wi thout li mitation, the following: uncertainty of
production, development plans and cost esti mates for the Marigold mine, the Seabee Gold Oper ation, Puna Oper ations and our proj ects; our ability to repl ace Mineral Reserves; commodity price fl uctuati ons; political or economic i nstability and unexpected
regulator y changes; currency fluctuations; the possibility of future l osses; gener al economic condi tions; counterparty and mar ket risks related to the sale of our concentrate and metals; uncertai nty in the accur acy of Mineral Reserves and Mineral Resources
estimates and in our ability to extr act mineralizati on profitabl y; differences i n U.S. and Canadi an practices for reporting Mineral R eser ves and Mineral Resources; lack of suitable infrastructure or damage to existing infrastructure; future development risks,
including start-up delays and cost overruns; our ability to obtain adequate financi ng for further expl orati on and development programs and opportunities; uncertai nty in acquiring additional commercially mineable mineral rights; del ays i n obtai ning or failure to
obtain gover nmental permits, or non-compliance with our per mits; our ability to attract and retain qualified personnel and management; the impact of governmental r egulations, including health, safety and environmental regulations, including increased costs
and restrictions on operations due to compli ance with such regulations; unpredictable risks and hazards r elated to the development and operation of a mi ne or miner al pr operty that are beyond our control; reclamation and cl osure requirements for our mineral
properties; potential labour unrest, including labour actions by our unionized employees at Puna Oper ations; indigenous peoples’ title claims and rights to consultation and accommodation may affect our existi ng operations as well as development proj ects and
future acquisitions; certai n tr ansportation risks that could have a negati ve impact on our abilityto operate; assessments bytaxation authorities in multipl e jurisdictions; recover ability of value added tax and significant delays in the collecti on process in Argentina;
claims and legal proceedings, including adverse r ulings in litigation against us and/or our directors or officers; compliance with anti-corruption laws and internal controls, and increased regulator y compliance costs; complying with emerging climate change
regulations and the i mpact of cli mate change; fully r ealizing our inter est in deferred consi deration recei ved in connection wi th recent di vestitur es; fully r ealizing the val ue of our shareholdings in our mar ketable securities, due to changes i n price, liquidity or
disposal cost of such mar ketable securities; uncertainti es related to title to our mineral properties and the ability to obtain surface rights; the sufficiency of our insurance coverage; civil disobedience in the countries where our mineral pr operties ar e located;
oper ational safety and security risks; acti ons required to be taken by us under human rights l aw; competiti on in the mining industr y for mineral properties; our ability to complete and successfully integrate an announced acquisiti on; reputation l oss resulting in
decreased investor confidence, increased challenges i n developing and maintaining community relations and an impediment to our overall ability to advance our pr ojects; risks nor mally associated with the conduct of joint ventures; an event of default under our
converti ble notes may significantl yr educe our liquidity and adversel y affect our business; failure to meet covenants under our senior secured revolvi ng credit facility; i nformation systems security thr eats; conflicts of i nter est that could arise from certain of our
directors’ and officers’ involvement with other natural r esource compani es; other risks related to our common shares; and those other various risks and uncertainties identified under the heading “RiskFactors” in our most recent Annual Infor mation Form filed
with the Canadian securities regulatory authorities and included in our most recent Annual Report on Form 40-F filed with the U.S. Securities and Exchange Commission (“SEC”).
The foregoing list is not exhausti ve of all factors and assumptions which may have been used. We cannot assure you that actual events, perfor mance or results will be consistent with these for ward-looking statements, and management’s assumptions may
prove to be incorrect. Our forward-looki ng statements reflect current expectati ons regarding future events and operati ng perfor mance and speak onl y as of the date her eof and we do not assume any obligation to update for ward-looking statements if
circumstances or management’s beliefs, expectations or opinions should change other than as required by applicable law. For the reasons set forth above, you should not place undue reliance on forward-looking statements.
All references to “$” in this presentation are to U.S. dollars unless otherwise stated.
Qualified Persons
Except as other wise set out her ein, the scientific and technical information contained i n this presentation relating to each of the: Marigold mine has been reviewed and approved by Thomas Rice and James N . Car ver, each of whom is a SM E Registered
Member, a qualifi ed person under National Instr ument 43- 101 – Standards of Disclosur e for Mineral Projects (“NI 43-101”) and our empl oyee; Seabee Gold Operation has been revi ewed and appr oved byF. Carl Edmunds, P. Geo., a qualified person under NI
43-101 and our employee; and Puna Operations has been r eviewed and approved by Bruce Butcher, P. Eng., a qualified person under NI 43-101 and our employee. The qualified persons have verified the infor mation disclosed herein, including the sampling,
preparation, security and analytical procedures underlying such information, and are not aware of any significant risks and uncertainties that could be expected to affect the reliability or confidence in the information discussed herein.
Cautionary Note to U.S. Investors
This presentation includes Mineral R eser ves and Mineral Resources classification terms that comply with reporti ng standards in Canada and the Mineral Reser ves and the Mineral Resources estimates are made in accordance with NI 43-101. NI 43-101 is a
rule developed by the Canadi an Securities Admi nistrators that establishes standards for all public disclosur e an issuer makes of scientific and technical i nformation concerni ng miner al projects. These standards differ significantl y from the requirements of the
SEC set out i n SEC Industry Guide 7. Consequently, Mineral Reserves and Mineral Resources infor mation included in this presentation is not comparable to similar infor mation that would generally be disclosed by domestic U.S. reporting compani es subject to
the r eporting and discl osure requirements of the SEC. Under SEC standards, mi neralization may not be cl assified as a “reser ve” unless the deter mination has been made that the mi neralization could be economicall y produced or extr acted at the ti me the
reserve deter mination is made. In addition, the SEC’s disclosure standar ds normally do not per mit the inclusion of infor mation concerning “Measured Mineral Resources,” “Indicated Mineral Resources” or “Inferred Mineral Resources” or other descriptions of the
amount of mineralization in mineral deposits that do not constitute “reserves” by U.S. standards in documents filed with the SEC.
Cautionary Note Regarding Non-GAAP Measures
This presentati on includes certain ter ms or performance measures commonl y used i n the mining industry that are not defined under International Financial R eporting Standards (“IFRS”), i ncludi ng cash costs and AISC per payabl e ounce of preci ous metals sol d,
realized metal prices, adjusted attributable net income (loss) and adjusted basic attributable earnings (loss) per share. Non-GAAP financi al measures do not have any standardized meaning prescribed under IFRS and, therefore, may not be comparable to
similar measures r eported by other compani es. We believe that, in additi on to conventional measures pr epared in accordance with IFRS, certai n i nvestors use this i nfor mation to evaluate our perfor mance. The data presented is intended to pr ovide additional
infor mation and should not be considered in isolation or as a substitute for measures of perfor mance prepar ed in accordance with IFRS. These non-GAAP measures should be read in conjunction with our consolidated financial statements. R eaders should refer
to our management’s discussion and analysis, available under our corporate profile at www.sedar.com or on our website at www.ssrmining.com, under the heading “Non-GAAP and Additional GAAP Financial Measures”
PAGE 3
Track record
of free cash
flow
generation
Track record
of creating
shareholder
value
Track record
of growth and
decreasing
costs
Leveraged to
gold with
attractive
liquidity
Why SSR Mining?
A long-term track record of creating value
1
2
3
4
5
6
Strong platform
in favorable
jurisdictions
Track record
of delivery
2016
0
0.1
0.2
0.3
0.4
0.5
2017
84K
oz Au
73K
oz AuEq
202K
oz Au
PAGE 4
Nevada:
#3 ranked
globally
Argentina:
+10 year operating
history
Saskatchewan:
#2 ranked
globally
+8 year mine life expected at all three operations
Strong Operating Platform in Favorable Jurisdictions
3.19MozAu
1
Marigold Seabee
+38% +84
0.44MozAu
45.7MozAg
Notes: Production represents 2017 actual production on an attributable, gold equivalent basis. Reserve growth compares Mineral Reserves as at year end 2017 vs. 2014 for Marigold, year end 2017 vs. 2015 (as published by
Claude Resources) for Seabee, and attributable Mineral Reserves as at year end 2017 vs. 2016 for Puna Operations. Please refer to “Cautionary Notes” and “Reserves and Resources: Notes to Table” in this presentation.
2014 2017 2015 2017
Favorable
Jurisdictions
Diversified
Production
Base
Mineral
Reserves
Growth
+376%+84%
Puna
100
150
200
250
300
350
400
450
2012 2013 2014 2015 2016 2017
Gold-EquivalentProduction(Koz)
Production Guidance
Actual Production
Reliable trend of delivering more
gold…
400
500
600
700
800
900
1,000
1,100
1,200
2012 2013 2014 2015 2016 2017
Gold-EquivalentCashCosts($/oz)
Cash Cost Guidance
Actual Cash Costs
Six-year history of meeting or exceeding guidance
Track Record of Delivery
PAGE 5SSRM:NASDAQ/TSX
…at lower cash costs with less
variability
Notes: Gold Eq. ounces have been established using the realized silver price and the weighted average realized gold price at each of our operations in the respective years and applied to the recovered metal content of the gold
and silver ounces produced, as applicable. Realized metal prices and cash costs are non-GAAP financial measures. Please see "Cautionary Note Regarding Non-GAAP Measures” in this presentation.
2
PAGE 6SSRM:NASDAQ/TSX
+32% increase in annual AuEq production by 2021Strong Outlook
Track Record of Growth and Decreasing Costs3
Notes: Production and cash costs for 2017 reflect actual production and cash costs as reported in our news release dated February 22, 2018. Production and cash costs for 2018 reflect the mid-point of 2018 guidance as reported
in our news release dated January 15, 2018, and are presented on an attributable co-product basis. Production and cash costs for each of the 2019-2021 periods for each operation are based on the Marigold Five-Year Outlook
as reported in our news release dated September 15, 2016, the Seabee Gold Operation PEA as reported in our news release dated September 7, 2017 and the Puna Operations PFS as reported in our news release dated May
31, 2017. Puna Operations production reported on a 100% basis prior to formation of joint venture with Golden Arrow on May 31, 2017; subsequent to May 31, 2017, Puna Operations production is reported on a 75% basis. Gold
equivalent ounces have been established using the realized silver price and the weighted average realized gold price at each of our operations in the respective years and applied to the recovered metal content of the gold and
silver ounces produced, as applicable. Gold equivalent production and cash costs are calculated on a co-product basis, utilizing historical prices through 2017, 2018 guidance as reported in our news release dated January 15,
2018, and Mineral Reserve prices for 2019-2021. Realized metal prices and cash costs are non-GAAP financial measures. Please see "Cautionary Note Regarding Non-GAAP Measures” in this presentation.
$0
$200
$400
$600
$800
$1,000
$1,200
0
100
200
300
400
500
2012A 2013A 2014A 2015A 2016A 2017A 2018E 2019E 2020E 2021E
Gold-EquivalentCashCosts($/oz)
Gold-EquivalentProduction(Koz)
Puna Marigold Seabee Cash Costs
PAGE 7SSRM:NASDAQ/TSX
Increased cash balance ten consecutive quartersOps Driven FCF
Note: SSR Mining’s cash and cash equivalents as per financial statements as at each respective quarterly date.
Track Record of Free Cash Flow Generation4
$0
$100
$200
$300
$400
$500
Q1
2014
Q2
2014
Q3
2014
Q4
2014
Q1
2015
Q2
2015
Q3
2015
Q4
2015
Q1
2016
Q2
2016
Q3
2016
Q4
2016
Q1
2017
Q2
2017
Q3
2017
Q4
2017
Q1
2018
CashandCashEquivalents($M)
Acquired
Marigold
(all cash)
Acquired
Seabee
(all shares)
PAGE 8SSRM:NASDAQ/TSX
Leveraged to Gold with Attractive Trading Liquidity
Notes: “Beta to gold price” represents “raw beta” calculated on weekly returns versus a spot gold price index from January 1, 2015 to May 30, 2018. Daily volume based on combined trading volumes from primary and
secondary exchanges, as applicable, from January 1, 2015 to May 30, 2018. Source: Bloomberg, Capital IQ.
5
2.3%
2.1%
1.8%
1.3%
1.2% 1.2%
1.1%
1.0%
0.9%
0.7%
0.5% 0.5%
Coeur SSR Mining Hecla Eldorado NewGold Tahoe Fortuna McEwen B2Gold Detour Oceana Torex
Dailyvolume(%ofsharesout)
2.75 2.69 2.65
2.53 2.50
2.29
2.14 2.09 2.04
1.93 1.90 1.86
SSR Mining McEwen Coeur Fortuna B2Gold Detour Torex New Gold Hecla Eldorado Tahoe Oceana
BetatoGoldPrice
Operational Excellence and disciplined M+A are key differentiators
Track Record of Creating Net Asset Value Per Share
PAGE 9
Creating Value
Notes: Peer index represents an equal weighted index, indexed to SSR Mining NAV per share beginning December 31, 2014 and ending May 30, 2018; peer index includes Coeur, Hecla, Tahoe Resources, OceanaGold, Torex
Gold, New Gold, B2 Gold, Detour Gold, Eldorado Gold and Fortuna. McEwen Mining data not applicable for inclusion in peer index. Source: Capital IQ.
6
+71%
-5%
$4
$5
$6
$7
$8
$9
$10
$11
$12
$13
Dec-14 Jun-15 Dec-15 Jun-16 Dec-16 Jun-17 Dec-17
NetAssetValue($/sh)
SSR Mining Peer Index
Depth of experience and a top governance rating
SSR Mining Executive Team and Board of Directors
PAGE 10SSRM:NASDAQ/TSX
Michael Anglin
Chairman
Paul Benson
Director, President and CEO
Gustavo Herrero
Director
Brian Booth
Director
Beverlee Park
Director
Richard Paterson
Director
Steven Reid
Director
Simon Fish
Director
Elizabeth Wademan
Director
Nadine J. Block
VP, Human Resources
Paul Benson
President and CEO
W. John DeCooman, Jr.
VP, Business Development
and Strategy
Gregory J. Martin
SVP and CFO
Kevin O’Kane
COO
First decile corporate governance rating leads peer groupISS Score: 1
2018 Production and Cash Costs Guidance
SSRM:NASDAQ/TSX PAGE 11
Marigold Seabee Puna
(75% interest)
SSR Mining
Gold Gold Silver Gold Equivalent
Production 190K – 210K oz 85K – 92K oz 2.3M – 3.3M oz 305K – 345K oz
Cash Costs
(US$/oz)
$725/oz – $775/oz $560/oz – $610/oz $12.50/oz – $15.00/oz $705/oz – $760/oz
Notes: Puna Operations and SSR Mining figures are presented on an attributable basis. Puna Operations 2018 production guidance for lead and zinc is 5.3 to 9.4 million pounds and 4.1 to 5.6 million pounds, respectively, on a
75% basis. Gold equivalent production and cash costs are based on a 73:1 gold to silver ratio. Cash costs is a non-GAAP financial measure. Please see "Cautionary Note Regarding Non-GAAP Measures” in this presentation.
325,000 oz AuEq at $735/oz cash costs in 2018Mid-point Guidance
MARIGOLD MINE
GROWTH IN NEVADA
Maverick
Springs
Goldstrike
Marigold
SSR Mining project
Other mines in area
Twin Creeks
Cortez
Phoenix
MARIGOLD
Carlin Trend
Battle Mountain-
Eureka Trend
 Open pit, run-of-mine heap leach gold operation
 Produced 202,240 ounces of gold in 2017 at cash
costs of $647 per ounce
 2018 mid-point guidance of 200,000 ounces gold
 Q1 2018 gold production of 42,960 ounces at
$720 per ounce cash costs
 ~200,000 tonnes of material moved per day
 Strong safety and environmental practices
 Excellent infrastructure
 10-year Mineral Reserves life with potential to extend
(subject to the current EIS process)
 Significant exploration upside
Marigold: Large Scale, Low-Cost Producer
Notes: Cash costs is a non-GAAP financial measure. Please see "Cautionary Note Regarding Non-GAAP Measures” in this presentation.
SSRM:NASDAQ/TSX PAGE 13
+250K
oz Au
SSRM:NASDAQ/TSX PAGE 14
Transformation: Increased Production and Lower Costs
Targeting +250K oz gold production by 2022
Pre-Acquisition
Mine Plan
+150,000 oz Au
Revised LOMP
2015/2016
+200,000 oz Au
Upside from Equipment Replacement Study in 2019Compelling Base Case
0
50
100
150
200
250
2012A 2013A 2014A 2015A 2016A 2017A 2018E 2019E 2020E 2021E 2022E
GoldProduction(Koz)
Expanded
Reserves and Fleet
+225,000 oz Au
Notes: 2018 production reflects 2018 guidance as reported in our news release dated January 15, 2018. Production for each of the 2019-2021 periods is based on the Marigold Five-Year Outlook as reported in our news
release dated September 15, 2016. Expected production in 2022 is as referenced in our press release dated February 22, 2018.
PAGE 15SSRM:NASDAQ/TSX
Marigold Mineral Reserves and Resources Increased Y-o-Y
Mineral Reserves gold grade increased to 0.46 g/t
Notes: Mineral Reserves are based on $1,250/oz gold price assumption. Mineral Reserves include 0.19 million ounces of leach pad inventory. Probable Mineral Reserves have a grade of 0.46 g/t. Mineral Reserves figures have
some rounding applied, and thus totals may not sum exactly. Measured and Indicated Mineral Resources are inclusive of Mineral Reserves. Mineral Resources include 0.19 million ounces of leach pad inventory. Mineral
Resources are based on $1,400/oz gold price assumption. Measured and Indicated Mineral Resources have a grade of 0.46 g/t. Inferred Mineral Resources have a grade of 0.41 g/t. Mineral Resources figures have some rounding
applied, and thus totals may not sum exactly. Please refer to “Cautionary Notes” and “Reserves and Resources: Notes to Table” in this presentation.
2.84 (0.22) 0.21
0.36 3.19
5.66
0.63
0
1
2
3
4
5
6
7
2016
Reserves
Depletion Model
Assumptions
Exploration 2017
Reserves
2017 M+I
Resources
2017
Inferred
Resources
GoldMineralReservesandMineralResources
(millionounces)
Marigold: Exploration Success and Resource Conversion
SSRM:NASDAQ/TSX PAGE 16
8N
Red
Dot
8S
8SX
MUD
Waste
TZN
Leach
Pad
HideOutRed
Dot
North
Basalt-Antler
Valmy
N
Current mining area
Mackay reserve
pit outline
Marigold: Exploration Success and Resource Conversion
SSRM:NASDAQ/TSX PAGE 17
A
A’
8D
8S
8SX
TZN
HideOutRed
Dot
North
Gold Grade (g/t)
75 meters
0.06 – 0.6
0.6 – 1.0
> 1.0
< 0.06
EOY 2017
Resource Pit
Shell
EOY 2017
Mackay
Reserve Pit
February 2018
Pit Surface
Original
Surface
EOY 2017
Gold Grade
Model
Leach
Pad
MRA6461
35.1 m at 0.86 g/t
MRA6434
106.7 m at 1.09 g/t
Incl. 18.3 m at 4.10 g/t
MRA6503
33.5 m at 2.50 g/t
Incl. 25.9 m at 3.18 g/t
MRA6502
59.4 m at 0.47 g/t
N
Notes: Measured and Indicated Mineral Resources are inclusive of Mineral Reserves. Please refer to our news releases dated February 23, 2017, May 1, 2017 and September 5, 2017 for further details. See also “Cautionary
Notes” and “Reserves & Resources: Notes to Tables” in this presentation.
Marigold: Equipment Replacement Study
In 2019, evaluate mine fleet investment plan
PAGE 18SSRM:NASDAQ/TSX
Notes: Equipment replacement study trade-off parameters are targets only and do not reflect actual results or demonstrate actual economic viability. There is no certainty that such parameters will be reflected in the Marigold
mine equipment replacement study or that the results of such study will be realized by us. Please see “Cautionary Notes” in this presentation.
Scenario A Scenario B
Material Movement Mtpa 80 +110
Life of Mine years ~10 +15
Gold Production oz/yr ~220,000 +300,000
Mining Cost $/tonne ~$1.50 <$1.30
Mine Fleet Investment Plan --
Replace with like-for-like
equipment
Add rope shovel, trucks and
support gear
Investment Capex $M LOMP LOMP + ~$100
 Scenario A: Replace existing mine fleet with like-for-like equipment consistent
with current life of mine plan
 Scenario B: Expand mine fleet with additional rope shovel, haul trucks and
related support gear potentially lowering mining costs to ‘enable’ Red Dot deposit
 The following table outlines the targeted equipment replacement study trade-off
parameters to be evaluated in 2019
PAGE 19SSRM:NASDAQ/TSX
 Continue to deliver robust operating
margins
 Additional hauling capacity and
equipment replacement study
 Mine-life extension through
exploration at Valmy, East Basalt and
Red Dot
 2018 exploration budget of $9M,
80% increase from 2017
 Deep sulphide exploration
Marigold: Opportunities
SEABEE GOLD OPERATION
HIGH-GRADE GOLD MINE
Seabee: Overview
High-margin underground operation in a stable jurisdiction
 High-grade, underground mine in Saskatchewan, Canada
 Strong safety and environmental practices
 Large underexplored land position of +57,000 ha
 Produced a record 83,998 ounces of gold in 2017 at cash costs
of $602 per ounce
 Q1 2018 gold production of 23,717 ounces at $481 per ounce
cash costs
 Record throughput of 1,036 tpd in Q1 2018
Seabee
Gold
Operation
Saskatoon
Flin Flon
Note: Cash costs is a non-GAAP financial measure. Please see "Cautionary Note Regarding Non-GAAP Measures” in this presentation.
SSRM:NASDAQ/TSX PAGE 21
PAGE 22SSRM:NASDAQ/TSX
Seabee Mineral Reserves and Resources Increased Y-o-Y
Mineral Reserves gold grade increased to 9.9 g/t
Notes: Mineral Reserves are based on $1,250/oz gold price assumption. Proven and Probable Mineral Reserves have a grade of 9.88 g/t. Measured and Indicated Mineral Resources are inclusive of Mineral Reserves. Mineral
Resources are based on $1,400/oz gold price assumption. Measured and Indicated Mineral Resources have a grade of 10.74 g/t. Inferred Mineral Resources have a grade of 9.29 g/t. Mineral Reserves and Mineral Resources
figures have some rounding applied, and thus totals may not sum exactly. Please refer to “Cautionary Notes” and “Reserves and Resources: Notes to Table” in this presentation.
361 92
166 437
681
674
0
200
400
600
800
1,000
1,200
1,400
2016
Reserves
Depletion Exploration 2017
Reserves
2017 M+I
Resources
2017
Inferred
Resources
GoldMineralReservesandResources
(thousandounces)
50
45
63
75
77
84
89
100
120
108
$998
$954
$757
$525
$663
$602 $585
$540
$442
$504
$0
$200
$400
$600
$800
$1,000
$1,200
0
20
40
60
80
100
120
140
2012A 2013A 2014A 2015A 2016A 2017A 2018E 2019E 2020E 2021E
CashCosts($/ozgold)
GoldProduction(koz)
Increasing Production at Lower Costs
SSRM:NASDAQ/TSX PAGE 23
Acquired
the Seabee Gold Operation
May 31, 2016
Notes: Production and cash costs for 2017 reflect actual production and cash costs as reported in our news release dated February 22, 2018. Production and cash costs for each of the 2018-2021 periods is based on the Seabee
Gold Operation PEA as reported in our news release dated September 7, 2017. The Seabee Gold Operation PEA is preliminary in nature and includes Inferred Mineral Resources that are considered too speculative geologically to
have the economic considerations applied to them that would enable them to be categorized as Mineral Reserves, and there is no certainty that the Seabee Gold Operation PEA will be realized. Cash costs is a non-GAAP financial
measure. Please see "Cautionary Note Regarding Non-GAAP Measures” in this presentation.
SSRM:NASDAQ/TSX PAGE 24
450
650
850
1,050
1,250
Jan-16 Mar-16 May-16 Jul-16 Sep-16 Nov-16 Jan-17 Mar-17 May-17 Jul-17 Sep-17 Nov-17 Jan-18 Mar-18
MillDryTonnesperDay
Decreased
stope
production
Forest
fires
Mill
test trial
Mill
test trial
Operational Excellence Driving Seabee Mill Improvements
Step-change tonnage improvements since acquisition
Year End 2017 Santoy Mineral Resources
SSRM:NASDAQ/TSX PAGE 25
Notes: Measured and Indicated Mineral Resources are inclusive of Mineral Reserves. Please refer to our news releases dated February 23, 2017, May 1, 2017 and September 5, 2017, and exploration results reported by Claude
Resources in its news release dated May 22, 2013 for further details. See also “Cautionary Notes” and “Reserves & Resources: Notes to Tables” in this presentation.
100 meters
Q3 2017 drillholes
H1 2017 drillholes
Previously Reported Drillholes
Measured & Indicated Mineral
Resources
Inferred Mineral Resources
Mined Areas
Santoy Gap (9A, 9B, 9C) Santoy 8A
Gap HW
2.5m at 27.7g/t
(SUG-17-019)
7.0m at 7.17g/t
(SUG-17-917)
2.8m at 26.6g/t
(SUG-17-300)
6.3m at 7.43g/t
(SUG-17-918)
2.1m at 10.8g/t
(SUG-17-919)5.5m at 12.4g/t
(SUG-17-041)
5.8m at 6.4g/t
(SUG-17-042)
2.8m at 17.6g/t
(SUG-17-021)
1.4m at 11.7g/t
(SUG-17-023)
2.8m at 6.5g/t
(SUG-17-038)
2.1m at 6.5g/t
(SUG-17-914)9.5m at 9.1g/t
(JOY-16-751)
9.9m at 8.2g/t
(JOY-16-749)
2.1m at 52.8g/t
(JOY-16-701)
0m Elev
-400m Elev
-800m Elev
1.9m at 200.9g/t
(JOY-13-690)
OPENOPEN OPEN
1.3m at 14.4g/t
(SUG-17-047)
2.4m at 14.8g/t
(SUG-17-050)
2.1m at 24.0g/t
(SUG-17-923)
Large, Contiguous Land Package
SSRM:NASDAQ/TSX PAGE 26
23,300 hectare land
package at Seabee
34,000 hectare land package
at Fisher Project (option
agreement)
10 km
Gold occurrence
Santoy Mine
Seabee Mine/mill
airstrip & camp
All weather road
Fisher exploration
camp
Santoy shear zone
Carr target
CRJ target
Santoy 3 target
Seabee: Opportunities
 Deliver on PEA expansion case to 1,050 tpd
 Drive Operational Excellence initiatives
 Evaluate 1,200 tpd sustained mill throughput
 80% increase in exploration to $9M in 2018
 Santoy Gap Hanging Wall
 Carr, CRJ and Santoy 3 targets
 Fisher extension
 Convert Inferred Resources to Measured
and Indicated
SSRM:NASDAQ/TSX
Seabee
Gold
Operation
Saskatoon
Flin Flon
PAGE 27
Note: The Seabee PEA is preliminary in nature and includes Inferred Mineral Resources that are considered too
speculative geologically to have the economic considerations applied to them that would enable them to be categorized as
Mineral Reserves, and there is no certainty that the SGO PEA will be realized. Please refer to our news release dated
September 7, 2017 for further details.
PUNA OPERATIONS
LARGE-SCALE SILVER PRODUCER
Puna Operations Joint Venture
Brownfields development for Pirquitas operating life extension
 SSR Mining is the JV operator with a 75% interest
 JV includes Chinchillas, a silver-lead-zinc deposit, and
the Pirquitas plant and facilities located 45 km away
 Chinchillas construction initiated Q1 2018, first ore
production expected H2 2018
 Pirquitas plant capacity 5,000 tpd, with an operating life
through +2025
 Produced 6.2M oz silver in 2017, exceeding improved
guidance, at cash costs of $13.07/oz silver
 Q1 2018 production of 0.9M oz silver; stockpile processing
expected through H1 2018
 Pirquitas underground study to be completed in 2018
Notes: 2017 production presented on a 100% basis. For further information refer to our news releases on the Chinchillas project dated March 31, 2017, May 31, 2017, and November 7, 2017. Cash costs is a non-GAAP financial
measure. Please also refer to “Cautionary Notes” in this presentation.
SSRM:NASDAQ/TSX PAGE 29
Seabee
Gold
Operation
Saskatoon
Flin Flon
Pirquitas Operation
Jujuy, Argentina
Chinchillas Project
Jujuy, Argentina
SSRM:NASDAQ/TSX PAGE 30
Notes: Base metals exposure of 28% based on value of metal produced from the Puna Operations PFS. Production and cash costs for 2018 reflect the mid-point of 2018 guidance as reported in our news release dated
January 15, 2018, and are presented on an attributable co-product basis. Production and cash costs for each of the 2019-2021 periods is based on the Puna Operations PFS as reported in our news release dated May 31,
2017. Production is reported on a 75% basis. Silver-equivalent production calculated using Mineral Reserve prices for 2018-2021. Cash costs is a non-GAAP financial measure. Please see "Cautionary Note Regarding Non-
GAAP Measures” in this presentation.
 Production:
 Silver: 2.3M to 3.3M ounces
 Lead: 5.3M to 9.4M lbs
 Zinc: 4.1M to 5.6M lbs
 Cash costs:
 $12.50/oz to $15.00/oz silver
2018 Guidance Medium Term Outlook
Puna Operations: Near Term Growth by 2019
Significant LOM base metals exposure from lead and zinc
3.4
6.8
6.9 6.9
$0
$2
$4
$6
$8
$10
$12
$14
$16
0
2
4
6
8
2018E 2019E 2020E 2021E
CashCost($/ozSilver-Equivalent)
Silver-EquivalentProduction(Moz)
Silver Lead Zinc Cash Costs
SSRM:NASDAQ/TSX
Chinchillas Project Development On Track
PAGE 31
 EIA approval received 2017
 First blast initiated March 2018
 Workforce hired, construction and
pre-stripping activities underway
 First ore to the Pirquitas mill
anticipated in H2 2018
Chinchillas site infrastructure - earthworks Stockpile dome construction – structural erection
Tailings pumping infrastructure
Maximizing value of portfolio with property sales
Portfolio Rationalization
PAGE 32SSRM:NASDAQ/TSX
5
9
1
4. Puna Operations
(Pirquitas UG)
5. San Luis
Berenguela
6. Pitarrilla
1. MarigoldSan Marcial
8. Maverick Springs
9. Sunrise Lake
6
7
2
7. Amisk 2. Seabee
8
Candelaria
Parral
Projects owned by
SSR Mining
Properties sold or
optioned from 2010
to present
Diablillos
Challacollo
Bowdens
San Agustin
Brucejack
Snowfield
(Pretium)
Silvertip
3. Puna Operations
(Chinchillas)
3
Operating mines
owned by SSR Mining
4
SSRM:NASDAQ/TSX
SSR Mining Inc.
Delivering value and growth for our shareholders
PAGE 33
 Ramp up at Seabee to 1,050 tpd in 2019
 Marigold equipment replacement study in 2019
 First ore production at Chinchillas H2 2018
 Q1 2018 produced 78,483 gold equivalent ounces at
$766/oz cash costs
 Production growth to +410,000 oz AuEq by 2021
 Strong liquidity position with $473M of cash
 Q1 2018 operating cash flow of $11M
 Track record of disciplined capital allocation
 80% increase in exploration spend at Marigold and
Seabee in 2018; drilling underway
 SIB and Perdito projects
 Pirquitas underground study in 2018
Notes: Cash and cash equivalents as of December 31, 2017. Please also refer to “Cautionary Notes” in this presentation.
Production and
Free Cash Flow
Growth
Near-term
Investment
Catalysts
Strong
Financial
Position
Exploration
Upside
PAGE 34SSRM:NASDAQ/TSX
Value
&
Growth
PAGE 10
SSRM Q1 2018 Summary
Solid performance and positioned for near-term growth
 Produced 78,483 gold equivalent ounces,
generating $11M of operating cash flow
 Cash position increased to $473M
 Seabee outperformed on throughput, costs
and production
 Chinchillas remains on track for ore
delivery in H2 2018
 Marigold and Seabee exploration are
ramping up
PAGE 36SSRM:NASDAQ/TSX
Selected Financial Results for 2016 and 2017
Notes: Silver sales and gold equivalent sales are on a 100% basis. Gold equivalent sales are based on total gold and silver sales and the realized silver and gold prices for each corresponding
period. Realized metal prices, adjusted attributable net income and adjusted basic attributable earnings per share are non-GAAP financial measures. Please see "Cautionary Note Regarding Non-
GAAP Measures” in this presentation.
Units 2017 2016
Gold Sales oz 286,279 254,761
Total Silver Sales Moz 6.0 11.4
Total Gold Equivalent Sales oz 367,950 408,860
Gold Equivalent Production oz 370,486 393,325
Revenue $M $448.8 $491.0
Income from Mine Operations $M $113.3 $154.0
Net Income $M $71.5 $65.0
Basic Attributable Earnings per share $ $0.58 $0.63
Adjusted Attributable Net Income $M $40.1 $100.3
Adjusted Basic Attributable Earnings per share $ $0.34 $0.97
Cash Generated by Operating Activities $M $144.7 $170.7
Cash and Cash Equivalents $M $459.9 $327.1
 Once ore is loaded on the heap leach pad …
 Average time to achieve primary recovery of +50% is 90 to 120 days
 Average time to achieve overall recovery of 73% is seven to nine months
 Most important factor to leach recovery time is loaded ore to ‘plastic’ distance
 Every 100 feet of pad height extends leach recovery time by ~120 days
PAGE 37SSRM:NASDAQ/TSX
Marigold Mine: Heap Leach Process
0%
10%
20%
30%
40%
50%
60%
70%
80%
90%
100%
1 2 3 4 5 6 7 8 9 10 11 12 13 14 15 16 17 18
ExtractionRate
Months After Ore is Placed on Leach Pad
Extraction Rate of Recoverable Ounces
0-50 ft
50 -100 ft
100-200 ft
200-300 ft
300-400 ft
Seabee: Value Creation Opportunity
SSRM:NASDAQ/TSX PAGE 38
Seabee
(SSR Mining)
Island Gold
(Alamos Gold)
Lamaque
(Eldorado Gold)
Nevada Operations
(Klondex Mines)⁴
Average Mill Throughput (tpd) 1,050 1,100 1,675 899
Average Milled Grade (g/t) 8.3 9.7 7.0 17.2
Mine Life (years) 7 8 10 n.a.
Gold Recovery (%) 96.5% 96.5% 93.6% 90.1%
Avg. Annual Gold Production (koz) 100 125 123 183
Cash Costs ($/ounce) 548 483 458 670
AISC ($/ounce) 682 620 634 953
Capital Investment ($M) 90 174 387 n.a.
NPV5% ($M)¹ 292 335 290 n.a.
Analyst Consensus NAV ($M)² 312 553 445 355
Net Asset Value / NPV5% (x) 1.1x 1.6x 1.5x n.a.
Transaction Value ($M)³ n.a. 746 472 n.a.
Transaction Value / NPV5% (x) n.a. 2.2x 1.6x n.a.
(1) NPV5% for the Seabee Gold Operation PEA is based on our news release dated September 7, 2017 calculated at $1,300 per ounce gold price; Island Gold PEA is based on Richmont Mines news release dated May 29, 2017
calculated at $1,260 per ounce gold price; and Lamaque PEA is based on Integra Gold news release dated April 13, 2017 calculated at $1,250 per ounce gold price.
(2) Analyst Consensus NAV reflects asset level NAV calculated for each operation as of February 16, 2018.
(3) Transaction Value is the amount paid for Richmont Mines Inc. (sole asset is the Island Gold operation) and Integra Gold Corp. (sole asset is the Lamaque project) by Alamos Gold Inc. and Eldorado Gold Corp., respectively.
(4) Mill Throughput, Milled Grade and Gold Recovery for Klondex Mines reflects 2017 actual reported data. Avg. Annual Production, Cash Costs and AISC for Klondex Mines reflect mid-point of 2018 guidance.
Notes: The Seabee Gold Operation PEA is preliminary in nature and includes Inferred Mineral Resources that are considered too speculative geologically to have the economic considerations applied to them that would enable
them to be categorized as Mineral Reserves, and there is no certainty that the Seabee Gold Operation PEA will be realized. Cash costs and AISC are non-GAAP financial measures. Please see "Cautionary Note Regarding Non-
GAAP Measures” in this presentation.
Seabee: Preliminary Economic Assessment
Expanded margins from higher throughput and grade
 Increases mining rate by 21% to 1,050 tpd by 2019, compared to 2016
 Mines 62% of Inferred Mineral Resources
 Increases estimated LOM average gold production by 29% to 100,000
ounces per year (for the period 2018 to 2023, compared to 2016)
 Utilizes current infrastructure to allow for lower project capital of $90M over
seven years
 LOM estimated cash costs of $548 per payable ounce gold sold
 Pre-tax NPV(5%) of $364M ($1,300 gold price)
 After-tax NPV(5%) of $292M ($1,300 gold price)
SSRM:NASDAQ/TSX PAGE 39
Notes: The Seabee Gold Operation PEA is preliminary in nature and includes Inferred Mineral Resources that are considered too speculative geologically to have the economic considerations applied to them that would enable them
to be categorized as Mineral Reserves, and there is no certainty that the Seabee Gold Operation PEA will be realized. Please refer to our news release dated September 7, 2017 for further details. Cash costs is a non-GAAP
financial measure. Please see "Cautionary Note Regarding Non-GAAP Measures” in this presentation.
SSRM:NASDAQ/TSX
Seabee: PEA Financial Summary and Sensitivity Analysis
PAGE 40
Notes: The Seabee Gold Operation PEA is preliminary in nature and includes Inferred Mineral Resources that are considered too speculative geologically to have the economic considerations applied to them that would enable
them to be categorized as Mineral Reserves, and there is no certainty that the Seabee Gold Operation PEA will be realized. Please refer to our news release dated September 7, 2017 for further details. The Canadian exchange
rate is assumed to be 1.275:1 in 2017-2018 and 1.25:1 thereafter. Cash costs is a non-GAAP financial measure. Please see "Cautionary Note Regarding Non-GAAP Measures” in this presentation.
Cash Flows ($M)
Net Revenue $893.5
Operating Costs $(346.0)
Royalties and Other $(28.5)
Δ in Working Capital $10.3
Operating Cash Flow $529.3
Capital Costs $(89.5)
Reclamation $(7.2)
Pre-Tax Cash Flow $432.7
Tax $(86.0)
Post-tax Cash Flow $346.7
NPV5% (pre-tax) $363.5
NPV5% (post-tax) $292.0
Gold price $1,300 per ounce
Exchange rate (2019 onwards) C$1.25:US$1.00
Pre-tax NPV (5%) Sensitivities ($M)
Gold Price ($/oz)
$1,200 $1,300 $1,400
Canadian
Exchange
Rate
1.20:1 $289 $346 $403
1.25:1 $307 $364 $420
1.30:1 $319 $376 $433
Pre-tax NPV (5%) Sensitivities ($M)
Site Costs (% change)
-10% 0% 10%
Infrastructure
Capital
(% change)
10% $392 $359 $326
0% $396 $364 $331
-10% $401 $368 $335
N
Mineral Reserves and Resources
Tonnes Ag Pb Zn Ag Pb Zn
Mt g/t % % Moz Mlb Mlb
P&P 11.7 154 1.20 0.49 58 310 127
M&I 29.3 101 0.90 0.60 96 581 386
Inf 20.9 50 0.54 0.81 34 250 374
Mine life: 8 years
Total material mined: 66.6 M tonnes
Strip ratio: 4.7
Processing rate: 4,000 tpd
Average annual
production (8 years
active mining):
6.1 Moz Silver
35.0 Mlb Lead
12.3 Mlb Zinc
8.4 Moz Silver Eq
Total production:
51.0 Moz Silver
71.0 Moz Silver Eq
Operating costs:
$2.88 / t mined, mining costs
$15.34 / t milled, mining costs
$14.72 / t milled, processing cost
$7.00 / t milled, G&A costs
$8.29 / t milled, ore transport & other
Cash costs: $7.40 / oz Silver (net of by-products)
AISC: $9.75 / oz Silver (net of by-products)
Development capital: $81 M
Sustaining capital: $44 M
NPV: $178 M (post-tax, 5%)
IRR: 29% (post-tax)
Chinchillas Project: Data Sheet (100% Basis)
Near-term Production with Positive Pre-Feasibility Results
SSRM:NASDAQ/TSX PAGE 41
Notes: All data is as reported in the technical report entitled “NI 43-101 Technical Report Pre-feasibility Study of the Chinchillas Silver-Lead-Zinc Project Jujuy Province, Argentina” filed on May 31, 2017 and available under our
profile on the SEDAR website at www.sedar.com. Cash costs are net of estimated capitalized stripping over the life of mine. Metal price assumptions include $19.50/oz silver, $0.95/lb lead and $1.00/lb zinc. Silver equivalent
values are based on these metal price assumptions. Measured and Indicated Mineral Resources are inclusive of Mineral Reserves. Cash costs and AISC are non-GAAP measures. Please refer to “Cautionary Notes” in this
presentation and the slide entitled “Chinchillas Mineral Reserves and Resources”.
Pirquitas Underground Opportunity
Focused on Mine Life Extension
PAGE 42SSRM:NASDAQ/TSX
Notes: See news release dated September 21, 2015 for drillhole highlights and reference data for the Pirquitas
exploration drill program. See also “Cautionary Notes”.
 Potential small-scale, high-grade ore
feed from the Chocaya, Oploca and
Cortaderas veins
 Positive drill results from 2015 drill
program:
 3.16 meters at 1,436 g/t silver
 1.93 meters at 1,890 g/t silver
 0.83 meters at 2,670 g/t silver
 Re-evaluate Pirquitas UG Mineral
Resources as a high-grade supply to
supplement Chinchillas
 Study to be completed in 2018
Pirquitas
open pit
(mined out Jan 2017)
San Luis Project:
PAGE 43SSRM:NASDAQ/TSX
San Luis Project
Feasibility Study Results (June 2010)
Note: See “Cautionary Notes” and “Reserves & Resources: Notes to Tables” in this presentation. Also see
“Technical Report for the San Luis Project Feasibility Study, Ancash Department, Peru” dated June 4, 2010
and available under our profile on the SEDAR website at www.sedar.com.
Mine life: 3.5 years
Average annual
production:
1.9M oz Ag
78,000 oz Au
Cash costs: $313 / oz Au
Resources (M+I):
9.0M oz Ag at 578.1 g/t
0.35M oz Au at 22.4 g/t
Capital: $90 -$100M
Mill throughput: 400 tonnes per day
NPV: $39M (base case)
IRR: 26.5% (base case)
Deposit type:
Volcanic hosted, low sulphidation,
epithermal quartz vein deposit
Opportunities:
Identify additional veins and following
on existing exploration targets
Mine life: 32 years
Average annual
production:
15M oz Ag (1st 18 years)
Cash costs: $10.01 / oz Ag
Resources (M+I):
496.5M oz Ag at 96.7 g/t (open pit)
28.8M oz Ag at 173.5 g/t (U/G)
Capital: $741M
Strip ratio: 6:1
Mill throughput: 16,000 tonnes per day
NPV (after tax): $737M ($25/oz Ag price)
IRR (after tax): 12.8% (base case)
Deposit type:
Silver-lead-zinc deposit
open pit / UG project
Opportunities: U/G start-up operation potential
Note: See “Cautionary Notes” and “Reserves & Resources: Notes to Tables” in this presentation. Also see “NI
43-101 Technical Report on the Pitarrilla Project Durango State, Mexico” dated December 14, 2012 and
available under our profile on the SEDAR website at www.sedar.com.
Pitarrilla Project: Large undeveloped silver resource
A unique high-grade gold reserve with exploration upside
Pitarrilla Project
Feasibility Study Results (December 2012)
Mineral Reserves
(as of December 31, 2017)
Location Tonnes Silver Gold Lead Zinc SSRM
SSRM
Interest
SSRM
Interest
millions g/t g/t % %
%
Interest
Silver
million oz
Gold
million oz
Proven Mineral Reserves
Seabee Canada 0.26 7.58 100 0.06
Chinchillas Argentina 1.64 180 0.75 0.42 75 7.1
Total 7.1 0.06
Probable Mineral Reserves
Marigold U.S. 205.10 0.46 100 3.00
Marigold Leach Pad Inventory U.S. 100 0.19
Seabee Canada 1.12 10.41 100 0.37
Chinchillas Argentina 10.07 150 1.27 0.50 75 36.3
Pirquitas Stockpiles Argentina 1.05 90 0.69 75 2.3
San Luis Peru 0.51 447 18.06 100 7.2 0.29
Total 45.8 3.85
Total Proven and Probable Mineral
Reserves
Marigold U.S. 205.10 0.46 100 3.00
Marigold Leach Pad Inventory U.S. 100 0.19
Seabee Canada 1.37 9.88 100 0.44
Chinchillas Argentina 11.71 154 1.20 0.49 75 43.4
Pirquitas Stockpiles Argentina 1.05 90 0.69 75 2.3
San Luis Peru 0.51 447 18.06 100 7.2 0.29
Total Proven and Probable 52.9 3.92
SSRM:NASDAQ/TSX PAGE 44
Mineral Resources: Measured and Indicated
(as of December 31, 2017)
Location Tonnes Silver Gold Lead Zinc SSRM
SSRM
Interest
SSRM
Interest
millions g/t g/t % %
%
Interest
Silver
million oz
Gold
million oz
Measured Mineral Resources (Inclusive of Proven Mineral Reserves)
Seabee Canada 0.57 9.29 100 0.17
Chinchillas Argentina 3.09 128 0.60 0.41 75 9.5
Pitarrilla Mexico 12.35 90 0.70 1.22 100 35.7
Total 45.3 0.17
Indicated Mineral Resources (Inclusive of Probable Mineral Reserves)
Marigold U.S. 370.20 0.46 100 5.47
Marigold Leach Pad Inventory U.S. 100 0.19
Seabee Canada 1.40 11.33 100 0.51
Chinchillas Argentina 26.20 98 0.94 0.62 75 62.1
Pirquitas UG Argentina 2.63 292 4.46 75 18.6
Pirquitas Stockpiles Argentina 1.05 90 0.69 75 2.3
Pitarrilla Mexico 147.02 97 0.32 0.87 100 460.7
Pitarrilla UG Mexico 5.43 165 0.68 1.34 100 28.8
San Luis Peru 0.48 578 22.40 100 9.0 0.35
Amisk Canada 30.15 6 0.85 100 6.0 0.83
Total 587.5 7.34
Measured and Indicated Mineral Resources (Inclusive of Mineral Reserves)
Marigold U.S. 370.20 0.46 100 5.47
Marigold Leach Pad Inventory U.S. 100 0.19
Seabee Canada 1.97 10.74 100 0.68
Chinchillas Argentina 29.29 101 0.90 0.60 75 71.6
Pirquitas UG Argentina 2.63 292 4.46 75 18.6
Pirquitas Stockpiles Argentina 1.05 90 0.69 75 2.3
Pitarrilla Mexico 159.36 97 0.35 0.89 100 496.5
Pitarrilla UG Mexico 5.43 165 0.68 1.34 100 28.8
San Luis Peru 0.48 578 22.40 100 9.0 0.35
Amisk Canada 30.15 6 0.85 100 6.0 0.83
Total Measured and Indicated 632.7 7.52
SSRM:NASDAQ/TSX PAGE 45
Mineral Resources: Inferred
(as of December 31, 2017)
Location Tonnes Silver Gold Lead Zinc SSRM
%
SSRM
Interest
Silver
SSRM
Interest
Gold
millions g/t g/t % % Interest million oz million oz
Inferred Mineral Resources
Marigold U.S. 49.70 0.41 100 0.63
Seabee Canada 2.26 9.29 100 0.67
Chinchillas Argentina 20.92 50 0.54 0.81 75 25.4
Pirquitas UG Argentina 1.08 207 7.45 75 5.4
Pitarrilla Mexico 8.52 77 0.18 0.58 100 21.2
Pitarrilla UG Mexico 1.23 138 0.89 1.25 100 5.5
San Luis Peru 0.02 270 5.60 100 0.2 0.00
Amisk Canada 28.65 4 0.64 100 3.7 0.59
Total Inferred 61.4 1.90
SSRM:NASDAQ/TSX PAGE 46
Reserves and Resources
Notes to Tables
All estimates set forth in the Mineral Reserves and Mineral Resources table have been prepared in accordance with National Instrument 43-101 - Standards of Disclosure for Mineral Projects (“NI 43-101”). The estimates of
Mineral Reserves and Mineral Resources for each property other than the Marigold mine, the Seabee Gold Operation and the Amisk project have been reviewed and approved by Bruce Butcher, P.Eng., our Director, Mine
Planning, and F. Carl Edmunds, P.Geo., our Chief Geologist, each of whom is a Qualified Person.
Mineral Resources are reported inclusive of Mineral Reserves. Mineral Resources that are not Mineral Reserves do not have demonstrated economic viability. Due to the uncertainty that may be attached to Inferred
Mineral Resources, it cannot be assumed that all or any part of an Inferred Mineral Resource will be upgraded to an Indicated or Measured Mineral Resource as a result of continued exploration. Mineral Resources and
Mineral Reserves estimates of silver ounces for Puna Operations are reported on a 75% attributable basis. Mineral Resources and Mineral Reserves figures have some rounding applied, and thus totals may not sum
exactly. All ounces reported herein represent troy ounces, and “g/t” represents grams per tonne. All $ references are in U.S. dollars. All Mineral Reserves and Mineral Resources estimates are as of December 31, 2017.
Metal prices utilized for Mineral Reserves estimates are $1,250 per ounce of gold, $18.00 per ounce of silver, $0.90 per pound of lead and $1.00 per pound of zinc, except as noted below for the San Luis project. Metal
prices utilized for Mineral Resources estimates are $1,400 per ounce of gold, $20.00 per ounce of silver, $1.10 per pound of lead and $1.30 per pound of zinc, except as noted below for each of the Chinchillas project, the
San Luis project and the Amisk project. All technical reports for the properties are available under our profile on the SEDAR website at www.sedar.com or on our website at www.ssrmining.com.
Marigold: Except for updates to cost parameters and metal price assumptions noted above, all other key assumptions, parameters and methods used to estimate Mineral Reserves and Mineral Resources and the data
verification procedures followed are set out in the technical report entitled “NI 43-101 Technical Report on the Marigold Mine, Humboldt County, Nevada” dated November 19, 2014. For additional information about the
Marigold mine, readers are encouraged to review our most recently filed Annual Information Form. Mineral Reserves estimate was prepared under the supervision of Thomas Rice, SME Registered Member, a Qualified
Person and our Technical Services Manager at the Marigold mine, and is reported at a cut-off grade of 0.065 g/t payable gold. Mineral Resources estimate was prepared under the supervision of James N. Carver, SME
Registered Member, our Chief Geologist at the Marigold mine, and Karthik Rathnam, MAusIMM (CP), our Chief Engineer at the Marigold mine, each of whom is a Qualified Person. Mineral Resources estimate is reported
based on an optimized pit shell at a cut-off grade of 0.065 g/t payable gold, and includes an estimate of Mineral Resources for mineralized stockpiles. Mineral Resources for mineralized stockpiles were estimated using
Inverse Distance cubed.
Seabee Gold Operation: Except for updates to cost parameters, metal price assumptions noted above, mill recovery and dilution to include recent operating results, and resource modeling techniques based on
recommendations set forth in the technical report entitled “NI 43-101 Technical Report for the Seabee Gold Operation, Saskatchewan, Canada” dated October 20, 2017 (the “Seabee Gold Operation Technical Report”), all
other key assumptions, parameters and methods used to estimate Mineral Reserves and Mineral Resources and the data verification procedures followed are set out in the Seabee Gold Operation Technical Report. For
additional information about the Seabee Gold Operation, readers are encouraged to review the Seabee Gold Operation Technical Report. Mineral Reserves estimate was prepared under the supervision of Kevin
Fitzpatrick, P.Eng., a Qualified Person and our Engineering Supervisor at the Seabee Gold Operation. Mineral Reserves estimate for the Seabee mine is reported at a cut-off grade of 4.55 g/t gold, and for the Santoy mine
is reported at a cut-off grade of 3.68 g/t gold. Mineral Resources estimate was prepared under the supervision of Jeffrey Kulas, P.Geo., a Qualified Person and our Manager Geology, Mining Operations at the Seabee Gold
Operation. Mineral Resources estimate for the Seabee mine is reported at a cut-off grade of 4.06 g/t gold, and for the Santoy mine is reported at a cut-off grade of 3.29 g/t gold. Block modelling techniques were used for
Mineral Resources and Mineral Reserves evaluation for the Santoy mine and the majority of the Seabee mine. Polygonal techniques were used in areas of historical mining at the Seabee mine. The preliminary economic
assessment set forth in the Seabee Technical Report is preliminary in nature, and it includes Inferred Mineral Resources that are considered too speculative geologically to have the economic considerations applied to
them that would enable them to be categorized as Mineral Reserves, and there is no certainty that the preliminary economic assessment will be realized.
Puna Operations: Chinchillas Mineral Reserves estimate is reported at a cut-off grade of $32.56 per tonne net smelter return (“NSR”). For additional information on the key assumptions, parameters and methods used to
estimate Chinchillas Mineral Reserves and the data verification procedures followed, readers are encouraged to review the technical report entitled “NI 43-101 Technical Report Pre-feasibility Study of the Chinchillas Silver-
Lead-Zine Project Jujuy Province, Argentina” dated May 15, 2017 (the “Chinchillas Technical Report”). Chinchillas Mineral Resources estimate is reported at a base case cut-off grade, which reflects the transport to and
processing of ore at the Pirquitas property, of 60.00 grams per tonne silver equivalent based on projected operating costs and using metal price assumptions of $22.50 per ounce of silver, $1.00 per pound of lead and
$1.10 per pound of zinc. For additional information on the key assumptions, parameters and methods used to estimate Chinchillas Mineral Resources and the data verification procedures followed, readers are encouraged
to review the Chinchillas Technical Report. Pirquitas underground Mineral Resources (Pirquitas UG) estimate is reported below the completed open pit shell; Mineral Resources estimate for the Mining Area (which includes
San Miguel, Chocaya, Oploca and Potosí zones) is reported at a cut-off grade of $100.00 per tonne NSR for San Miguel, Oploca and Potosi, and $90.00 per tonne NSR for Cortaderas. Pirquitas Mineral Reserves and
Pirquitas Mineral Resources estimates in surface stockpiles are reported at a cut-off grade of $16.93 per tonne NSR, respectively, and were determined based on grade, rehandling costs and recovery estimates from
metallurgical testing.
San Luis: Mineral Reserves estimate is reported at a cut-off grade of 6.9 g/t gold equivalent, using metal price assumptions of $800 per ounce of gold and $12.50 per ounce of silver. Mineral Resources estimate is reported
at a cut-off grade of 6.0 g/t gold equivalent, using metal price assumptions of $600 per ounce of gold and $9.25 per ounce of silver.
Pitarrilla: Mineral Resources estimate for the open pit is reported at a cut-off grade of $16.38 per tonne NSR for direct leach material, and $16.40 per tonne NSR for flotation/leach material. Underground Mineral Resources
(Pitarrilla UG) estimate is reported below the constrained open pit resource shell above a cut-off grade of $80.00 per tonne NSR, using grade shells that have been trimmed to exclude distal and lone blocks that would not
support development costs.
Amisk: Mineral Resources estimate was prepared by Sebastien Bernier, P.Geo., Principal Consultant (Resource Geology), SRK Consulting (Canada) Inc., a Qualified Person. Mineral Resources estimate is reported at a
cut-off grade of 0.40 grams of gold equivalent per tonne using metal price assumptions of $1,100 per ounce of gold and $16.00 per ounce of silver inside conceptual pit shells optimized using metallurgical and process
recovery of 87%, overall ore mining and processing costs of $15.00 per tonne and overall pit slope of fifty-five degrees..
SSRM:NASDAQ/TSX PAGE 47
PAGE 48SSRM:NASDAQ/TSX
Notes
PAGE 49SSRM:NASDAQ/TSX
Notes
Strong governance rating
SSR Mining Inc.
PAGE 50SSRM:NASDAQ/TSX
Source: FactSet, ISS and BMO Capital Markets as of April 16, 2018.
Share capital structure, convertible note and top shareholders overview
SSR Mining Inc.
PAGE 51SSRM:NASDAQ/TSX
Source: Capital IQ, Bloomberg; as at May 30, 2018. Cash and cash equivalents, marketable securities, convertible notes, revolving credit facility and total shares outstanding as at March 31, 2018. Market capitalization as at
May 30, 2018.
$ Million
Cash and Cash Equivalents $473
Marketable Securities $44
Convertible Notes $265
Revolving Credit Facility $75
Market Capitalization $1,242
Total Shares Outstanding: 119.9 million
Top 10 Shareholders % of Shares Outstanding
Van Eck 13.3%
Renaissance Technologies 4.9%
Sun Valley Gold 3.1%
Investec Asset Management 2.6%
Norges Bank 2.2%
The Vanguard Group 2.0%
Global X Management 2.0%
BMO Asset Management 1.5%
Credit Suisse Asset Management 1.2%
Fidelity Management and Research 1.1%
Holding by Investor Class: 54% Institutional
46% Retail and Other
59%
16%
10%
15%
Institutional Holdings by Country
United States
Canada
United Kingdom
Other
0
50
100
150
200
250
300
350
Jan-15 Jul-15 Jan-16 Jul-16 Jan-17 Jul-17 Jan-18
RelativePerformance
SSRM (96%) Silver (4%) Gold (9%)
SSR Mining Inc.
www.ssrmining.com
Toll-free: +1 888.338.0046
Telephone: +1 604.689.3846
Email: invest@ssrmining.com

Ssr mining corp. pres. 180531 - june presentation final

  • 1.
    June 2018 A TRACKRECORD OF CREATING VALUE
  • 2.
    Cautionary Notes PAGE 2SSRM:NASDAQ/TSX CautionaryNote Regarding Forward-Looking Statements This presentation contai ns for ward-looking i nfor mation within the meani ng of C anadian securities laws and for war d-looking statements within the meaning of the U.S. Pri vate Securities Litigati on Reform Act of 1995 (collectivel y, “for ward-looking statements”). All statements, other than statements of historical fact, are forward-looki ng statements. Generall y, for ward-looking statements can be identi fied by the use of words or phrases such as “expects,” “ antici pates,” “pl ans,” “projects,” “esti mates,” “assumes,” “intends,” “strategy,” “goals,” “objectives,” “potential,” “believes,” or variations thereof, or stating that certain actions, events or results “ may,” “could,” “would,” “might” or “will” be taken, occur or be achieved, or the negative of any of these terms or similar expressions. These for ward‐looking statements or information relate to, among other things: future producti on of preci ous metals; futur e costs of i nventor y, and cash costs and all-in sustaini ng costs (“AISC”) per payabl e ounce of preci ous metals sold; expected operating, exploration and development expenditures; the prices of precious metals; the effects of laws, regulations and gover nment policies affecting our operations or potential futur e oper ations; future successful development of our projects; the sufficiency of our current wor king capital , anticipated operating cash fl ow or our ability to raise necessary funds; esti mated producti on rates for precious metals; ti ming of devel opment and production and the cash costs and total costs of producti on at the Marigold mine, the Seabee Gold Operation, Puna Operations and our other projects; the estimated cost of sustaining capital; our ability to discover new mineralization, to upgrade Mineral Resources and convert Miner al Resources to Mineral Reser ves, to extend forecasted mine life and to i ncrease operati onal flexibility for the Marigold mi ne, the Seabee Gol d Operation and Puna Operations; opportunities to i ncrease the economics of the Marigold mi ne, the Seabee Gold Operati on and Puna Operati ons; our expected drill pr ograms at each of the Marigold mine, the Seabee Gold Operation, Puna Operations and our other projects; timi ng for and potential of M arigold mine equipment repl acement study; timing and outcome of per mitting process for the Marigold mi ne EIS development; the anticipated effect of haul truck and equi pment purchases at the M arigold mine on future production; expansion of the Seabee Gold Operati on based on the results of the Prelimi nar y Economic Assessment (“PEA”); the PEA repr esenting pr oduction growth, improved margins and expansion of Miner al Resources; timing, amount and duration of future production of gold under the PEA; the estimates of economic r etur ns from the Seabee Gold Operati on under the PEA; expected timing for and potential of throughput ramp up at the Seabee Gold Oper ation; the timi ng of the Pirquitas underground study and the potential for a Pirquitas underground operation to provide an additi onal, high grade ore str eam to the Pirquitas plant; expected timi ng of or e deli very from the Chinchillas project to the Pirquitas mill and anticipated producti on resulting therefr om; expected ore supply generated from the Chinchillas project; the estimates of expected or anticipated economic returns from our mining pr ojects, including future sales of metals, concentrate or other products; future successful exploration and development of our proj ects; ongoing or futur e development plans and capital replacement, improvement or remediati on programs; and our pl ans and expectati ons for our pr operties and operations. These forward-looking statements are subject to a variety of known and unknown risks, uncertainti es and other factors that could cause actual events or r esults to differ from those expr essed or i mplied, including, wi thout li mitation, the following: uncertainty of production, development plans and cost esti mates for the Marigold mine, the Seabee Gold Oper ation, Puna Oper ations and our proj ects; our ability to repl ace Mineral Reserves; commodity price fl uctuati ons; political or economic i nstability and unexpected regulator y changes; currency fluctuations; the possibility of future l osses; gener al economic condi tions; counterparty and mar ket risks related to the sale of our concentrate and metals; uncertai nty in the accur acy of Mineral Reserves and Mineral Resources estimates and in our ability to extr act mineralizati on profitabl y; differences i n U.S. and Canadi an practices for reporting Mineral R eser ves and Mineral Resources; lack of suitable infrastructure or damage to existing infrastructure; future development risks, including start-up delays and cost overruns; our ability to obtain adequate financi ng for further expl orati on and development programs and opportunities; uncertai nty in acquiring additional commercially mineable mineral rights; del ays i n obtai ning or failure to obtain gover nmental permits, or non-compliance with our per mits; our ability to attract and retain qualified personnel and management; the impact of governmental r egulations, including health, safety and environmental regulations, including increased costs and restrictions on operations due to compli ance with such regulations; unpredictable risks and hazards r elated to the development and operation of a mi ne or miner al pr operty that are beyond our control; reclamation and cl osure requirements for our mineral properties; potential labour unrest, including labour actions by our unionized employees at Puna Oper ations; indigenous peoples’ title claims and rights to consultation and accommodation may affect our existi ng operations as well as development proj ects and future acquisitions; certai n tr ansportation risks that could have a negati ve impact on our abilityto operate; assessments bytaxation authorities in multipl e jurisdictions; recover ability of value added tax and significant delays in the collecti on process in Argentina; claims and legal proceedings, including adverse r ulings in litigation against us and/or our directors or officers; compliance with anti-corruption laws and internal controls, and increased regulator y compliance costs; complying with emerging climate change regulations and the i mpact of cli mate change; fully r ealizing our inter est in deferred consi deration recei ved in connection wi th recent di vestitur es; fully r ealizing the val ue of our shareholdings in our mar ketable securities, due to changes i n price, liquidity or disposal cost of such mar ketable securities; uncertainti es related to title to our mineral properties and the ability to obtain surface rights; the sufficiency of our insurance coverage; civil disobedience in the countries where our mineral pr operties ar e located; oper ational safety and security risks; acti ons required to be taken by us under human rights l aw; competiti on in the mining industr y for mineral properties; our ability to complete and successfully integrate an announced acquisiti on; reputation l oss resulting in decreased investor confidence, increased challenges i n developing and maintaining community relations and an impediment to our overall ability to advance our pr ojects; risks nor mally associated with the conduct of joint ventures; an event of default under our converti ble notes may significantl yr educe our liquidity and adversel y affect our business; failure to meet covenants under our senior secured revolvi ng credit facility; i nformation systems security thr eats; conflicts of i nter est that could arise from certain of our directors’ and officers’ involvement with other natural r esource compani es; other risks related to our common shares; and those other various risks and uncertainties identified under the heading “RiskFactors” in our most recent Annual Infor mation Form filed with the Canadian securities regulatory authorities and included in our most recent Annual Report on Form 40-F filed with the U.S. Securities and Exchange Commission (“SEC”). The foregoing list is not exhausti ve of all factors and assumptions which may have been used. We cannot assure you that actual events, perfor mance or results will be consistent with these for ward-looking statements, and management’s assumptions may prove to be incorrect. Our forward-looki ng statements reflect current expectati ons regarding future events and operati ng perfor mance and speak onl y as of the date her eof and we do not assume any obligation to update for ward-looking statements if circumstances or management’s beliefs, expectations or opinions should change other than as required by applicable law. For the reasons set forth above, you should not place undue reliance on forward-looking statements. All references to “$” in this presentation are to U.S. dollars unless otherwise stated. Qualified Persons Except as other wise set out her ein, the scientific and technical information contained i n this presentation relating to each of the: Marigold mine has been reviewed and approved by Thomas Rice and James N . Car ver, each of whom is a SM E Registered Member, a qualifi ed person under National Instr ument 43- 101 – Standards of Disclosur e for Mineral Projects (“NI 43-101”) and our empl oyee; Seabee Gold Operation has been revi ewed and appr oved byF. Carl Edmunds, P. Geo., a qualified person under NI 43-101 and our employee; and Puna Operations has been r eviewed and approved by Bruce Butcher, P. Eng., a qualified person under NI 43-101 and our employee. The qualified persons have verified the infor mation disclosed herein, including the sampling, preparation, security and analytical procedures underlying such information, and are not aware of any significant risks and uncertainties that could be expected to affect the reliability or confidence in the information discussed herein. Cautionary Note to U.S. Investors This presentation includes Mineral R eser ves and Mineral Resources classification terms that comply with reporti ng standards in Canada and the Mineral Reser ves and the Mineral Resources estimates are made in accordance with NI 43-101. NI 43-101 is a rule developed by the Canadi an Securities Admi nistrators that establishes standards for all public disclosur e an issuer makes of scientific and technical i nformation concerni ng miner al projects. These standards differ significantl y from the requirements of the SEC set out i n SEC Industry Guide 7. Consequently, Mineral Reserves and Mineral Resources infor mation included in this presentation is not comparable to similar infor mation that would generally be disclosed by domestic U.S. reporting compani es subject to the r eporting and discl osure requirements of the SEC. Under SEC standards, mi neralization may not be cl assified as a “reser ve” unless the deter mination has been made that the mi neralization could be economicall y produced or extr acted at the ti me the reserve deter mination is made. In addition, the SEC’s disclosure standar ds normally do not per mit the inclusion of infor mation concerning “Measured Mineral Resources,” “Indicated Mineral Resources” or “Inferred Mineral Resources” or other descriptions of the amount of mineralization in mineral deposits that do not constitute “reserves” by U.S. standards in documents filed with the SEC. Cautionary Note Regarding Non-GAAP Measures This presentati on includes certain ter ms or performance measures commonl y used i n the mining industry that are not defined under International Financial R eporting Standards (“IFRS”), i ncludi ng cash costs and AISC per payabl e ounce of preci ous metals sol d, realized metal prices, adjusted attributable net income (loss) and adjusted basic attributable earnings (loss) per share. Non-GAAP financi al measures do not have any standardized meaning prescribed under IFRS and, therefore, may not be comparable to similar measures r eported by other compani es. We believe that, in additi on to conventional measures pr epared in accordance with IFRS, certai n i nvestors use this i nfor mation to evaluate our perfor mance. The data presented is intended to pr ovide additional infor mation and should not be considered in isolation or as a substitute for measures of perfor mance prepar ed in accordance with IFRS. These non-GAAP measures should be read in conjunction with our consolidated financial statements. R eaders should refer to our management’s discussion and analysis, available under our corporate profile at www.sedar.com or on our website at www.ssrmining.com, under the heading “Non-GAAP and Additional GAAP Financial Measures”
  • 3.
    PAGE 3 Track record offree cash flow generation Track record of creating shareholder value Track record of growth and decreasing costs Leveraged to gold with attractive liquidity Why SSR Mining? A long-term track record of creating value 1 2 3 4 5 6 Strong platform in favorable jurisdictions Track record of delivery
  • 4.
    2016 0 0.1 0.2 0.3 0.4 0.5 2017 84K oz Au 73K oz AuEq 202K ozAu PAGE 4 Nevada: #3 ranked globally Argentina: +10 year operating history Saskatchewan: #2 ranked globally +8 year mine life expected at all three operations Strong Operating Platform in Favorable Jurisdictions 3.19MozAu 1 Marigold Seabee +38% +84 0.44MozAu 45.7MozAg Notes: Production represents 2017 actual production on an attributable, gold equivalent basis. Reserve growth compares Mineral Reserves as at year end 2017 vs. 2014 for Marigold, year end 2017 vs. 2015 (as published by Claude Resources) for Seabee, and attributable Mineral Reserves as at year end 2017 vs. 2016 for Puna Operations. Please refer to “Cautionary Notes” and “Reserves and Resources: Notes to Table” in this presentation. 2014 2017 2015 2017 Favorable Jurisdictions Diversified Production Base Mineral Reserves Growth +376%+84% Puna
  • 5.
    100 150 200 250 300 350 400 450 2012 2013 20142015 2016 2017 Gold-EquivalentProduction(Koz) Production Guidance Actual Production Reliable trend of delivering more gold… 400 500 600 700 800 900 1,000 1,100 1,200 2012 2013 2014 2015 2016 2017 Gold-EquivalentCashCosts($/oz) Cash Cost Guidance Actual Cash Costs Six-year history of meeting or exceeding guidance Track Record of Delivery PAGE 5SSRM:NASDAQ/TSX …at lower cash costs with less variability Notes: Gold Eq. ounces have been established using the realized silver price and the weighted average realized gold price at each of our operations in the respective years and applied to the recovered metal content of the gold and silver ounces produced, as applicable. Realized metal prices and cash costs are non-GAAP financial measures. Please see "Cautionary Note Regarding Non-GAAP Measures” in this presentation. 2
  • 6.
    PAGE 6SSRM:NASDAQ/TSX +32% increasein annual AuEq production by 2021Strong Outlook Track Record of Growth and Decreasing Costs3 Notes: Production and cash costs for 2017 reflect actual production and cash costs as reported in our news release dated February 22, 2018. Production and cash costs for 2018 reflect the mid-point of 2018 guidance as reported in our news release dated January 15, 2018, and are presented on an attributable co-product basis. Production and cash costs for each of the 2019-2021 periods for each operation are based on the Marigold Five-Year Outlook as reported in our news release dated September 15, 2016, the Seabee Gold Operation PEA as reported in our news release dated September 7, 2017 and the Puna Operations PFS as reported in our news release dated May 31, 2017. Puna Operations production reported on a 100% basis prior to formation of joint venture with Golden Arrow on May 31, 2017; subsequent to May 31, 2017, Puna Operations production is reported on a 75% basis. Gold equivalent ounces have been established using the realized silver price and the weighted average realized gold price at each of our operations in the respective years and applied to the recovered metal content of the gold and silver ounces produced, as applicable. Gold equivalent production and cash costs are calculated on a co-product basis, utilizing historical prices through 2017, 2018 guidance as reported in our news release dated January 15, 2018, and Mineral Reserve prices for 2019-2021. Realized metal prices and cash costs are non-GAAP financial measures. Please see "Cautionary Note Regarding Non-GAAP Measures” in this presentation. $0 $200 $400 $600 $800 $1,000 $1,200 0 100 200 300 400 500 2012A 2013A 2014A 2015A 2016A 2017A 2018E 2019E 2020E 2021E Gold-EquivalentCashCosts($/oz) Gold-EquivalentProduction(Koz) Puna Marigold Seabee Cash Costs
  • 7.
    PAGE 7SSRM:NASDAQ/TSX Increased cashbalance ten consecutive quartersOps Driven FCF Note: SSR Mining’s cash and cash equivalents as per financial statements as at each respective quarterly date. Track Record of Free Cash Flow Generation4 $0 $100 $200 $300 $400 $500 Q1 2014 Q2 2014 Q3 2014 Q4 2014 Q1 2015 Q2 2015 Q3 2015 Q4 2015 Q1 2016 Q2 2016 Q3 2016 Q4 2016 Q1 2017 Q2 2017 Q3 2017 Q4 2017 Q1 2018 CashandCashEquivalents($M) Acquired Marigold (all cash) Acquired Seabee (all shares)
  • 8.
    PAGE 8SSRM:NASDAQ/TSX Leveraged toGold with Attractive Trading Liquidity Notes: “Beta to gold price” represents “raw beta” calculated on weekly returns versus a spot gold price index from January 1, 2015 to May 30, 2018. Daily volume based on combined trading volumes from primary and secondary exchanges, as applicable, from January 1, 2015 to May 30, 2018. Source: Bloomberg, Capital IQ. 5 2.3% 2.1% 1.8% 1.3% 1.2% 1.2% 1.1% 1.0% 0.9% 0.7% 0.5% 0.5% Coeur SSR Mining Hecla Eldorado NewGold Tahoe Fortuna McEwen B2Gold Detour Oceana Torex Dailyvolume(%ofsharesout) 2.75 2.69 2.65 2.53 2.50 2.29 2.14 2.09 2.04 1.93 1.90 1.86 SSR Mining McEwen Coeur Fortuna B2Gold Detour Torex New Gold Hecla Eldorado Tahoe Oceana BetatoGoldPrice
  • 9.
    Operational Excellence anddisciplined M+A are key differentiators Track Record of Creating Net Asset Value Per Share PAGE 9 Creating Value Notes: Peer index represents an equal weighted index, indexed to SSR Mining NAV per share beginning December 31, 2014 and ending May 30, 2018; peer index includes Coeur, Hecla, Tahoe Resources, OceanaGold, Torex Gold, New Gold, B2 Gold, Detour Gold, Eldorado Gold and Fortuna. McEwen Mining data not applicable for inclusion in peer index. Source: Capital IQ. 6 +71% -5% $4 $5 $6 $7 $8 $9 $10 $11 $12 $13 Dec-14 Jun-15 Dec-15 Jun-16 Dec-16 Jun-17 Dec-17 NetAssetValue($/sh) SSR Mining Peer Index
  • 10.
    Depth of experienceand a top governance rating SSR Mining Executive Team and Board of Directors PAGE 10SSRM:NASDAQ/TSX Michael Anglin Chairman Paul Benson Director, President and CEO Gustavo Herrero Director Brian Booth Director Beverlee Park Director Richard Paterson Director Steven Reid Director Simon Fish Director Elizabeth Wademan Director Nadine J. Block VP, Human Resources Paul Benson President and CEO W. John DeCooman, Jr. VP, Business Development and Strategy Gregory J. Martin SVP and CFO Kevin O’Kane COO First decile corporate governance rating leads peer groupISS Score: 1
  • 11.
    2018 Production andCash Costs Guidance SSRM:NASDAQ/TSX PAGE 11 Marigold Seabee Puna (75% interest) SSR Mining Gold Gold Silver Gold Equivalent Production 190K – 210K oz 85K – 92K oz 2.3M – 3.3M oz 305K – 345K oz Cash Costs (US$/oz) $725/oz – $775/oz $560/oz – $610/oz $12.50/oz – $15.00/oz $705/oz – $760/oz Notes: Puna Operations and SSR Mining figures are presented on an attributable basis. Puna Operations 2018 production guidance for lead and zinc is 5.3 to 9.4 million pounds and 4.1 to 5.6 million pounds, respectively, on a 75% basis. Gold equivalent production and cash costs are based on a 73:1 gold to silver ratio. Cash costs is a non-GAAP financial measure. Please see "Cautionary Note Regarding Non-GAAP Measures” in this presentation. 325,000 oz AuEq at $735/oz cash costs in 2018Mid-point Guidance
  • 12.
  • 13.
    Maverick Springs Goldstrike Marigold SSR Mining project Othermines in area Twin Creeks Cortez Phoenix MARIGOLD Carlin Trend Battle Mountain- Eureka Trend  Open pit, run-of-mine heap leach gold operation  Produced 202,240 ounces of gold in 2017 at cash costs of $647 per ounce  2018 mid-point guidance of 200,000 ounces gold  Q1 2018 gold production of 42,960 ounces at $720 per ounce cash costs  ~200,000 tonnes of material moved per day  Strong safety and environmental practices  Excellent infrastructure  10-year Mineral Reserves life with potential to extend (subject to the current EIS process)  Significant exploration upside Marigold: Large Scale, Low-Cost Producer Notes: Cash costs is a non-GAAP financial measure. Please see "Cautionary Note Regarding Non-GAAP Measures” in this presentation. SSRM:NASDAQ/TSX PAGE 13
  • 14.
    +250K oz Au SSRM:NASDAQ/TSX PAGE14 Transformation: Increased Production and Lower Costs Targeting +250K oz gold production by 2022 Pre-Acquisition Mine Plan +150,000 oz Au Revised LOMP 2015/2016 +200,000 oz Au Upside from Equipment Replacement Study in 2019Compelling Base Case 0 50 100 150 200 250 2012A 2013A 2014A 2015A 2016A 2017A 2018E 2019E 2020E 2021E 2022E GoldProduction(Koz) Expanded Reserves and Fleet +225,000 oz Au Notes: 2018 production reflects 2018 guidance as reported in our news release dated January 15, 2018. Production for each of the 2019-2021 periods is based on the Marigold Five-Year Outlook as reported in our news release dated September 15, 2016. Expected production in 2022 is as referenced in our press release dated February 22, 2018.
  • 15.
    PAGE 15SSRM:NASDAQ/TSX Marigold MineralReserves and Resources Increased Y-o-Y Mineral Reserves gold grade increased to 0.46 g/t Notes: Mineral Reserves are based on $1,250/oz gold price assumption. Mineral Reserves include 0.19 million ounces of leach pad inventory. Probable Mineral Reserves have a grade of 0.46 g/t. Mineral Reserves figures have some rounding applied, and thus totals may not sum exactly. Measured and Indicated Mineral Resources are inclusive of Mineral Reserves. Mineral Resources include 0.19 million ounces of leach pad inventory. Mineral Resources are based on $1,400/oz gold price assumption. Measured and Indicated Mineral Resources have a grade of 0.46 g/t. Inferred Mineral Resources have a grade of 0.41 g/t. Mineral Resources figures have some rounding applied, and thus totals may not sum exactly. Please refer to “Cautionary Notes” and “Reserves and Resources: Notes to Table” in this presentation. 2.84 (0.22) 0.21 0.36 3.19 5.66 0.63 0 1 2 3 4 5 6 7 2016 Reserves Depletion Model Assumptions Exploration 2017 Reserves 2017 M+I Resources 2017 Inferred Resources GoldMineralReservesandMineralResources (millionounces)
  • 16.
    Marigold: Exploration Successand Resource Conversion SSRM:NASDAQ/TSX PAGE 16 8N Red Dot 8S 8SX MUD Waste TZN Leach Pad HideOutRed Dot North Basalt-Antler Valmy N Current mining area Mackay reserve pit outline
  • 17.
    Marigold: Exploration Successand Resource Conversion SSRM:NASDAQ/TSX PAGE 17 A A’ 8D 8S 8SX TZN HideOutRed Dot North Gold Grade (g/t) 75 meters 0.06 – 0.6 0.6 – 1.0 > 1.0 < 0.06 EOY 2017 Resource Pit Shell EOY 2017 Mackay Reserve Pit February 2018 Pit Surface Original Surface EOY 2017 Gold Grade Model Leach Pad MRA6461 35.1 m at 0.86 g/t MRA6434 106.7 m at 1.09 g/t Incl. 18.3 m at 4.10 g/t MRA6503 33.5 m at 2.50 g/t Incl. 25.9 m at 3.18 g/t MRA6502 59.4 m at 0.47 g/t N Notes: Measured and Indicated Mineral Resources are inclusive of Mineral Reserves. Please refer to our news releases dated February 23, 2017, May 1, 2017 and September 5, 2017 for further details. See also “Cautionary Notes” and “Reserves & Resources: Notes to Tables” in this presentation.
  • 18.
    Marigold: Equipment ReplacementStudy In 2019, evaluate mine fleet investment plan PAGE 18SSRM:NASDAQ/TSX Notes: Equipment replacement study trade-off parameters are targets only and do not reflect actual results or demonstrate actual economic viability. There is no certainty that such parameters will be reflected in the Marigold mine equipment replacement study or that the results of such study will be realized by us. Please see “Cautionary Notes” in this presentation. Scenario A Scenario B Material Movement Mtpa 80 +110 Life of Mine years ~10 +15 Gold Production oz/yr ~220,000 +300,000 Mining Cost $/tonne ~$1.50 <$1.30 Mine Fleet Investment Plan -- Replace with like-for-like equipment Add rope shovel, trucks and support gear Investment Capex $M LOMP LOMP + ~$100  Scenario A: Replace existing mine fleet with like-for-like equipment consistent with current life of mine plan  Scenario B: Expand mine fleet with additional rope shovel, haul trucks and related support gear potentially lowering mining costs to ‘enable’ Red Dot deposit  The following table outlines the targeted equipment replacement study trade-off parameters to be evaluated in 2019
  • 19.
    PAGE 19SSRM:NASDAQ/TSX  Continueto deliver robust operating margins  Additional hauling capacity and equipment replacement study  Mine-life extension through exploration at Valmy, East Basalt and Red Dot  2018 exploration budget of $9M, 80% increase from 2017  Deep sulphide exploration Marigold: Opportunities
  • 20.
  • 21.
    Seabee: Overview High-margin undergroundoperation in a stable jurisdiction  High-grade, underground mine in Saskatchewan, Canada  Strong safety and environmental practices  Large underexplored land position of +57,000 ha  Produced a record 83,998 ounces of gold in 2017 at cash costs of $602 per ounce  Q1 2018 gold production of 23,717 ounces at $481 per ounce cash costs  Record throughput of 1,036 tpd in Q1 2018 Seabee Gold Operation Saskatoon Flin Flon Note: Cash costs is a non-GAAP financial measure. Please see "Cautionary Note Regarding Non-GAAP Measures” in this presentation. SSRM:NASDAQ/TSX PAGE 21
  • 22.
    PAGE 22SSRM:NASDAQ/TSX Seabee MineralReserves and Resources Increased Y-o-Y Mineral Reserves gold grade increased to 9.9 g/t Notes: Mineral Reserves are based on $1,250/oz gold price assumption. Proven and Probable Mineral Reserves have a grade of 9.88 g/t. Measured and Indicated Mineral Resources are inclusive of Mineral Reserves. Mineral Resources are based on $1,400/oz gold price assumption. Measured and Indicated Mineral Resources have a grade of 10.74 g/t. Inferred Mineral Resources have a grade of 9.29 g/t. Mineral Reserves and Mineral Resources figures have some rounding applied, and thus totals may not sum exactly. Please refer to “Cautionary Notes” and “Reserves and Resources: Notes to Table” in this presentation. 361 92 166 437 681 674 0 200 400 600 800 1,000 1,200 1,400 2016 Reserves Depletion Exploration 2017 Reserves 2017 M+I Resources 2017 Inferred Resources GoldMineralReservesandResources (thousandounces)
  • 23.
    50 45 63 75 77 84 89 100 120 108 $998 $954 $757 $525 $663 $602 $585 $540 $442 $504 $0 $200 $400 $600 $800 $1,000 $1,200 0 20 40 60 80 100 120 140 2012A 2013A2014A 2015A 2016A 2017A 2018E 2019E 2020E 2021E CashCosts($/ozgold) GoldProduction(koz) Increasing Production at Lower Costs SSRM:NASDAQ/TSX PAGE 23 Acquired the Seabee Gold Operation May 31, 2016 Notes: Production and cash costs for 2017 reflect actual production and cash costs as reported in our news release dated February 22, 2018. Production and cash costs for each of the 2018-2021 periods is based on the Seabee Gold Operation PEA as reported in our news release dated September 7, 2017. The Seabee Gold Operation PEA is preliminary in nature and includes Inferred Mineral Resources that are considered too speculative geologically to have the economic considerations applied to them that would enable them to be categorized as Mineral Reserves, and there is no certainty that the Seabee Gold Operation PEA will be realized. Cash costs is a non-GAAP financial measure. Please see "Cautionary Note Regarding Non-GAAP Measures” in this presentation.
  • 24.
    SSRM:NASDAQ/TSX PAGE 24 450 650 850 1,050 1,250 Jan-16Mar-16 May-16 Jul-16 Sep-16 Nov-16 Jan-17 Mar-17 May-17 Jul-17 Sep-17 Nov-17 Jan-18 Mar-18 MillDryTonnesperDay Decreased stope production Forest fires Mill test trial Mill test trial Operational Excellence Driving Seabee Mill Improvements Step-change tonnage improvements since acquisition
  • 25.
    Year End 2017Santoy Mineral Resources SSRM:NASDAQ/TSX PAGE 25 Notes: Measured and Indicated Mineral Resources are inclusive of Mineral Reserves. Please refer to our news releases dated February 23, 2017, May 1, 2017 and September 5, 2017, and exploration results reported by Claude Resources in its news release dated May 22, 2013 for further details. See also “Cautionary Notes” and “Reserves & Resources: Notes to Tables” in this presentation. 100 meters Q3 2017 drillholes H1 2017 drillholes Previously Reported Drillholes Measured & Indicated Mineral Resources Inferred Mineral Resources Mined Areas Santoy Gap (9A, 9B, 9C) Santoy 8A Gap HW 2.5m at 27.7g/t (SUG-17-019) 7.0m at 7.17g/t (SUG-17-917) 2.8m at 26.6g/t (SUG-17-300) 6.3m at 7.43g/t (SUG-17-918) 2.1m at 10.8g/t (SUG-17-919)5.5m at 12.4g/t (SUG-17-041) 5.8m at 6.4g/t (SUG-17-042) 2.8m at 17.6g/t (SUG-17-021) 1.4m at 11.7g/t (SUG-17-023) 2.8m at 6.5g/t (SUG-17-038) 2.1m at 6.5g/t (SUG-17-914)9.5m at 9.1g/t (JOY-16-751) 9.9m at 8.2g/t (JOY-16-749) 2.1m at 52.8g/t (JOY-16-701) 0m Elev -400m Elev -800m Elev 1.9m at 200.9g/t (JOY-13-690) OPENOPEN OPEN 1.3m at 14.4g/t (SUG-17-047) 2.4m at 14.8g/t (SUG-17-050) 2.1m at 24.0g/t (SUG-17-923)
  • 26.
    Large, Contiguous LandPackage SSRM:NASDAQ/TSX PAGE 26 23,300 hectare land package at Seabee 34,000 hectare land package at Fisher Project (option agreement) 10 km Gold occurrence Santoy Mine Seabee Mine/mill airstrip & camp All weather road Fisher exploration camp Santoy shear zone Carr target CRJ target Santoy 3 target
  • 27.
    Seabee: Opportunities  Deliveron PEA expansion case to 1,050 tpd  Drive Operational Excellence initiatives  Evaluate 1,200 tpd sustained mill throughput  80% increase in exploration to $9M in 2018  Santoy Gap Hanging Wall  Carr, CRJ and Santoy 3 targets  Fisher extension  Convert Inferred Resources to Measured and Indicated SSRM:NASDAQ/TSX Seabee Gold Operation Saskatoon Flin Flon PAGE 27 Note: The Seabee PEA is preliminary in nature and includes Inferred Mineral Resources that are considered too speculative geologically to have the economic considerations applied to them that would enable them to be categorized as Mineral Reserves, and there is no certainty that the SGO PEA will be realized. Please refer to our news release dated September 7, 2017 for further details.
  • 28.
  • 29.
    Puna Operations JointVenture Brownfields development for Pirquitas operating life extension  SSR Mining is the JV operator with a 75% interest  JV includes Chinchillas, a silver-lead-zinc deposit, and the Pirquitas plant and facilities located 45 km away  Chinchillas construction initiated Q1 2018, first ore production expected H2 2018  Pirquitas plant capacity 5,000 tpd, with an operating life through +2025  Produced 6.2M oz silver in 2017, exceeding improved guidance, at cash costs of $13.07/oz silver  Q1 2018 production of 0.9M oz silver; stockpile processing expected through H1 2018  Pirquitas underground study to be completed in 2018 Notes: 2017 production presented on a 100% basis. For further information refer to our news releases on the Chinchillas project dated March 31, 2017, May 31, 2017, and November 7, 2017. Cash costs is a non-GAAP financial measure. Please also refer to “Cautionary Notes” in this presentation. SSRM:NASDAQ/TSX PAGE 29 Seabee Gold Operation Saskatoon Flin Flon Pirquitas Operation Jujuy, Argentina Chinchillas Project Jujuy, Argentina
  • 30.
    SSRM:NASDAQ/TSX PAGE 30 Notes:Base metals exposure of 28% based on value of metal produced from the Puna Operations PFS. Production and cash costs for 2018 reflect the mid-point of 2018 guidance as reported in our news release dated January 15, 2018, and are presented on an attributable co-product basis. Production and cash costs for each of the 2019-2021 periods is based on the Puna Operations PFS as reported in our news release dated May 31, 2017. Production is reported on a 75% basis. Silver-equivalent production calculated using Mineral Reserve prices for 2018-2021. Cash costs is a non-GAAP financial measure. Please see "Cautionary Note Regarding Non- GAAP Measures” in this presentation.  Production:  Silver: 2.3M to 3.3M ounces  Lead: 5.3M to 9.4M lbs  Zinc: 4.1M to 5.6M lbs  Cash costs:  $12.50/oz to $15.00/oz silver 2018 Guidance Medium Term Outlook Puna Operations: Near Term Growth by 2019 Significant LOM base metals exposure from lead and zinc 3.4 6.8 6.9 6.9 $0 $2 $4 $6 $8 $10 $12 $14 $16 0 2 4 6 8 2018E 2019E 2020E 2021E CashCost($/ozSilver-Equivalent) Silver-EquivalentProduction(Moz) Silver Lead Zinc Cash Costs
  • 31.
    SSRM:NASDAQ/TSX Chinchillas Project DevelopmentOn Track PAGE 31  EIA approval received 2017  First blast initiated March 2018  Workforce hired, construction and pre-stripping activities underway  First ore to the Pirquitas mill anticipated in H2 2018 Chinchillas site infrastructure - earthworks Stockpile dome construction – structural erection Tailings pumping infrastructure
  • 32.
    Maximizing value ofportfolio with property sales Portfolio Rationalization PAGE 32SSRM:NASDAQ/TSX 5 9 1 4. Puna Operations (Pirquitas UG) 5. San Luis Berenguela 6. Pitarrilla 1. MarigoldSan Marcial 8. Maverick Springs 9. Sunrise Lake 6 7 2 7. Amisk 2. Seabee 8 Candelaria Parral Projects owned by SSR Mining Properties sold or optioned from 2010 to present Diablillos Challacollo Bowdens San Agustin Brucejack Snowfield (Pretium) Silvertip 3. Puna Operations (Chinchillas) 3 Operating mines owned by SSR Mining 4
  • 33.
    SSRM:NASDAQ/TSX SSR Mining Inc. Deliveringvalue and growth for our shareholders PAGE 33  Ramp up at Seabee to 1,050 tpd in 2019  Marigold equipment replacement study in 2019  First ore production at Chinchillas H2 2018  Q1 2018 produced 78,483 gold equivalent ounces at $766/oz cash costs  Production growth to +410,000 oz AuEq by 2021  Strong liquidity position with $473M of cash  Q1 2018 operating cash flow of $11M  Track record of disciplined capital allocation  80% increase in exploration spend at Marigold and Seabee in 2018; drilling underway  SIB and Perdito projects  Pirquitas underground study in 2018 Notes: Cash and cash equivalents as of December 31, 2017. Please also refer to “Cautionary Notes” in this presentation. Production and Free Cash Flow Growth Near-term Investment Catalysts Strong Financial Position Exploration Upside
  • 34.
  • 35.
    PAGE 10 SSRM Q12018 Summary Solid performance and positioned for near-term growth  Produced 78,483 gold equivalent ounces, generating $11M of operating cash flow  Cash position increased to $473M  Seabee outperformed on throughput, costs and production  Chinchillas remains on track for ore delivery in H2 2018  Marigold and Seabee exploration are ramping up
  • 36.
    PAGE 36SSRM:NASDAQ/TSX Selected FinancialResults for 2016 and 2017 Notes: Silver sales and gold equivalent sales are on a 100% basis. Gold equivalent sales are based on total gold and silver sales and the realized silver and gold prices for each corresponding period. Realized metal prices, adjusted attributable net income and adjusted basic attributable earnings per share are non-GAAP financial measures. Please see "Cautionary Note Regarding Non- GAAP Measures” in this presentation. Units 2017 2016 Gold Sales oz 286,279 254,761 Total Silver Sales Moz 6.0 11.4 Total Gold Equivalent Sales oz 367,950 408,860 Gold Equivalent Production oz 370,486 393,325 Revenue $M $448.8 $491.0 Income from Mine Operations $M $113.3 $154.0 Net Income $M $71.5 $65.0 Basic Attributable Earnings per share $ $0.58 $0.63 Adjusted Attributable Net Income $M $40.1 $100.3 Adjusted Basic Attributable Earnings per share $ $0.34 $0.97 Cash Generated by Operating Activities $M $144.7 $170.7 Cash and Cash Equivalents $M $459.9 $327.1
  • 37.
     Once oreis loaded on the heap leach pad …  Average time to achieve primary recovery of +50% is 90 to 120 days  Average time to achieve overall recovery of 73% is seven to nine months  Most important factor to leach recovery time is loaded ore to ‘plastic’ distance  Every 100 feet of pad height extends leach recovery time by ~120 days PAGE 37SSRM:NASDAQ/TSX Marigold Mine: Heap Leach Process 0% 10% 20% 30% 40% 50% 60% 70% 80% 90% 100% 1 2 3 4 5 6 7 8 9 10 11 12 13 14 15 16 17 18 ExtractionRate Months After Ore is Placed on Leach Pad Extraction Rate of Recoverable Ounces 0-50 ft 50 -100 ft 100-200 ft 200-300 ft 300-400 ft
  • 38.
    Seabee: Value CreationOpportunity SSRM:NASDAQ/TSX PAGE 38 Seabee (SSR Mining) Island Gold (Alamos Gold) Lamaque (Eldorado Gold) Nevada Operations (Klondex Mines)⁴ Average Mill Throughput (tpd) 1,050 1,100 1,675 899 Average Milled Grade (g/t) 8.3 9.7 7.0 17.2 Mine Life (years) 7 8 10 n.a. Gold Recovery (%) 96.5% 96.5% 93.6% 90.1% Avg. Annual Gold Production (koz) 100 125 123 183 Cash Costs ($/ounce) 548 483 458 670 AISC ($/ounce) 682 620 634 953 Capital Investment ($M) 90 174 387 n.a. NPV5% ($M)¹ 292 335 290 n.a. Analyst Consensus NAV ($M)² 312 553 445 355 Net Asset Value / NPV5% (x) 1.1x 1.6x 1.5x n.a. Transaction Value ($M)³ n.a. 746 472 n.a. Transaction Value / NPV5% (x) n.a. 2.2x 1.6x n.a. (1) NPV5% for the Seabee Gold Operation PEA is based on our news release dated September 7, 2017 calculated at $1,300 per ounce gold price; Island Gold PEA is based on Richmont Mines news release dated May 29, 2017 calculated at $1,260 per ounce gold price; and Lamaque PEA is based on Integra Gold news release dated April 13, 2017 calculated at $1,250 per ounce gold price. (2) Analyst Consensus NAV reflects asset level NAV calculated for each operation as of February 16, 2018. (3) Transaction Value is the amount paid for Richmont Mines Inc. (sole asset is the Island Gold operation) and Integra Gold Corp. (sole asset is the Lamaque project) by Alamos Gold Inc. and Eldorado Gold Corp., respectively. (4) Mill Throughput, Milled Grade and Gold Recovery for Klondex Mines reflects 2017 actual reported data. Avg. Annual Production, Cash Costs and AISC for Klondex Mines reflect mid-point of 2018 guidance. Notes: The Seabee Gold Operation PEA is preliminary in nature and includes Inferred Mineral Resources that are considered too speculative geologically to have the economic considerations applied to them that would enable them to be categorized as Mineral Reserves, and there is no certainty that the Seabee Gold Operation PEA will be realized. Cash costs and AISC are non-GAAP financial measures. Please see "Cautionary Note Regarding Non- GAAP Measures” in this presentation.
  • 39.
    Seabee: Preliminary EconomicAssessment Expanded margins from higher throughput and grade  Increases mining rate by 21% to 1,050 tpd by 2019, compared to 2016  Mines 62% of Inferred Mineral Resources  Increases estimated LOM average gold production by 29% to 100,000 ounces per year (for the period 2018 to 2023, compared to 2016)  Utilizes current infrastructure to allow for lower project capital of $90M over seven years  LOM estimated cash costs of $548 per payable ounce gold sold  Pre-tax NPV(5%) of $364M ($1,300 gold price)  After-tax NPV(5%) of $292M ($1,300 gold price) SSRM:NASDAQ/TSX PAGE 39 Notes: The Seabee Gold Operation PEA is preliminary in nature and includes Inferred Mineral Resources that are considered too speculative geologically to have the economic considerations applied to them that would enable them to be categorized as Mineral Reserves, and there is no certainty that the Seabee Gold Operation PEA will be realized. Please refer to our news release dated September 7, 2017 for further details. Cash costs is a non-GAAP financial measure. Please see "Cautionary Note Regarding Non-GAAP Measures” in this presentation.
  • 40.
    SSRM:NASDAQ/TSX Seabee: PEA FinancialSummary and Sensitivity Analysis PAGE 40 Notes: The Seabee Gold Operation PEA is preliminary in nature and includes Inferred Mineral Resources that are considered too speculative geologically to have the economic considerations applied to them that would enable them to be categorized as Mineral Reserves, and there is no certainty that the Seabee Gold Operation PEA will be realized. Please refer to our news release dated September 7, 2017 for further details. The Canadian exchange rate is assumed to be 1.275:1 in 2017-2018 and 1.25:1 thereafter. Cash costs is a non-GAAP financial measure. Please see "Cautionary Note Regarding Non-GAAP Measures” in this presentation. Cash Flows ($M) Net Revenue $893.5 Operating Costs $(346.0) Royalties and Other $(28.5) Δ in Working Capital $10.3 Operating Cash Flow $529.3 Capital Costs $(89.5) Reclamation $(7.2) Pre-Tax Cash Flow $432.7 Tax $(86.0) Post-tax Cash Flow $346.7 NPV5% (pre-tax) $363.5 NPV5% (post-tax) $292.0 Gold price $1,300 per ounce Exchange rate (2019 onwards) C$1.25:US$1.00 Pre-tax NPV (5%) Sensitivities ($M) Gold Price ($/oz) $1,200 $1,300 $1,400 Canadian Exchange Rate 1.20:1 $289 $346 $403 1.25:1 $307 $364 $420 1.30:1 $319 $376 $433 Pre-tax NPV (5%) Sensitivities ($M) Site Costs (% change) -10% 0% 10% Infrastructure Capital (% change) 10% $392 $359 $326 0% $396 $364 $331 -10% $401 $368 $335
  • 41.
    N Mineral Reserves andResources Tonnes Ag Pb Zn Ag Pb Zn Mt g/t % % Moz Mlb Mlb P&P 11.7 154 1.20 0.49 58 310 127 M&I 29.3 101 0.90 0.60 96 581 386 Inf 20.9 50 0.54 0.81 34 250 374 Mine life: 8 years Total material mined: 66.6 M tonnes Strip ratio: 4.7 Processing rate: 4,000 tpd Average annual production (8 years active mining): 6.1 Moz Silver 35.0 Mlb Lead 12.3 Mlb Zinc 8.4 Moz Silver Eq Total production: 51.0 Moz Silver 71.0 Moz Silver Eq Operating costs: $2.88 / t mined, mining costs $15.34 / t milled, mining costs $14.72 / t milled, processing cost $7.00 / t milled, G&A costs $8.29 / t milled, ore transport & other Cash costs: $7.40 / oz Silver (net of by-products) AISC: $9.75 / oz Silver (net of by-products) Development capital: $81 M Sustaining capital: $44 M NPV: $178 M (post-tax, 5%) IRR: 29% (post-tax) Chinchillas Project: Data Sheet (100% Basis) Near-term Production with Positive Pre-Feasibility Results SSRM:NASDAQ/TSX PAGE 41 Notes: All data is as reported in the technical report entitled “NI 43-101 Technical Report Pre-feasibility Study of the Chinchillas Silver-Lead-Zinc Project Jujuy Province, Argentina” filed on May 31, 2017 and available under our profile on the SEDAR website at www.sedar.com. Cash costs are net of estimated capitalized stripping over the life of mine. Metal price assumptions include $19.50/oz silver, $0.95/lb lead and $1.00/lb zinc. Silver equivalent values are based on these metal price assumptions. Measured and Indicated Mineral Resources are inclusive of Mineral Reserves. Cash costs and AISC are non-GAAP measures. Please refer to “Cautionary Notes” in this presentation and the slide entitled “Chinchillas Mineral Reserves and Resources”.
  • 42.
    Pirquitas Underground Opportunity Focusedon Mine Life Extension PAGE 42SSRM:NASDAQ/TSX Notes: See news release dated September 21, 2015 for drillhole highlights and reference data for the Pirquitas exploration drill program. See also “Cautionary Notes”.  Potential small-scale, high-grade ore feed from the Chocaya, Oploca and Cortaderas veins  Positive drill results from 2015 drill program:  3.16 meters at 1,436 g/t silver  1.93 meters at 1,890 g/t silver  0.83 meters at 2,670 g/t silver  Re-evaluate Pirquitas UG Mineral Resources as a high-grade supply to supplement Chinchillas  Study to be completed in 2018 Pirquitas open pit (mined out Jan 2017)
  • 43.
    San Luis Project: PAGE43SSRM:NASDAQ/TSX San Luis Project Feasibility Study Results (June 2010) Note: See “Cautionary Notes” and “Reserves & Resources: Notes to Tables” in this presentation. Also see “Technical Report for the San Luis Project Feasibility Study, Ancash Department, Peru” dated June 4, 2010 and available under our profile on the SEDAR website at www.sedar.com. Mine life: 3.5 years Average annual production: 1.9M oz Ag 78,000 oz Au Cash costs: $313 / oz Au Resources (M+I): 9.0M oz Ag at 578.1 g/t 0.35M oz Au at 22.4 g/t Capital: $90 -$100M Mill throughput: 400 tonnes per day NPV: $39M (base case) IRR: 26.5% (base case) Deposit type: Volcanic hosted, low sulphidation, epithermal quartz vein deposit Opportunities: Identify additional veins and following on existing exploration targets Mine life: 32 years Average annual production: 15M oz Ag (1st 18 years) Cash costs: $10.01 / oz Ag Resources (M+I): 496.5M oz Ag at 96.7 g/t (open pit) 28.8M oz Ag at 173.5 g/t (U/G) Capital: $741M Strip ratio: 6:1 Mill throughput: 16,000 tonnes per day NPV (after tax): $737M ($25/oz Ag price) IRR (after tax): 12.8% (base case) Deposit type: Silver-lead-zinc deposit open pit / UG project Opportunities: U/G start-up operation potential Note: See “Cautionary Notes” and “Reserves & Resources: Notes to Tables” in this presentation. Also see “NI 43-101 Technical Report on the Pitarrilla Project Durango State, Mexico” dated December 14, 2012 and available under our profile on the SEDAR website at www.sedar.com. Pitarrilla Project: Large undeveloped silver resource A unique high-grade gold reserve with exploration upside Pitarrilla Project Feasibility Study Results (December 2012)
  • 44.
    Mineral Reserves (as ofDecember 31, 2017) Location Tonnes Silver Gold Lead Zinc SSRM SSRM Interest SSRM Interest millions g/t g/t % % % Interest Silver million oz Gold million oz Proven Mineral Reserves Seabee Canada 0.26 7.58 100 0.06 Chinchillas Argentina 1.64 180 0.75 0.42 75 7.1 Total 7.1 0.06 Probable Mineral Reserves Marigold U.S. 205.10 0.46 100 3.00 Marigold Leach Pad Inventory U.S. 100 0.19 Seabee Canada 1.12 10.41 100 0.37 Chinchillas Argentina 10.07 150 1.27 0.50 75 36.3 Pirquitas Stockpiles Argentina 1.05 90 0.69 75 2.3 San Luis Peru 0.51 447 18.06 100 7.2 0.29 Total 45.8 3.85 Total Proven and Probable Mineral Reserves Marigold U.S. 205.10 0.46 100 3.00 Marigold Leach Pad Inventory U.S. 100 0.19 Seabee Canada 1.37 9.88 100 0.44 Chinchillas Argentina 11.71 154 1.20 0.49 75 43.4 Pirquitas Stockpiles Argentina 1.05 90 0.69 75 2.3 San Luis Peru 0.51 447 18.06 100 7.2 0.29 Total Proven and Probable 52.9 3.92 SSRM:NASDAQ/TSX PAGE 44
  • 45.
    Mineral Resources: Measuredand Indicated (as of December 31, 2017) Location Tonnes Silver Gold Lead Zinc SSRM SSRM Interest SSRM Interest millions g/t g/t % % % Interest Silver million oz Gold million oz Measured Mineral Resources (Inclusive of Proven Mineral Reserves) Seabee Canada 0.57 9.29 100 0.17 Chinchillas Argentina 3.09 128 0.60 0.41 75 9.5 Pitarrilla Mexico 12.35 90 0.70 1.22 100 35.7 Total 45.3 0.17 Indicated Mineral Resources (Inclusive of Probable Mineral Reserves) Marigold U.S. 370.20 0.46 100 5.47 Marigold Leach Pad Inventory U.S. 100 0.19 Seabee Canada 1.40 11.33 100 0.51 Chinchillas Argentina 26.20 98 0.94 0.62 75 62.1 Pirquitas UG Argentina 2.63 292 4.46 75 18.6 Pirquitas Stockpiles Argentina 1.05 90 0.69 75 2.3 Pitarrilla Mexico 147.02 97 0.32 0.87 100 460.7 Pitarrilla UG Mexico 5.43 165 0.68 1.34 100 28.8 San Luis Peru 0.48 578 22.40 100 9.0 0.35 Amisk Canada 30.15 6 0.85 100 6.0 0.83 Total 587.5 7.34 Measured and Indicated Mineral Resources (Inclusive of Mineral Reserves) Marigold U.S. 370.20 0.46 100 5.47 Marigold Leach Pad Inventory U.S. 100 0.19 Seabee Canada 1.97 10.74 100 0.68 Chinchillas Argentina 29.29 101 0.90 0.60 75 71.6 Pirquitas UG Argentina 2.63 292 4.46 75 18.6 Pirquitas Stockpiles Argentina 1.05 90 0.69 75 2.3 Pitarrilla Mexico 159.36 97 0.35 0.89 100 496.5 Pitarrilla UG Mexico 5.43 165 0.68 1.34 100 28.8 San Luis Peru 0.48 578 22.40 100 9.0 0.35 Amisk Canada 30.15 6 0.85 100 6.0 0.83 Total Measured and Indicated 632.7 7.52 SSRM:NASDAQ/TSX PAGE 45
  • 46.
    Mineral Resources: Inferred (asof December 31, 2017) Location Tonnes Silver Gold Lead Zinc SSRM % SSRM Interest Silver SSRM Interest Gold millions g/t g/t % % Interest million oz million oz Inferred Mineral Resources Marigold U.S. 49.70 0.41 100 0.63 Seabee Canada 2.26 9.29 100 0.67 Chinchillas Argentina 20.92 50 0.54 0.81 75 25.4 Pirquitas UG Argentina 1.08 207 7.45 75 5.4 Pitarrilla Mexico 8.52 77 0.18 0.58 100 21.2 Pitarrilla UG Mexico 1.23 138 0.89 1.25 100 5.5 San Luis Peru 0.02 270 5.60 100 0.2 0.00 Amisk Canada 28.65 4 0.64 100 3.7 0.59 Total Inferred 61.4 1.90 SSRM:NASDAQ/TSX PAGE 46
  • 47.
    Reserves and Resources Notesto Tables All estimates set forth in the Mineral Reserves and Mineral Resources table have been prepared in accordance with National Instrument 43-101 - Standards of Disclosure for Mineral Projects (“NI 43-101”). The estimates of Mineral Reserves and Mineral Resources for each property other than the Marigold mine, the Seabee Gold Operation and the Amisk project have been reviewed and approved by Bruce Butcher, P.Eng., our Director, Mine Planning, and F. Carl Edmunds, P.Geo., our Chief Geologist, each of whom is a Qualified Person. Mineral Resources are reported inclusive of Mineral Reserves. Mineral Resources that are not Mineral Reserves do not have demonstrated economic viability. Due to the uncertainty that may be attached to Inferred Mineral Resources, it cannot be assumed that all or any part of an Inferred Mineral Resource will be upgraded to an Indicated or Measured Mineral Resource as a result of continued exploration. Mineral Resources and Mineral Reserves estimates of silver ounces for Puna Operations are reported on a 75% attributable basis. Mineral Resources and Mineral Reserves figures have some rounding applied, and thus totals may not sum exactly. All ounces reported herein represent troy ounces, and “g/t” represents grams per tonne. All $ references are in U.S. dollars. All Mineral Reserves and Mineral Resources estimates are as of December 31, 2017. Metal prices utilized for Mineral Reserves estimates are $1,250 per ounce of gold, $18.00 per ounce of silver, $0.90 per pound of lead and $1.00 per pound of zinc, except as noted below for the San Luis project. Metal prices utilized for Mineral Resources estimates are $1,400 per ounce of gold, $20.00 per ounce of silver, $1.10 per pound of lead and $1.30 per pound of zinc, except as noted below for each of the Chinchillas project, the San Luis project and the Amisk project. All technical reports for the properties are available under our profile on the SEDAR website at www.sedar.com or on our website at www.ssrmining.com. Marigold: Except for updates to cost parameters and metal price assumptions noted above, all other key assumptions, parameters and methods used to estimate Mineral Reserves and Mineral Resources and the data verification procedures followed are set out in the technical report entitled “NI 43-101 Technical Report on the Marigold Mine, Humboldt County, Nevada” dated November 19, 2014. For additional information about the Marigold mine, readers are encouraged to review our most recently filed Annual Information Form. Mineral Reserves estimate was prepared under the supervision of Thomas Rice, SME Registered Member, a Qualified Person and our Technical Services Manager at the Marigold mine, and is reported at a cut-off grade of 0.065 g/t payable gold. Mineral Resources estimate was prepared under the supervision of James N. Carver, SME Registered Member, our Chief Geologist at the Marigold mine, and Karthik Rathnam, MAusIMM (CP), our Chief Engineer at the Marigold mine, each of whom is a Qualified Person. Mineral Resources estimate is reported based on an optimized pit shell at a cut-off grade of 0.065 g/t payable gold, and includes an estimate of Mineral Resources for mineralized stockpiles. Mineral Resources for mineralized stockpiles were estimated using Inverse Distance cubed. Seabee Gold Operation: Except for updates to cost parameters, metal price assumptions noted above, mill recovery and dilution to include recent operating results, and resource modeling techniques based on recommendations set forth in the technical report entitled “NI 43-101 Technical Report for the Seabee Gold Operation, Saskatchewan, Canada” dated October 20, 2017 (the “Seabee Gold Operation Technical Report”), all other key assumptions, parameters and methods used to estimate Mineral Reserves and Mineral Resources and the data verification procedures followed are set out in the Seabee Gold Operation Technical Report. For additional information about the Seabee Gold Operation, readers are encouraged to review the Seabee Gold Operation Technical Report. Mineral Reserves estimate was prepared under the supervision of Kevin Fitzpatrick, P.Eng., a Qualified Person and our Engineering Supervisor at the Seabee Gold Operation. Mineral Reserves estimate for the Seabee mine is reported at a cut-off grade of 4.55 g/t gold, and for the Santoy mine is reported at a cut-off grade of 3.68 g/t gold. Mineral Resources estimate was prepared under the supervision of Jeffrey Kulas, P.Geo., a Qualified Person and our Manager Geology, Mining Operations at the Seabee Gold Operation. Mineral Resources estimate for the Seabee mine is reported at a cut-off grade of 4.06 g/t gold, and for the Santoy mine is reported at a cut-off grade of 3.29 g/t gold. Block modelling techniques were used for Mineral Resources and Mineral Reserves evaluation for the Santoy mine and the majority of the Seabee mine. Polygonal techniques were used in areas of historical mining at the Seabee mine. The preliminary economic assessment set forth in the Seabee Technical Report is preliminary in nature, and it includes Inferred Mineral Resources that are considered too speculative geologically to have the economic considerations applied to them that would enable them to be categorized as Mineral Reserves, and there is no certainty that the preliminary economic assessment will be realized. Puna Operations: Chinchillas Mineral Reserves estimate is reported at a cut-off grade of $32.56 per tonne net smelter return (“NSR”). For additional information on the key assumptions, parameters and methods used to estimate Chinchillas Mineral Reserves and the data verification procedures followed, readers are encouraged to review the technical report entitled “NI 43-101 Technical Report Pre-feasibility Study of the Chinchillas Silver- Lead-Zine Project Jujuy Province, Argentina” dated May 15, 2017 (the “Chinchillas Technical Report”). Chinchillas Mineral Resources estimate is reported at a base case cut-off grade, which reflects the transport to and processing of ore at the Pirquitas property, of 60.00 grams per tonne silver equivalent based on projected operating costs and using metal price assumptions of $22.50 per ounce of silver, $1.00 per pound of lead and $1.10 per pound of zinc. For additional information on the key assumptions, parameters and methods used to estimate Chinchillas Mineral Resources and the data verification procedures followed, readers are encouraged to review the Chinchillas Technical Report. Pirquitas underground Mineral Resources (Pirquitas UG) estimate is reported below the completed open pit shell; Mineral Resources estimate for the Mining Area (which includes San Miguel, Chocaya, Oploca and Potosí zones) is reported at a cut-off grade of $100.00 per tonne NSR for San Miguel, Oploca and Potosi, and $90.00 per tonne NSR for Cortaderas. Pirquitas Mineral Reserves and Pirquitas Mineral Resources estimates in surface stockpiles are reported at a cut-off grade of $16.93 per tonne NSR, respectively, and were determined based on grade, rehandling costs and recovery estimates from metallurgical testing. San Luis: Mineral Reserves estimate is reported at a cut-off grade of 6.9 g/t gold equivalent, using metal price assumptions of $800 per ounce of gold and $12.50 per ounce of silver. Mineral Resources estimate is reported at a cut-off grade of 6.0 g/t gold equivalent, using metal price assumptions of $600 per ounce of gold and $9.25 per ounce of silver. Pitarrilla: Mineral Resources estimate for the open pit is reported at a cut-off grade of $16.38 per tonne NSR for direct leach material, and $16.40 per tonne NSR for flotation/leach material. Underground Mineral Resources (Pitarrilla UG) estimate is reported below the constrained open pit resource shell above a cut-off grade of $80.00 per tonne NSR, using grade shells that have been trimmed to exclude distal and lone blocks that would not support development costs. Amisk: Mineral Resources estimate was prepared by Sebastien Bernier, P.Geo., Principal Consultant (Resource Geology), SRK Consulting (Canada) Inc., a Qualified Person. Mineral Resources estimate is reported at a cut-off grade of 0.40 grams of gold equivalent per tonne using metal price assumptions of $1,100 per ounce of gold and $16.00 per ounce of silver inside conceptual pit shells optimized using metallurgical and process recovery of 87%, overall ore mining and processing costs of $15.00 per tonne and overall pit slope of fifty-five degrees.. SSRM:NASDAQ/TSX PAGE 47
  • 48.
  • 49.
  • 50.
    Strong governance rating SSRMining Inc. PAGE 50SSRM:NASDAQ/TSX Source: FactSet, ISS and BMO Capital Markets as of April 16, 2018.
  • 51.
    Share capital structure,convertible note and top shareholders overview SSR Mining Inc. PAGE 51SSRM:NASDAQ/TSX Source: Capital IQ, Bloomberg; as at May 30, 2018. Cash and cash equivalents, marketable securities, convertible notes, revolving credit facility and total shares outstanding as at March 31, 2018. Market capitalization as at May 30, 2018. $ Million Cash and Cash Equivalents $473 Marketable Securities $44 Convertible Notes $265 Revolving Credit Facility $75 Market Capitalization $1,242 Total Shares Outstanding: 119.9 million Top 10 Shareholders % of Shares Outstanding Van Eck 13.3% Renaissance Technologies 4.9% Sun Valley Gold 3.1% Investec Asset Management 2.6% Norges Bank 2.2% The Vanguard Group 2.0% Global X Management 2.0% BMO Asset Management 1.5% Credit Suisse Asset Management 1.2% Fidelity Management and Research 1.1% Holding by Investor Class: 54% Institutional 46% Retail and Other 59% 16% 10% 15% Institutional Holdings by Country United States Canada United Kingdom Other 0 50 100 150 200 250 300 350 Jan-15 Jul-15 Jan-16 Jul-16 Jan-17 Jul-17 Jan-18 RelativePerformance SSRM (96%) Silver (4%) Gold (9%)
  • 52.
    SSR Mining Inc. www.ssrmining.com Toll-free:+1 888.338.0046 Telephone: +1 604.689.3846 Email: invest@ssrmining.com