Download to read offline

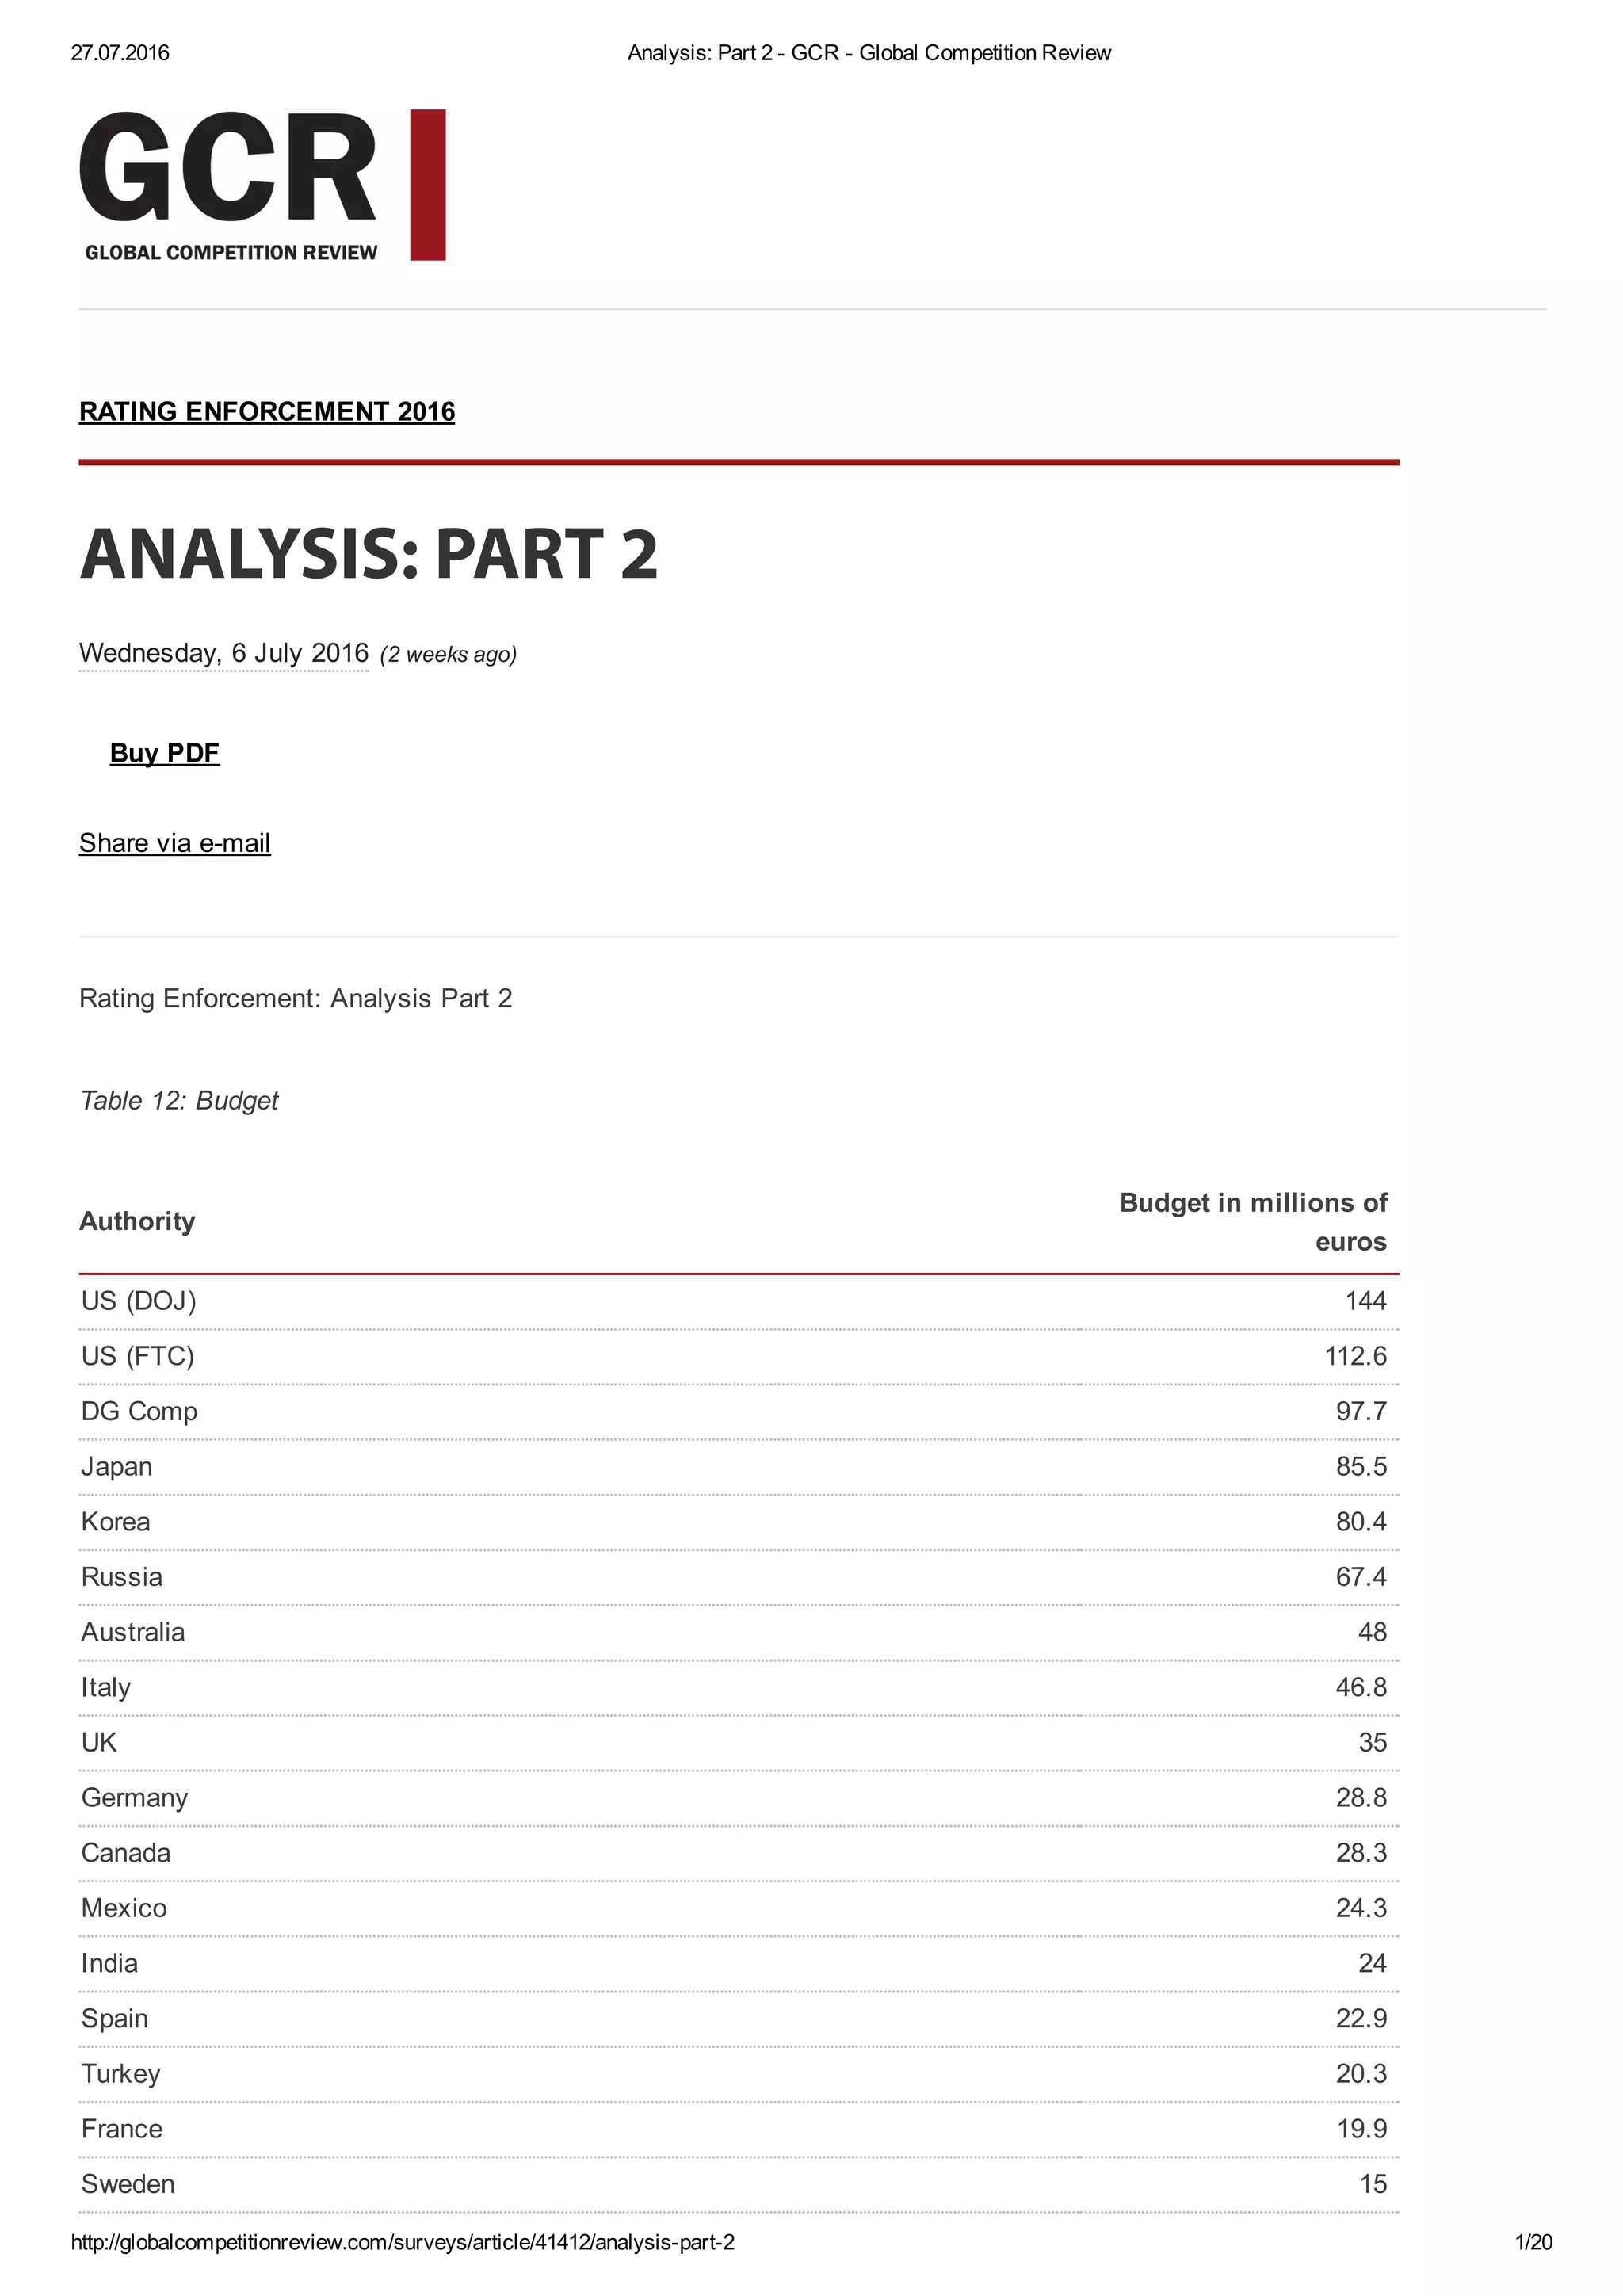
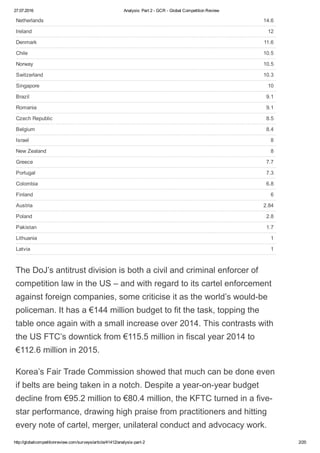
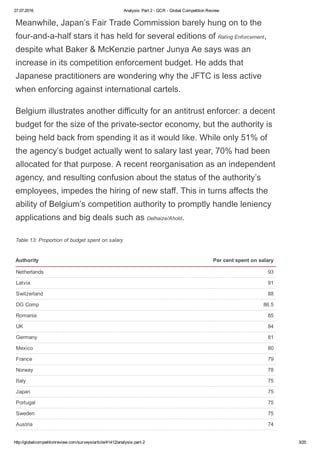
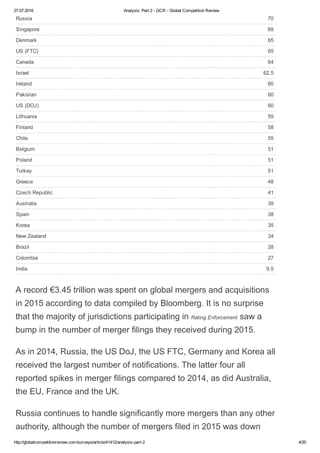
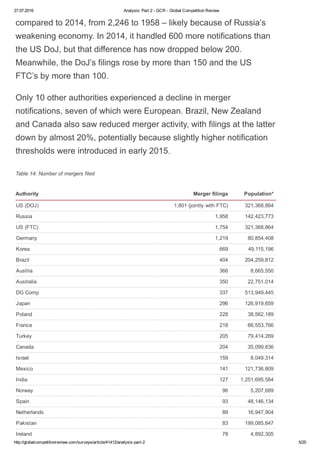
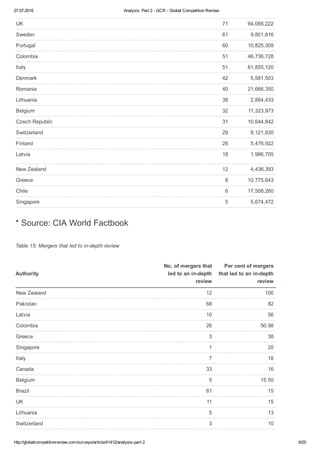
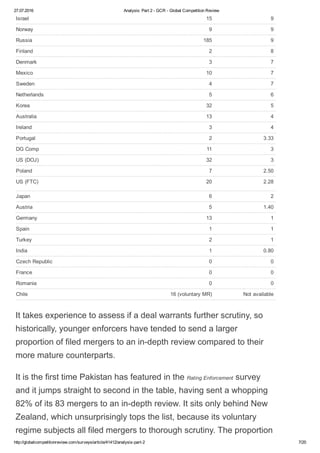
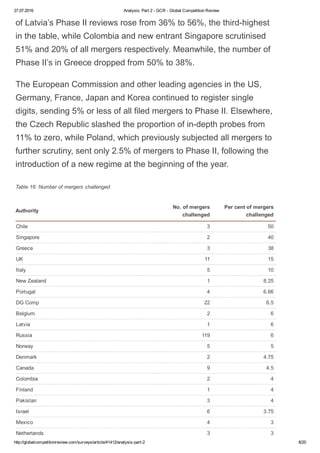
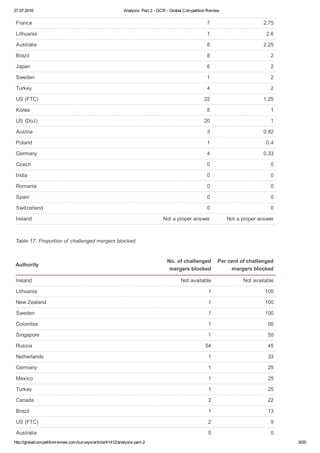
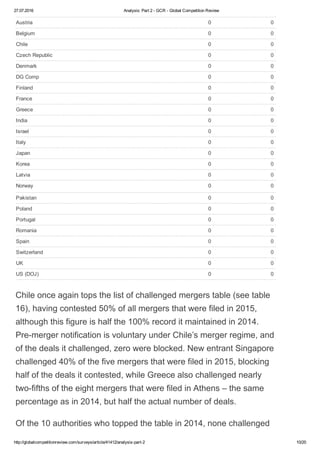
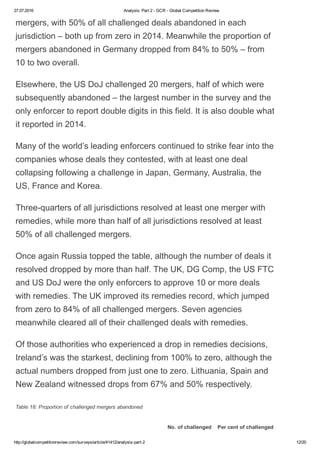
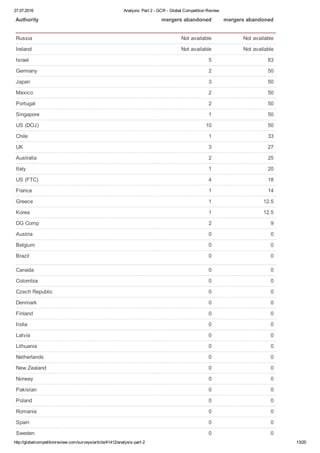
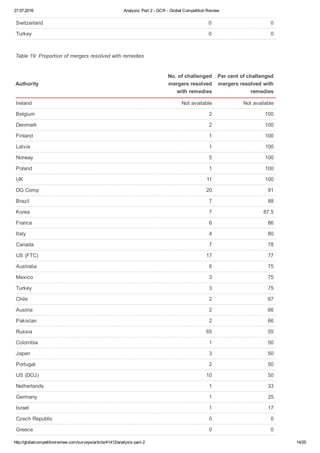
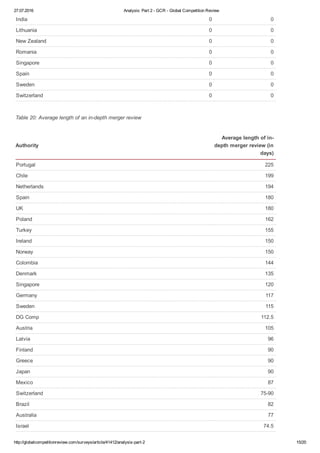
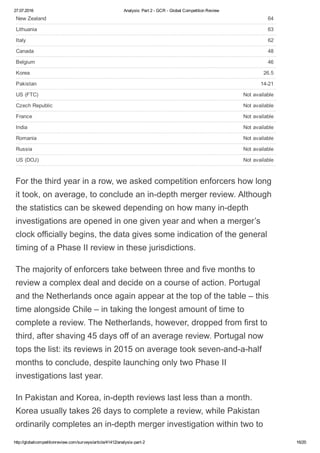

The document analyzes competition authority budgets and enforcement activities globally. It provides tables showing budgets, the proportion spent on salaries, the number of merger filings received, the percentage of mergers that underwent an in-depth review, and the number of mergers challenged. The US DOJ had the largest budget at $144 million, while the proportion of budgets spent on salaries ranged from 9.5% in India to 93% in the Netherlands. Russia received the most merger filings in 2015 at 1,958, while Pakistan sent the highest percentage (82%) for an in-depth review. Chile challenged the highest percentage of mergers at 50%.


