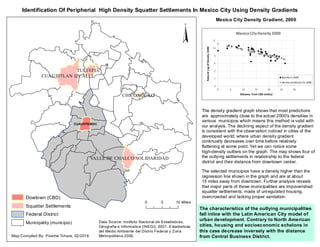
CUAUHTEMOC
CUAUTITLAN IZCALLI
TULTEPEC
VALLE DE CHALCO SOLIDARIDAD
CHICONCUAC
Identification Of Peripherial High Density Squatter Settlements In Mexico City Using Density Gradients
Map Compiled By: Pizeme Tchara, 02/2018
Data Source: Instituto Nacional de Estadisticas,
Geografia e Informatica (INEGI), 2001. Estadisticas
del Medio Ambiente del Distrio Federal y Zona
Metropolitana 2000.
Mexico City Density Gradient, 2000
§
0 105 Miles
The density gradient graph shows that most predictions
are approximately close to the actual 2000's densities in
various municipos which means this method is valid with
our analysis. The declining aspect of the density gradient
is consistent with the observation noticed in cities of the
developed world; where urban density gradient
continually decreases over time before relatively
flattening at some point. Yet we can notice some
high-density outliers on the graph. The map shows four of
the outlying settlements in relationship to the federal
district and their distance from downtown center.
The selected municipios have a density higher than the
regression line shown in the graph and are at about
15 miles away from downtown. Further analysis reveals
that major parts of those municipalities are impoverished
squatter settlements, made of unregulated housing,
overcrowded and lacking proper sanitation.
Municipality (municipio)
Federal District
Squatter Settlements
Dowtown (CBD)
The characteristics of the outlying municipalities
fall inline with the Latin American City model of
urban development. Contrary to North American
cities, housing and socioeconomic echelons in
this case decrease inversely with the distance
from Central Business District.
0
2
4
6
8
10
12
0 5 10 15 20 25 30
MexicoCity Density 2000
density in 2000
density prediction for 2000
NaturalLogofDensity2000
Distance from CBD (miles)

Squatter Settlements

  • 1.
    CUAUHTEMOC CUAUTITLAN IZCALLI TULTEPEC VALLE DECHALCO SOLIDARIDAD CHICONCUAC Identification Of Peripherial High Density Squatter Settlements In Mexico City Using Density Gradients Map Compiled By: Pizeme Tchara, 02/2018 Data Source: Instituto Nacional de Estadisticas, Geografia e Informatica (INEGI), 2001. Estadisticas del Medio Ambiente del Distrio Federal y Zona Metropolitana 2000. Mexico City Density Gradient, 2000 § 0 105 Miles The density gradient graph shows that most predictions are approximately close to the actual 2000's densities in various municipos which means this method is valid with our analysis. The declining aspect of the density gradient is consistent with the observation noticed in cities of the developed world; where urban density gradient continually decreases over time before relatively flattening at some point. Yet we can notice some high-density outliers on the graph. The map shows four of the outlying settlements in relationship to the federal district and their distance from downtown center. The selected municipios have a density higher than the regression line shown in the graph and are at about 15 miles away from downtown. Further analysis reveals that major parts of those municipalities are impoverished squatter settlements, made of unregulated housing, overcrowded and lacking proper sanitation. Municipality (municipio) Federal District Squatter Settlements Dowtown (CBD) The characteristics of the outlying municipalities fall inline with the Latin American City model of urban development. Contrary to North American cities, housing and socioeconomic echelons in this case decrease inversely with the distance from Central Business District. 0 2 4 6 8 10 12 0 5 10 15 20 25 30 MexicoCity Density 2000 density in 2000 density prediction for 2000 NaturalLogofDensity2000 Distance from CBD (miles)