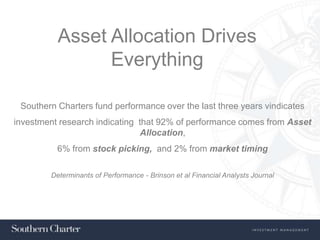
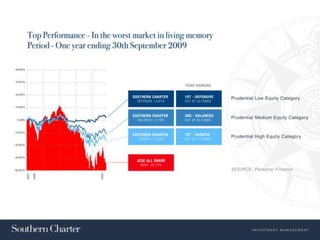
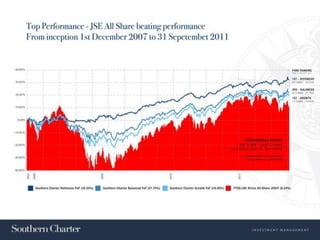
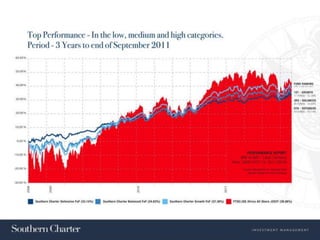
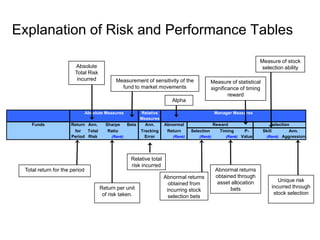
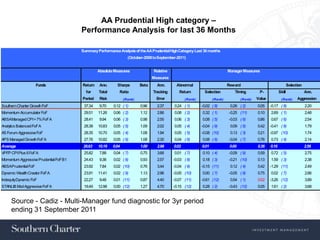
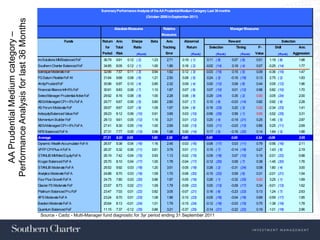
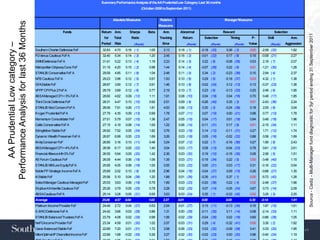
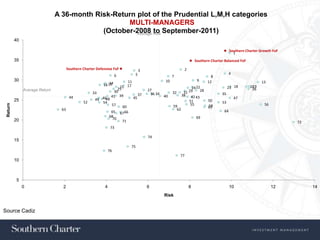
The Inconvenient Truth
Asset Allocation Drives
                Everything

 Southern Charters fund performance over the last three years vindicates
investment research indicating that 92% of performance comes from Asset
                                Allocation,
          6% from stock picking, and 2% from market timing

        Determinants of Performance - Brinson et al Financial Analysts Journal
At Southern Charter we select fund
managers who have a value investment
style bias. An investment style pioneered
by Warren Edward Buffett, considered to
be one of the most successful investors in
the world.
Our Researched - Defensive Fund Manager Selection

 Equity            Fixed Interest       Offshore


                                        Offshore
                                        Property


                                        Commodity


                                        SA Property
Performance
Multi-Manager UT Fund Diagnostics
September 2011
● Bhekinkosi Khuzwayo ● Dieter Hendricks
Explanation of Risk and Performance Tables

                                                                                                                Measure of stock
                       Absolute                                                                                  selection ability
                       Total Risk
                        incurred            Measurement of sensitivity of the           Measure of statistical
                                              fund to market movements                  significance of timing
                                                                                                reward
                                                                       Alpha

                               Absolute Measures      Relative                              Manager Measures
                                                      Measures
    Funds            Return Ann.        Sharpe   Beta   Ann.        Abnormal              Reward                     Selection
                      for   Total        Ratio        Tracking       Return     Selection    Timing     P-       Skill        Ann.
                     Period Risk          (Rank)        Error          (Rank)      (Rank)       (Rank) Value      (Rank) Aggression


                                                   Relative total
                                                   risk incurred
 Total return for the period                                                                Abnormal returns
                                                                    Abnormal returns        obtained through
                                                                                             asset allocation           Unique risk
                                                                      obtained from
                                     Return per unit                                              bets               incurred through
                                                                     incurring stock
                                      of risk taken.                                                                  stock selection
                                                                      selection bets
AA Prudential High category –
                                        Performance Analysis for last 36 Months

                                        Summary Performance Analysis of the AA Prudential High Category:Last 36 months
                                                                  (October-2008 to September-2011)


                                                 Absolute Measures              Relative                                   Manager Measures
                                                                                Measures
                     Funds              Return    Ann.      Sharpe       Beta     Ann.       Abnormal                      Reward                                  Selection
                                          for    Total       Ratio              Tracking      Return         Selection         Timing        P-            Skill               Ann.
                                        Period    Risk          (Rank)            Error           (Rank)          (Rank)           (Rank)   Value           (Rank)       Aggression
Southern Charter Growth FoF              37.34    9.70    0.12 ( 1)      0.96     2.37      0.24 ( 1)      -0.02 ( 8)       0.26 ( 2)       0.05    -0.17 ( 8)                 2.20
Momentum Accumulator FoF                 29.51   11.26    0.06 ( 2)      1.12     2.86      0.08 ( 2)       0.32 ( 1)      -0.25 (11)       0.10    2.69 ( 1)                  2.48
ABSAManaged CPI + 7% FoF A               28.41    9.94    0.06 ( 3)      0.98     2.55      0.06 ( 3)       0.08 ( 5)      -0.03 ( 6)       0.86    0.67 ( 6)                  2.54
Analytics Balanced FoF A                 28.38   10.83    0.05 ( 5)      1.09     2.02      0.05 ( 4)      -0.04 ( 9)       0.09 ( 5)       0.42    -0.41 ( 9)                 1.79
AS Forum Aggressive FoF                  28.35   10.70    0.05 ( 4)      1.08     1.94      0.05 ( 5)      -0.08 (10)       0.13 ( 3)       0.21    -0.97 (10)                 1.74
APS Managed Growth FoF A                 27.76   10.82    0.05 ( 6)      1.08     2.30      0.04 ( 6)       0.08 ( 6)      -0.04 ( 7)       0.76    0.73 ( 4)                  2.14
Average                                  26.63   10.19   0.04            1.00     2.98     0.02            0.01             0.00            0.36    0.16                       2.56
VPFP CPI Plus 6 FoF A                    25.82    7.88    0.04 ( 7)      0.75     3.66      0.01 ( 7)       0.10 ( 4)      -0.09 ( 9)       0.59    0.72 ( 5)                  2.75
Momentum Aggressive Prudential FoF B1    24.43    9.38    0.02 ( 8)      0.93     2.57     -0.03 ( 8)       0.18 ( 3)      -0.21 (10)       0.13    1.59 ( 3)                  2.38
ABSAPrudential FoF                       23.92    7.84    0.02 (10)      0.76     3.44     -0.04 ( 9)      -0.15 (11)       0.12 ( 4)       0.42    -1.29 (11)                 2.49
Dynamic Wealth Creator FoF A             23.91   11.41    0.02 ( 9)      1.13     2.96     -0.05 (10)       0.00 ( 7)      -0.05 ( 8)       0.75    0.02 ( 7)                  2.66
IndequityDynamic FoF                     22.27    9.48    0.01 (11)      0.87     4.40     -0.07 (11)      -0.61 (12)       0.54 ( 1)       0.02    -3.26 (12)                 3.89
STANLIB Mod Aggressive FoF A             19.49   12.98    0.00 (12)      1.27     4.70     -0.15 (12)       0.28 ( 2)      -0.43 (12)       0.05    1.61 ( 2)                  3.68


     Source - Cadiz - Multi-Manager fund diagnostic for 3yr period
     ending 31 September 2011
Summary Performance Analysis of the AA Prudential Medium Category:Last 36 months
                                                                                                                 (October-2008 to September-2011)

Performance Analysis for last 36 Months
                                                                                          Absolute Measures                Relative                                    Manager Measures
   AA Prudential Medium category –

                                                                                                                           Measures
                                                             Funds               Return Ann.         Sharpe        Beta      Ann.       Abnormal                       Reward                               Selection
                                                                                   for    Total          Ratio             Tracking       Return         Selection         Timing        P-         Skill               Ann.
                                                                                 Period    Risk           (Rank)             Error            (Rank)          (Rank)           (Rank)   Value           (Rank)     Aggression
                                          InvSolutions MMBalanced FoF             36.79    9.91   0.12 ( 2)         1.23     2.71      0.19 ( 1)       0.11 ( 8)        0.07 ( 9)       0.51     1.19 ( 8)              1.98
                                          Southern Charter Balanced FoF           34.85    8.05   0.12 ( 1)         1.00     1.86      0.16 ( 2)       -0.02 (14)       0.18 ( 4)       0.07    -0.25 (14)              1.77
                                          Baroque Moderato FoF                    32.66    7.57   0.11 ( 3)         0.94     1.62      0.12 ( 3)       -0.03 (15)       0.15 ( 5)       0.09    -0.36 (15)              1.47
                                          FG Saturn Flexible FoF A1               31.64    9.68   0.08 ( 6)         1.21     2.50      0.08 ( 5)       0.24 ( 3)        -0.16 (19)      0.13     2.75 ( 2)              1.83
                                          AmityPrudent FoF                        30.96    6.97   0.10 ( 4)         0.85     2.32      0.09 ( 4)       0.00 (12)        0.09 ( 8)       0.44     0.05 (12)              1.96
                                          Financial Alliance Infl+5% FoF          30.91    8.83   0.08 ( 7)         1.10     1.87      0.07 ( 6)       0.07 (10)        0.01 (12)       0.96     0.82 (10)              1.70
                                          Select Manager Prudential Active FoF    29.92    8.16   0.08 ( 8)         1.00     2.28      0.06 ( 8)       -0.29 (24)       0.35 ( 2)       0.00    -3.05 (24)              2.00
                                          ABSAManaged CPI + 5% FoF A              29.77    6.67   0.09 ( 5)         0.80     2.80      0.07 ( 7)       0.10 ( 9)        -0.03 (14)      0.82     0.92 ( 9)              2.28
                                          AS Forum Moderate FoF                   29.57    8.67   0.07 ( 9)         1.09     1.67      0.04 ( 9)       -0.16 (23)       0.20 ( 3)       0.02    -2.34 (23)              1.41
                                          IndequityBalanced Value FoF             28.23    8.12   0.06 (10)         0.91     3.85      0.03 (10)       -0.56 (25)       0.59 ( 1)       0.00    -3.52 (25)              3.31
                                          Momentum Builder FoF                    28.13    9.61   0.05 (12)         1.16     3.21      0.01 (12)       0.20 ( 4)        -0.19 (21)      0.25     1.45 ( 5)              2.87
                                          ABSAManaged CPI + 6% FoF A              27.41    8.30   0.05 (14)         1.00     2.69      0.00 (13)       0.03 (11)        -0.03 (13)      0.86     0.25 (11)              2.69
                                          NFB Balanced FoF A                      27.31    7.77   0.05 (13)         0.96     1.98      0.00 (14)       0.17 ( 5)        -0.16 (20)      0.14     1.84 ( 3)              1.88
                                          Average                                 27.21    8.20   0.05              1.00     2.38      0.00            0.00             0.00            0.34    -0.06                   2.05
                                          Dynamic Wealth Accumulator FoF A        26.57    9.38   0.04 (16)         1.16     2.45     -0.03 (16)       -0.06 (17)       0.03 (11)       0.79    -0.56 (16)              2.11
                                          VPFP CPI Plus 4 FoF A                   26.37    5.32   0.06 (11)         0.61     3.79      0.01 (11)       0.15 ( 7)        -0.14 (18)      0.27     1.43 ( 6)              2.19
                                          STANLIB MMMed EquityFoF A               26.19    7.42   0.04 (15)         0.93     1.13     -0.02 (15)       -0.09 (18)       0.07 (10)       0.19    -2.01 (22)              0.98
                                          Kruger Balanced FoF A                   25.70    8.10   0.04 (17)         1.00     1.78     -0.04 (17)       -0.12 (20)       0.09 ( 7)       0.38    -1.45 (20)              1.76
                                          STANLIB Moderate FoF A                  25.52    9.92   0.03 (18)         1.20     3.51     -0.05 (18)       0.26 ( 2)        -0.31 (24)      0.08     1.80 ( 4)              3.00
                                          Analytics Moderate FoF A                24.88    8.70   0.03 (19)         1.09     1.70     -0.06 (20)       -0.15 (22)       0.09 ( 6)       0.31    -2.01 (21)              1.54
                                          Four Plus Growth FoF A                  24.75    7.80   0.03 (20)         0.96     1.97     -0.05 (19)       0.26 ( 1)        -0.32 (25)      0.00     3.25 ( 1)              1.69
                                          Glacier FS Moderate FoF                 23.57    8.73   0.02 (21)         1.09     1.79     -0.09 (22)       0.00 (13)        -0.09 (17)      0.34    -0.01 (13)              1.62
                                          Platinum Balanced Pru FoF               23.47    7.03   0.01 (22)         0.82     3.05     -0.07 (21)       0.16 ( 6)        -0.23 (23)      0.13     1.24 ( 7)              2.63
                                          APS Moderate FoF A                      23.24    8.70   0.01 (23)         1.08     1.96     -0.10 (23)       -0.05 (16)       -0.04 (16)      0.69    -0.59 (17)              1.85
                                          Bastion Moderate FoF A                  20.64    8.13   -0.01 (24)        1.01     1.79     -0.15 (24)       -0.12 (19)       -0.03 (15)      0.75    -1.38 (19)              1.78
                                          Quantum Balanced FoF                    11.15    7.37   -0.12 (25)        0.86     3.21     -0.37 (25)       -0.14 (21)       -0.22 (22)      0.19    -1.01 (18)              2.96
                                           Source - Cadiz - Multi-Manager fund diagnostic for 3yr period ending 31 September 2011
Summary Performance Analysis of the AA Prudential Low Category:Last 36 months
                                                                                                                   (October-2008 to September-2011)


                                                                                            Absolute Measures                  Relative                                   Manager Measures
Performance Analysis for last 36 Months                                                                                        Measures
                                                              Funds                Return Ann.         Sharpe          Beta      Ann.      Abnormal                       Reward                               Selection


                                                                                                                                                                                                                                   Source - Cadiz - Multi-Manager fund diagnostic for 3yr period ending 31 September 2011
                                                                                    for     Total          Ratio               Tracking      Return         Selection         Timing        P-         Skill               Ann.
                                                                                   Period    Risk                                Error                                                     Value                      Aggression
     AA Prudential Low category –


                                                                                                            (Rank)                               (Rank)          (Rank)           (Rank)                   (Rank)

                                          Southern Charter Defensive FoF           32.83     4.70   0.16 ( 1)           1.05     2.13     0.18 ( 1)       -0.18 (33)       0.36 ( 2)       0.00    -2.09 (32)              1.82
                                          FG Venus Cautious FoF A                  32.40     5.34   0.14 ( 3)           1.20     2.45     0.16 ( 2)       -0.01 (22)       0.17 ( 8)       0.19    -0.09 (21)              2.27
                                          SMMI Defensive FoF A                     31.41     5.22   0.13 ( 4)           1.19     2.23     0.14 ( 3)       0.22 ( 8)        -0.08 (26)      0.53     2.19 ( 7)              2.07
                                          Metropolitan OdysseyCons FoF             31.15     4.20   0.15 ( 2)           0.98     1.44     0.14 ( 4)       -0.07 (29)       0.22 ( 6)       0.01    -1.21 (30)              1.28
                                          STANLIB Conservative FoF A               29.59     4.85   0.11 ( 8)           1.04     2.48     0.11 ( 5)       0.34 ( 2)        -0.23 (38)      0.10     2.94 ( 4)              2.37
                                          NFB Cautious FoF A                       29.23     3.96   0.12 ( 5)           0.91     1.53     0.10 ( 6)       0.29 ( 5)        -0.18 (37)      0.03     4.32 ( 1)              1.38
                                          GFAStable FoF                            28.97     3.90   0.12 ( 7)           0.91     1.46     0.10 ( 8)       -0.02 (24)       0.12 (13)       0.13    -0.37 (23)              1.36
                                          VPFP CPI Plus 2 FoF A                    28.79     3.69   0.12 ( 6)           0.77     2.19     0.10 ( 7)       0.23 ( 6)        -0.13 (33)      0.25     2.46 ( 6)              1.95
                                          ABSAManaged CPI + 3% FoF A               28.60     4.82   0.09 (12)           1.11     1.91     0.08 (10)       0.04 (18)        0.04 (16)       0.70     0.48 (17)              1.85
                                          Third Circle Defensive FoF               28.31     4.47   0.10 (10)           0.92     2.51     0.09 ( 9)       -0.26 (40)       0.35 ( 3)       0.01    -2.43 (36)              2.24
                                          STANLIB Mod ConservFoF A                 28.06     7.91   0.06 (17)           1.81     4.53     0.06 (13)       0.30 ( 3)        -0.24 (39)      0.18     2.05 ( 8)              3.04
                                          Kruger Prudential FoF A                  27.79     4.35   0.09 (13)           0.99     1.78     0.07 (11)       0.07 (15)        0.00 (21)       0.98     0.77 (13)              1.78
                                          Momentum Consolidator FoF                27.51     5.79   0.07 (15)           1.36     2.47     0.05 (15)       0.04 (17)        0.01 (19)       0.94     0.48 (18)              1.96
                                          Celtis Conservative FoF A                27.15     4.19   0.08 (14)           1.00     1.22     0.06 (14)       -0.11 (31)       0.17 ( 9)       0.01    -2.15 (34)              1.11
                                          Stringfellow Stable FoF                  26.92     7.52   0.05 (24)           1.82     3.76     0.03 (19)       0.14 (12)        -0.11 (31)      0.27     1.71 (12)              1.74
                                          Dynamic Wealth Preserver FoF A           26.87     6.99   0.05 (23)           1.69     3.26     0.03 (18)       0.05 (16)        -0.02 (22)      0.88     0.58 (16)              1.69
                                          AmityConserver FoF                       26.80     3.16   0.10 (11)           0.48     3.24     0.07 (12)       0.22 ( 7)        -0.16 (36)      0.27     1.90 ( 9)              2.43
                                          ABSAManaged CPI + 4% FoF A               26.58     6.17   0.05 (22)           1.40     3.04     0.03 (17)       0.08 (13)        -0.04 (23)      0.78     0.61 (15)              2.61
                                          Financial Alliance Infl+3% FoF           26.55     5.94   0.05 (20)           1.42     2.36     0.03 (20)       0.19 (10)        -0.16 (35)      0.08     2.56 ( 5)              1.51
                                          AS Forum Cautious FoF                    26.09     4.44   0.06 (18)           1.06     1.35     0.03 (21)       -0.19 (34)       0.22 ( 5)       0.00    -3.48 (40)              1.15
                                          STANLIB MMLow EquityFoF A                25.95     4.05   0.06 (16)           1.00     0.55     0.03 (22)       0.00 (21)        0.03 (17)       0.31    -0.16 (22)              0.54
                                          Noble PP Strategic Income FoF A          25.69     2.02   0.10 ( 9)           0.35     2.96     0.04 (16)       -0.04 (27)       0.09 (15)       0.26    -0.68 (27)              1.35
                                          4i Stable FoF                            25.56     5.10   0.04 (26)           1.20     1.88     0.01 (26)       -0.35 (41)       0.37 ( 1)       0.00    -5.72 (42)              1.28
                                          Select Manager Cautious Managed FoF      25.53     3.63   0.06 (19)           0.79     1.99     0.03 (23)       -0.20 (36)       0.22 ( 4)       0.02    -2.48 (37)              1.66
                                          Skyblue Kimberlite Cautious FoF          25.26     3.79   0.05 (25)           0.78     2.28     0.02 (25)       0.07 (14)        -0.05 (24)      0.67     0.73 (14)              2.09
                                          ABSACautious FoF A                       25.14     3.28   0.05 (21)           0.55     3.03     0.03 (24)       0.35 ( 1)        -0.33 (42)      0.02     3.25 ( 3)              2.25
                                          Average                                  25.06     4.57   0.04               1.02      2.27     0.01            0.00             0.00            0.30    -0.14                   1.81
                                          Platinum Income Provider FoF             24.49     2.72   0.04 (27)           0.53     2.54     0.01 (27)       0.15 (11)        -0.13 (34)      0.16     1.87 (10)              1.61
                                          S-BRO Defensive FoF A                    24.42     3.66   0.03 (28)           0.86     1.31     0.00 (28)       -0.11 (30)       0.11 (14)       0.08    -2.14 (33)              1.11
                                          STANLIB Balanced Trustees FoF A          23.79     4.08   0.02 (29)           0.98     1.06     -0.02 (29)      -0.04 (26)       0.02 (18)       0.69    -0.86 (28)              1.05
                                          NeFG Income Provider FoF                 23.34     4.59   0.01 (30)           1.02     2.07     -0.03 (31)      0.29 ( 4)        -0.32 (41)      0.00     3.30 ( 2)              1.82
                                          Oasis Balanced Stable FoF                22.69     7.20   0.01 (31)           1.72     3.58     -0.06 (33)      0.03 (20)        -0.09 (28)      0.41     0.33 (20)              1.95
                                          MitonOptimal IP Diversified Income FoF   22.66     1.68   -0.02 (35)          0.26     3.27     -0.02 (30)      -0.02 (23)       0.00 (20)       0.96    -0.40 (24)              1.19
A 36-month Risk-Return plot of the Prudential L,M,H categories
                                                    MULTI-MANAGERS
                                             (October-2008 Risk September-2011)
                                                       Average to
          40

                                                                                                                                                 Southern Charter Growth FoF
                                                                                                                                                   1
          35                                                                                                                Southern Charter Balanced FoF

                                       Southern Charter Defensive FoF                  3                            2
                                                                      6            5                                                             4
                                                                                                          7                          8
          30                                                             11                          10                      9     12                             13
                                                                14
                                                            16 15     21 17                                            24 22                    23 18        19
                                                                                                                                                            20
               Average Return                                        25                     27                              28                               26
                                                     33            30
                                                                                             36 34        32      31 29                    35
                                                                  41 39                37            40          38 42 43
                                        44                                        45
          25                                           49 4648
                                                                                                                     51            50
                                                                                                                                                     47
                                                52        54                                                                               53
                                                                                                                      55                                            56
 Return


                                                                  57       60                             59                       58
                                                                                                                                   61
                                  63                                                                        62                              64
                                                                  65      67 66
                                                                 68                                                         69
          20                                                       70
                                                                           71                                                                                                  72
                                                                  73

                                                                                            74
          15
                                                                                  75
                                                                 76
                                                                                                               77
          10


           5
               0                  2                          4                              6                           8                        10                      12         14
                                                                                                     Risk


Source Cadiz
Winner of the Growling Bear Award* for
the top performing funds in the worst
market ever!
{*If there was such an award Southern Charter would win it hands down! For the following
categories}

Top Performing funds - In prudential high, medium, low
and variable categories over 3yrs ending Sep 2011
Top performing - risk profiled prudential funds
Top performing - asset allocation prudential funds
Top performing - lifecycle retirement prudential funds
Top performing - Multi-manager on a risk adjusted basis
Top performing - Multi-manager, white label multi-manager
Our Well Diversified
Asset Allocation Investment
          Stategy
 Delivers More Certainty
  in an Uncertain World
       Mark Thompson
     Southern Charter.Com
Our Target Market
Ideally suited for investors who do not
                  wish,
  nor have the inclination, to manage
    their own asset allocation and
        fund manager selection
          on an ongoing basis.
Thank You!

Southern Charter - The Inconvenient Truth

  • 1.
  • 2.
    Asset Allocation Drives Everything Southern Charters fund performance over the last three years vindicates investment research indicating that 92% of performance comes from Asset Allocation, 6% from stock picking, and 2% from market timing Determinants of Performance - Brinson et al Financial Analysts Journal
  • 6.
    At Southern Charterwe select fund managers who have a value investment style bias. An investment style pioneered by Warren Edward Buffett, considered to be one of the most successful investors in the world.
  • 7.
    Our Researched -Defensive Fund Manager Selection Equity Fixed Interest Offshore Offshore Property Commodity SA Property
  • 8.
  • 12.
    Multi-Manager UT FundDiagnostics September 2011 ● Bhekinkosi Khuzwayo ● Dieter Hendricks
  • 13.
    Explanation of Riskand Performance Tables Measure of stock Absolute selection ability Total Risk incurred Measurement of sensitivity of the Measure of statistical fund to market movements significance of timing reward Alpha Absolute Measures Relative Manager Measures Measures Funds Return Ann. Sharpe Beta Ann. Abnormal Reward Selection for Total Ratio Tracking Return Selection Timing P- Skill Ann. Period Risk (Rank) Error (Rank) (Rank) (Rank) Value (Rank) Aggression Relative total risk incurred Total return for the period Abnormal returns Abnormal returns obtained through asset allocation Unique risk obtained from Return per unit bets incurred through incurring stock of risk taken. stock selection selection bets
  • 14.
    AA Prudential Highcategory – Performance Analysis for last 36 Months Summary Performance Analysis of the AA Prudential High Category:Last 36 months (October-2008 to September-2011) Absolute Measures Relative Manager Measures Measures Funds Return Ann. Sharpe Beta Ann. Abnormal Reward Selection for Total Ratio Tracking Return Selection Timing P- Skill Ann. Period Risk (Rank) Error (Rank) (Rank) (Rank) Value (Rank) Aggression Southern Charter Growth FoF 37.34 9.70 0.12 ( 1) 0.96 2.37 0.24 ( 1) -0.02 ( 8) 0.26 ( 2) 0.05 -0.17 ( 8) 2.20 Momentum Accumulator FoF 29.51 11.26 0.06 ( 2) 1.12 2.86 0.08 ( 2) 0.32 ( 1) -0.25 (11) 0.10 2.69 ( 1) 2.48 ABSAManaged CPI + 7% FoF A 28.41 9.94 0.06 ( 3) 0.98 2.55 0.06 ( 3) 0.08 ( 5) -0.03 ( 6) 0.86 0.67 ( 6) 2.54 Analytics Balanced FoF A 28.38 10.83 0.05 ( 5) 1.09 2.02 0.05 ( 4) -0.04 ( 9) 0.09 ( 5) 0.42 -0.41 ( 9) 1.79 AS Forum Aggressive FoF 28.35 10.70 0.05 ( 4) 1.08 1.94 0.05 ( 5) -0.08 (10) 0.13 ( 3) 0.21 -0.97 (10) 1.74 APS Managed Growth FoF A 27.76 10.82 0.05 ( 6) 1.08 2.30 0.04 ( 6) 0.08 ( 6) -0.04 ( 7) 0.76 0.73 ( 4) 2.14 Average 26.63 10.19 0.04 1.00 2.98 0.02 0.01 0.00 0.36 0.16 2.56 VPFP CPI Plus 6 FoF A 25.82 7.88 0.04 ( 7) 0.75 3.66 0.01 ( 7) 0.10 ( 4) -0.09 ( 9) 0.59 0.72 ( 5) 2.75 Momentum Aggressive Prudential FoF B1 24.43 9.38 0.02 ( 8) 0.93 2.57 -0.03 ( 8) 0.18 ( 3) -0.21 (10) 0.13 1.59 ( 3) 2.38 ABSAPrudential FoF 23.92 7.84 0.02 (10) 0.76 3.44 -0.04 ( 9) -0.15 (11) 0.12 ( 4) 0.42 -1.29 (11) 2.49 Dynamic Wealth Creator FoF A 23.91 11.41 0.02 ( 9) 1.13 2.96 -0.05 (10) 0.00 ( 7) -0.05 ( 8) 0.75 0.02 ( 7) 2.66 IndequityDynamic FoF 22.27 9.48 0.01 (11) 0.87 4.40 -0.07 (11) -0.61 (12) 0.54 ( 1) 0.02 -3.26 (12) 3.89 STANLIB Mod Aggressive FoF A 19.49 12.98 0.00 (12) 1.27 4.70 -0.15 (12) 0.28 ( 2) -0.43 (12) 0.05 1.61 ( 2) 3.68 Source - Cadiz - Multi-Manager fund diagnostic for 3yr period ending 31 September 2011
  • 15.
    Summary Performance Analysisof the AA Prudential Medium Category:Last 36 months (October-2008 to September-2011) Performance Analysis for last 36 Months Absolute Measures Relative Manager Measures AA Prudential Medium category – Measures Funds Return Ann. Sharpe Beta Ann. Abnormal Reward Selection for Total Ratio Tracking Return Selection Timing P- Skill Ann. Period Risk (Rank) Error (Rank) (Rank) (Rank) Value (Rank) Aggression InvSolutions MMBalanced FoF 36.79 9.91 0.12 ( 2) 1.23 2.71 0.19 ( 1) 0.11 ( 8) 0.07 ( 9) 0.51 1.19 ( 8) 1.98 Southern Charter Balanced FoF 34.85 8.05 0.12 ( 1) 1.00 1.86 0.16 ( 2) -0.02 (14) 0.18 ( 4) 0.07 -0.25 (14) 1.77 Baroque Moderato FoF 32.66 7.57 0.11 ( 3) 0.94 1.62 0.12 ( 3) -0.03 (15) 0.15 ( 5) 0.09 -0.36 (15) 1.47 FG Saturn Flexible FoF A1 31.64 9.68 0.08 ( 6) 1.21 2.50 0.08 ( 5) 0.24 ( 3) -0.16 (19) 0.13 2.75 ( 2) 1.83 AmityPrudent FoF 30.96 6.97 0.10 ( 4) 0.85 2.32 0.09 ( 4) 0.00 (12) 0.09 ( 8) 0.44 0.05 (12) 1.96 Financial Alliance Infl+5% FoF 30.91 8.83 0.08 ( 7) 1.10 1.87 0.07 ( 6) 0.07 (10) 0.01 (12) 0.96 0.82 (10) 1.70 Select Manager Prudential Active FoF 29.92 8.16 0.08 ( 8) 1.00 2.28 0.06 ( 8) -0.29 (24) 0.35 ( 2) 0.00 -3.05 (24) 2.00 ABSAManaged CPI + 5% FoF A 29.77 6.67 0.09 ( 5) 0.80 2.80 0.07 ( 7) 0.10 ( 9) -0.03 (14) 0.82 0.92 ( 9) 2.28 AS Forum Moderate FoF 29.57 8.67 0.07 ( 9) 1.09 1.67 0.04 ( 9) -0.16 (23) 0.20 ( 3) 0.02 -2.34 (23) 1.41 IndequityBalanced Value FoF 28.23 8.12 0.06 (10) 0.91 3.85 0.03 (10) -0.56 (25) 0.59 ( 1) 0.00 -3.52 (25) 3.31 Momentum Builder FoF 28.13 9.61 0.05 (12) 1.16 3.21 0.01 (12) 0.20 ( 4) -0.19 (21) 0.25 1.45 ( 5) 2.87 ABSAManaged CPI + 6% FoF A 27.41 8.30 0.05 (14) 1.00 2.69 0.00 (13) 0.03 (11) -0.03 (13) 0.86 0.25 (11) 2.69 NFB Balanced FoF A 27.31 7.77 0.05 (13) 0.96 1.98 0.00 (14) 0.17 ( 5) -0.16 (20) 0.14 1.84 ( 3) 1.88 Average 27.21 8.20 0.05 1.00 2.38 0.00 0.00 0.00 0.34 -0.06 2.05 Dynamic Wealth Accumulator FoF A 26.57 9.38 0.04 (16) 1.16 2.45 -0.03 (16) -0.06 (17) 0.03 (11) 0.79 -0.56 (16) 2.11 VPFP CPI Plus 4 FoF A 26.37 5.32 0.06 (11) 0.61 3.79 0.01 (11) 0.15 ( 7) -0.14 (18) 0.27 1.43 ( 6) 2.19 STANLIB MMMed EquityFoF A 26.19 7.42 0.04 (15) 0.93 1.13 -0.02 (15) -0.09 (18) 0.07 (10) 0.19 -2.01 (22) 0.98 Kruger Balanced FoF A 25.70 8.10 0.04 (17) 1.00 1.78 -0.04 (17) -0.12 (20) 0.09 ( 7) 0.38 -1.45 (20) 1.76 STANLIB Moderate FoF A 25.52 9.92 0.03 (18) 1.20 3.51 -0.05 (18) 0.26 ( 2) -0.31 (24) 0.08 1.80 ( 4) 3.00 Analytics Moderate FoF A 24.88 8.70 0.03 (19) 1.09 1.70 -0.06 (20) -0.15 (22) 0.09 ( 6) 0.31 -2.01 (21) 1.54 Four Plus Growth FoF A 24.75 7.80 0.03 (20) 0.96 1.97 -0.05 (19) 0.26 ( 1) -0.32 (25) 0.00 3.25 ( 1) 1.69 Glacier FS Moderate FoF 23.57 8.73 0.02 (21) 1.09 1.79 -0.09 (22) 0.00 (13) -0.09 (17) 0.34 -0.01 (13) 1.62 Platinum Balanced Pru FoF 23.47 7.03 0.01 (22) 0.82 3.05 -0.07 (21) 0.16 ( 6) -0.23 (23) 0.13 1.24 ( 7) 2.63 APS Moderate FoF A 23.24 8.70 0.01 (23) 1.08 1.96 -0.10 (23) -0.05 (16) -0.04 (16) 0.69 -0.59 (17) 1.85 Bastion Moderate FoF A 20.64 8.13 -0.01 (24) 1.01 1.79 -0.15 (24) -0.12 (19) -0.03 (15) 0.75 -1.38 (19) 1.78 Quantum Balanced FoF 11.15 7.37 -0.12 (25) 0.86 3.21 -0.37 (25) -0.14 (21) -0.22 (22) 0.19 -1.01 (18) 2.96 Source - Cadiz - Multi-Manager fund diagnostic for 3yr period ending 31 September 2011
  • 16.
    Summary Performance Analysisof the AA Prudential Low Category:Last 36 months (October-2008 to September-2011) Absolute Measures Relative Manager Measures Performance Analysis for last 36 Months Measures Funds Return Ann. Sharpe Beta Ann. Abnormal Reward Selection Source - Cadiz - Multi-Manager fund diagnostic for 3yr period ending 31 September 2011 for Total Ratio Tracking Return Selection Timing P- Skill Ann. Period Risk Error Value Aggression AA Prudential Low category – (Rank) (Rank) (Rank) (Rank) (Rank) Southern Charter Defensive FoF 32.83 4.70 0.16 ( 1) 1.05 2.13 0.18 ( 1) -0.18 (33) 0.36 ( 2) 0.00 -2.09 (32) 1.82 FG Venus Cautious FoF A 32.40 5.34 0.14 ( 3) 1.20 2.45 0.16 ( 2) -0.01 (22) 0.17 ( 8) 0.19 -0.09 (21) 2.27 SMMI Defensive FoF A 31.41 5.22 0.13 ( 4) 1.19 2.23 0.14 ( 3) 0.22 ( 8) -0.08 (26) 0.53 2.19 ( 7) 2.07 Metropolitan OdysseyCons FoF 31.15 4.20 0.15 ( 2) 0.98 1.44 0.14 ( 4) -0.07 (29) 0.22 ( 6) 0.01 -1.21 (30) 1.28 STANLIB Conservative FoF A 29.59 4.85 0.11 ( 8) 1.04 2.48 0.11 ( 5) 0.34 ( 2) -0.23 (38) 0.10 2.94 ( 4) 2.37 NFB Cautious FoF A 29.23 3.96 0.12 ( 5) 0.91 1.53 0.10 ( 6) 0.29 ( 5) -0.18 (37) 0.03 4.32 ( 1) 1.38 GFAStable FoF 28.97 3.90 0.12 ( 7) 0.91 1.46 0.10 ( 8) -0.02 (24) 0.12 (13) 0.13 -0.37 (23) 1.36 VPFP CPI Plus 2 FoF A 28.79 3.69 0.12 ( 6) 0.77 2.19 0.10 ( 7) 0.23 ( 6) -0.13 (33) 0.25 2.46 ( 6) 1.95 ABSAManaged CPI + 3% FoF A 28.60 4.82 0.09 (12) 1.11 1.91 0.08 (10) 0.04 (18) 0.04 (16) 0.70 0.48 (17) 1.85 Third Circle Defensive FoF 28.31 4.47 0.10 (10) 0.92 2.51 0.09 ( 9) -0.26 (40) 0.35 ( 3) 0.01 -2.43 (36) 2.24 STANLIB Mod ConservFoF A 28.06 7.91 0.06 (17) 1.81 4.53 0.06 (13) 0.30 ( 3) -0.24 (39) 0.18 2.05 ( 8) 3.04 Kruger Prudential FoF A 27.79 4.35 0.09 (13) 0.99 1.78 0.07 (11) 0.07 (15) 0.00 (21) 0.98 0.77 (13) 1.78 Momentum Consolidator FoF 27.51 5.79 0.07 (15) 1.36 2.47 0.05 (15) 0.04 (17) 0.01 (19) 0.94 0.48 (18) 1.96 Celtis Conservative FoF A 27.15 4.19 0.08 (14) 1.00 1.22 0.06 (14) -0.11 (31) 0.17 ( 9) 0.01 -2.15 (34) 1.11 Stringfellow Stable FoF 26.92 7.52 0.05 (24) 1.82 3.76 0.03 (19) 0.14 (12) -0.11 (31) 0.27 1.71 (12) 1.74 Dynamic Wealth Preserver FoF A 26.87 6.99 0.05 (23) 1.69 3.26 0.03 (18) 0.05 (16) -0.02 (22) 0.88 0.58 (16) 1.69 AmityConserver FoF 26.80 3.16 0.10 (11) 0.48 3.24 0.07 (12) 0.22 ( 7) -0.16 (36) 0.27 1.90 ( 9) 2.43 ABSAManaged CPI + 4% FoF A 26.58 6.17 0.05 (22) 1.40 3.04 0.03 (17) 0.08 (13) -0.04 (23) 0.78 0.61 (15) 2.61 Financial Alliance Infl+3% FoF 26.55 5.94 0.05 (20) 1.42 2.36 0.03 (20) 0.19 (10) -0.16 (35) 0.08 2.56 ( 5) 1.51 AS Forum Cautious FoF 26.09 4.44 0.06 (18) 1.06 1.35 0.03 (21) -0.19 (34) 0.22 ( 5) 0.00 -3.48 (40) 1.15 STANLIB MMLow EquityFoF A 25.95 4.05 0.06 (16) 1.00 0.55 0.03 (22) 0.00 (21) 0.03 (17) 0.31 -0.16 (22) 0.54 Noble PP Strategic Income FoF A 25.69 2.02 0.10 ( 9) 0.35 2.96 0.04 (16) -0.04 (27) 0.09 (15) 0.26 -0.68 (27) 1.35 4i Stable FoF 25.56 5.10 0.04 (26) 1.20 1.88 0.01 (26) -0.35 (41) 0.37 ( 1) 0.00 -5.72 (42) 1.28 Select Manager Cautious Managed FoF 25.53 3.63 0.06 (19) 0.79 1.99 0.03 (23) -0.20 (36) 0.22 ( 4) 0.02 -2.48 (37) 1.66 Skyblue Kimberlite Cautious FoF 25.26 3.79 0.05 (25) 0.78 2.28 0.02 (25) 0.07 (14) -0.05 (24) 0.67 0.73 (14) 2.09 ABSACautious FoF A 25.14 3.28 0.05 (21) 0.55 3.03 0.03 (24) 0.35 ( 1) -0.33 (42) 0.02 3.25 ( 3) 2.25 Average 25.06 4.57 0.04 1.02 2.27 0.01 0.00 0.00 0.30 -0.14 1.81 Platinum Income Provider FoF 24.49 2.72 0.04 (27) 0.53 2.54 0.01 (27) 0.15 (11) -0.13 (34) 0.16 1.87 (10) 1.61 S-BRO Defensive FoF A 24.42 3.66 0.03 (28) 0.86 1.31 0.00 (28) -0.11 (30) 0.11 (14) 0.08 -2.14 (33) 1.11 STANLIB Balanced Trustees FoF A 23.79 4.08 0.02 (29) 0.98 1.06 -0.02 (29) -0.04 (26) 0.02 (18) 0.69 -0.86 (28) 1.05 NeFG Income Provider FoF 23.34 4.59 0.01 (30) 1.02 2.07 -0.03 (31) 0.29 ( 4) -0.32 (41) 0.00 3.30 ( 2) 1.82 Oasis Balanced Stable FoF 22.69 7.20 0.01 (31) 1.72 3.58 -0.06 (33) 0.03 (20) -0.09 (28) 0.41 0.33 (20) 1.95 MitonOptimal IP Diversified Income FoF 22.66 1.68 -0.02 (35) 0.26 3.27 -0.02 (30) -0.02 (23) 0.00 (20) 0.96 -0.40 (24) 1.19
  • 17.
    A 36-month Risk-Returnplot of the Prudential L,M,H categories MULTI-MANAGERS (October-2008 Risk September-2011) Average to 40 Southern Charter Growth FoF 1 35 Southern Charter Balanced FoF Southern Charter Defensive FoF 3 2 6 5 4 7 8 30 11 10 9 12 13 14 16 15 21 17 24 22 23 18 19 20 Average Return 25 27 28 26 33 30 36 34 32 31 29 35 41 39 37 40 38 42 43 44 45 25 49 4648 51 50 47 52 54 53 55 56 Return 57 60 59 58 61 63 62 64 65 67 66 68 69 20 70 71 72 73 74 15 75 76 77 10 5 0 2 4 6 8 10 12 14 Risk Source Cadiz
  • 18.
    Winner of theGrowling Bear Award* for the top performing funds in the worst market ever! {*If there was such an award Southern Charter would win it hands down! For the following categories} Top Performing funds - In prudential high, medium, low and variable categories over 3yrs ending Sep 2011 Top performing - risk profiled prudential funds Top performing - asset allocation prudential funds Top performing - lifecycle retirement prudential funds Top performing - Multi-manager on a risk adjusted basis Top performing - Multi-manager, white label multi-manager
  • 19.
    Our Well Diversified AssetAllocation Investment Stategy Delivers More Certainty in an Uncertain World Mark Thompson Southern Charter.Com
  • 20.
    Our Target Market Ideallysuited for investors who do not wish, nor have the inclination, to manage their own asset allocation and fund manager selection on an ongoing basis.
  • 21.