Download to read offline

![REAL ESTATE MARKET REPORT
SOUTHEAST MONTGOMERY COUNTY
Monday, June 4, 2012 Jim Slack and Kendra Lee
Broker: Prudential Gary Greene Realtors
info@therealtynation.com
832.304.3279
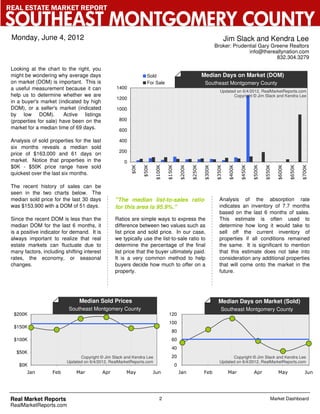
ABSORPTION RATE
MARKET SUMMARY TABLE 78 PENDING [2] 91 OFF-MARKET (last 6 mos) [3] (months of inventory)
A = Average Value
M = Median Value
N/A = Not Available
244 ACTIVE [1] 189 SOLD/CLOSED (last 6 months) [4]
Price Range Days Current Days Original Final Sold/ List-
Num Num Pend Num Num Est.
on List on List List Closed Sale
Low High # # Ratio # # Mos.
Market Price Market Price Price Price Ratio
A 79 $ 34,837 A 55 $ 42,647 $ 38,781 $ 35,145 91%
$0 $49,999 10 3 23% 4 19 3.2
M 60 $ 38,500 M 34 $ 39,900 $ 39,900 $ 35,425 89%
A 120 $ 82,376 A 70 $ 84,972 $ 77,755 $ 74,505 96%
$50,000 $99,999 29 15 34% 11 29 6
M 90 $ 82,900 M 71 $ 82,000 $ 77,900 $ 74,500 96%
A 115 $ 126,582 A 73 $ 135,308 $ 131,392 $ 125,086 95%
$100,000 $149,999 41 12 23% 18 32 7.7
M 90 $ 125,000 M 39 $ 134,800 $ 129,800 $ 125,000 96%
A 87 $ 176,348 A 127 $ 191,547 $ 181,429 $ 175,460 97%
$150,000 $199,999 48 15 24% 20 45 6.4
M 59 $ 176,220 M 99 $ 189,700 $ 185,362 $ 177,900 96%
A 72 $ 225,826 A 82 $ 245,224 $ 236,453 $ 223,930 95%
$200,000 $249,999 38 11 22% 16 30 7.6
M 57 $ 225,475 M 52 $ 239,381 $ 236,881 $ 226,250 96%
A 106 $ 275,344 A 156 $ 314,093 $ 289,096 $ 274,563 95%
$250,000 $299,999 33 10 23% 8 17 11.6
M 67 $ 279,000 M 52 $ 299,900 $ 270,237 $ 267,000 99%
A 113 $ 329,154 A 85 $ 358,735 $ 327,579 $ 314,556 96%
$300,000 $349,999 14 7 33% 3 9 9.3
M 51 $ 334,000 M 57 $ 364,900 $ 315,000 $ 310,000 98%
A 91 $ 380,616 A 61 $ 404,046 $ 404,046 $ 381,600 94%
$350,000 $399,999 10 0 3 5 12
M 79 $ 381,250 M 33 $ 399,000 $ 399,000 $ 389,000 97%
A 88 $ 431,389 A 87 $ 439,500 $ 437,000 $ 428,000 98%
$400,000 $449,999 9 1 10% 2 2 27
M 66 $ 429,900 M 87 $ 439,500 $ 437,000 $ 428,000 98%
A 196 $ 487,098 A 1257 $ 524,900 $ 524,900 $ 490,900 94%
$450,000 $499,999 4 2 33% 4 1 24
M 105 $ 489,450 M 1257 $ 524,900 $ 524,900 $ 490,900 94%
A 187 $ 525,000
$500,000 $549,999 2 1 33% 1 0
M 187 $ 525,000
$550,000 $599,999 0 1 N/A 0 0
A 51 $ 607,500
$600,000 $649,999 2 0 0 0
M 51 $ 607,500
A 897 $ 674,900
$650,000 $699,999 1 0 0 0
M 897 $ 674,900
A 336 $ 1,236,967
$700,000 + 3 0 1 0
M 129 $ 950,900
Market Totals 244 78 24% 91 189 7.7
Market Averages 106 $ 225,228 99 $ 188,217 $ 178,498 $ 170,361 95%
Market Medians 69 $ 196,245 61 $ 179,900 $ 169,900 $ 163,000 96%
Date Range (Off-Market & Sold) = 12/05/2011 to 06/04/2012
Favors Sellers Favors Buyers
Data believed to be accurate but not guaranteed.
Status = [1] act; [2] op, pend, PSHO; [3] exp; [4] closd
ZipCode = 77365, 77357
PropType = RES
Real Market Reports 3 Market Summary Table
RealMarketReports.com](https://image.slidesharecdn.com/tx01001southeastmontgomerycounty-120611103556-phpapp01/85/southeast-montgomery_county-4-320.jpg)

The real estate market report summarizes data for Southeast Montgomery County for June 4, 2012. Currently there are 244 properties for sale and 78 pending contracts, yielding a pending ratio of 24.2%. The median list price is $196,245, while properties have typically been on the market for 69 days. Over the past 6 months, 189 properties sold with a median price of $163,000 and time on market of 61 days. The report analyzes data by price ranges and indicates current inventory would take an estimated 7.7 months to sell based on recent sales rates.


