
Recommended
More Related Content
Viewers also liked
Slideshow Soybeans
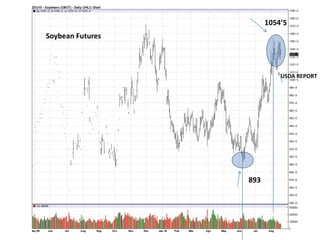
- 1. 1054’5 Soybean Futures USDA REPORT 893
- 2. Soybean Futures 1040 993 979 915
- 4. Seasonal Chart Soybeans What happens next ??
- 6. Soybeans 2010 What happens next ??
Editor's Notes
- Currently trading in the 1035 1040 range. For 2010, the bottom formed first week of June at about 890. Bottom formed first week of August at 1054 and 5/8 or about 1055.*Blue line on the seasonal chart is 40 year seasonally index. The red line is 15 years
- Currently trading in the 1035 1040 range. For 2010, the bottom formed first week of June at about 890. Bottom formed first week of August at 1054 and 5/8 or about 1055.*Blue line on the seasonal chart is 40 year seasonally index. The red line is 15 years
- Currently trading in the 1035 1040 range. For 2010, the bottom formed first week of June at about 890. Bottom formed first week of August at 1054 and 5/8 or about 1055.*Blue line on the seasonal chart is 40 year seasonally index. The red line is 15 years**Normally we see a breakdown in the July month going into August
- Currently trading in the 1035 1040 range. For 2010, the bottom formed first week of June at about 890. Bottom formed first week of August at 1054 and 5/8 or about 1055.*Blue line on the seasonal chart is 40 year seasonally index. The red line is 15 years**Normally we see a breakdown in the July month going into August
- Currently trading in the 1035 1040 range. For 2010, the bottom formed first week of June at about 890. Bottom formed first week of August at 1054 and 5/8 or about 1055.*Blue line on the seasonal chart is 40 year seasonally index. The red line is 15 years**Normally we see a breakdown in the July month going into August
- Currently trading in the 1035 1040 range. For 2010, the bottom formed first week of June at about 890. Bottom formed first week of August at 1054 and 5/8 or about 1055.*Blue line on the seasonal chart is 40 year seasonally index. The red line is 15 years