Download to read offline

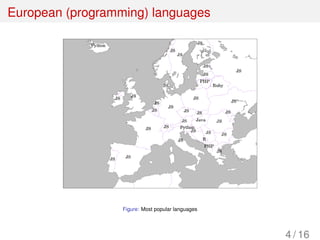
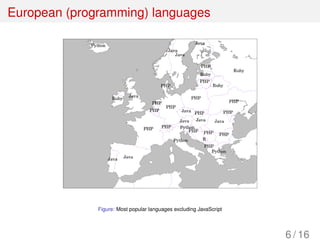

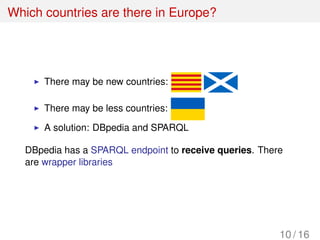
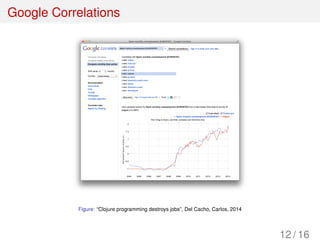
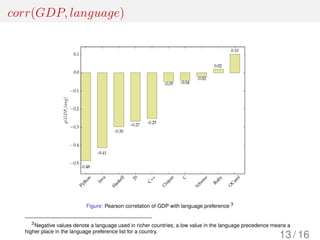
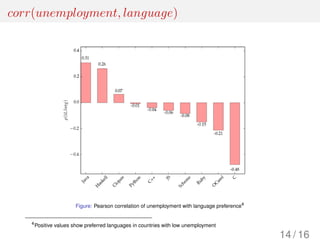
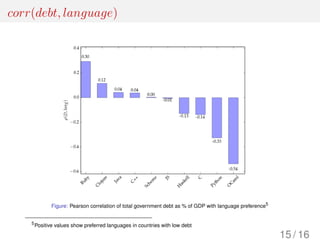

The document discusses analyzing code repositories on GitHub to examine programming language trends across European countries. It summarizes that GitHub data, along with public databases like DBpedia and BigQuery, can be queried through APIs to study the relationship between languages and macroeconomic indicators like GDP, unemployment, and debt. Programming languages are found to correlate with country wealth levels, with richer countries preferring languages like Clojure and poorer countries using languages like PHP and JavaScript more frequently.

![[Databeers] 20150129 “Data Superpowers”. Marco Bressan (BBVA D&A)](https://cdn.slidesharecdn.com/ss_thumbnails/20150129datasuperpowers-150205123751-conversion-gate01-thumbnail.jpg?width=640&height=640&fit=bounds)


![[DevDay2018] Javascript on the Rise - By Trang Tran, Co-founder & Manager at ...](https://cdn.slidesharecdn.com/ss_thumbnails/trangtranjavascriptontheriseapr2018-180424041056-thumbnail.jpg?width=640&height=640&fit=bounds)


![[Databeers] 20150423 “Los datos del banco en la portada del periódico” Mar Ca...](https://cdn.slidesharecdn.com/ss_thumbnails/marcabra-databeers-150430013244-conversion-gate02-thumbnail.jpg?width=640&height=640&fit=bounds)
![[Databeers] 20150423 “Transbordadores, soldados y pasta de dientes”. Javier C...](https://cdn.slidesharecdn.com/ss_thumbnails/javiercanada-databeers-150430013234-conversion-gate01-thumbnail.jpg?width=640&height=640&fit=bounds)
![[Databeers] 20150423 “Llámalo irracional”. Santiago López.](https://cdn.slidesharecdn.com/ss_thumbnails/santiagolopez-databeers-150430013227-conversion-gate02-thumbnail.jpg?width=640&height=640&fit=bounds)
![[Databeers] 20150423 “Se dice el pecado, pero no el pecador”. Borja Adsuara.](https://cdn.slidesharecdn.com/ss_thumbnails/borja-150430013225-conversion-gate01-thumbnail.jpg?width=640&height=640&fit=bounds)
![[Databeers] 20150423 “Datos no convencionales en problemas financieros”. Este...](https://cdn.slidesharecdn.com/ss_thumbnails/esteban-150430013216-conversion-gate02-thumbnail.jpg?width=640&height=640&fit=bounds)
![[Databeers] 20150129 “Desde #urbanData a la generación de servicios. #Running...](https://cdn.slidesharecdn.com/ss_thumbnails/20150129presentaciondatabeersv2-150205123047-conversion-gate01-thumbnail.jpg?width=640&height=640&fit=bounds)
![[Databeers] 20150129 “Datos para entender la realidad de la ayuda”. David Cab...](https://cdn.slidesharecdn.com/ss_thumbnails/ingenio-150205122442-conversion-gate01-thumbnail.jpg?width=640&height=640&fit=bounds)
![[Databeers] 20150129 “Bitcoin: dinero programable” Alberto Gómez (Coinffeine)](https://cdn.slidesharecdn.com/ss_thumbnails/databeers-coinfeine-150205122148-conversion-gate01-thumbnail.jpg?width=640&height=640&fit=bounds)
![[Databeers] 27-11-2014 “Del Control Media al Conversation Media: Analítica en...](https://cdn.slidesharecdn.com/ss_thumbnails/delcontrolmediaalconversationmediadatabeersnov14-150108030209-conversion-gate01-thumbnail.jpg?width=640&height=640&fit=bounds)
![[Databeers] 18-09-2014 Models: pets and herds. Carlos J. Gil Bellosta](https://cdn.slidesharecdn.com/ss_thumbnails/charladatabeers201409-141013102401-conversion-gate01-thumbnail.jpg?width=640&height=640&fit=bounds)
![[Databeers] 18-09-2014 Decide. Pedro Concejero.](https://cdn.slidesharecdn.com/ss_thumbnails/decide-141013102400-conversion-gate02-thumbnail.jpg?width=640&height=640&fit=bounds)
![[Databeers] 18-09-2014 La Geografía de las Redes Sociales Urbanas. Carlos Her...](https://cdn.slidesharecdn.com/ss_thumbnails/urban-networks-databeers-141013102400-conversion-gate01-thumbnail.jpg?width=640&height=640&fit=bounds)
![[Databeers] 18-09-2014 Big data needs artist explorers. Fran Castillo](https://cdn.slidesharecdn.com/ss_thumbnails/francastillodatabeers-141013102357-conversion-gate02-thumbnail.jpg?width=640&height=640&fit=bounds)
![[Databeers] 17/06/2014 - Oscar Corcho: LSD](https://cdn.slidesharecdn.com/ss_thumbnails/databeerslsdoscarcorcho-140626050217-phpapp01-thumbnail.jpg?width=640&height=640&fit=bounds)
![[Databeers] 17/06/2014 - Ignacio Bustillo: “Data Master Chef. Cocinando datos...](https://cdn.slidesharecdn.com/ss_thumbnails/ignaciobustillo-140626045659-phpapp01-thumbnail.jpg?width=640&height=640&fit=bounds)
![[Databeers] 17/06/2014 - Alejandro Llorente: "¿Qué revela Twitter del paro en...](https://cdn.slidesharecdn.com/ss_thumbnails/databeersslides-140626044723-phpapp01-thumbnail.jpg?width=640&height=640&fit=bounds)
![[Databeers] 17/06/2014 - Mar Santamaria Varas+Pablo Martínez : “Data landscapes”](https://cdn.slidesharecdn.com/ss_thumbnails/140617databeers-140626040853-phpapp02-thumbnail.jpg?width=640&height=640&fit=bounds)
![[Databeers] 06/05/2014 - Boris Villazon: “Data Integration - A Linked Data ap...](https://cdn.slidesharecdn.com/ss_thumbnails/ld-databeers-140508020333-phpapp02-thumbnail.jpg?width=640&height=640&fit=bounds)
![[Databeers] 06/05/2014 - Dani Villatoro: “Cicerone: Your venue recommendation...](https://cdn.slidesharecdn.com/ss_thumbnails/databeers-cicerone-140508020214-phpapp02-thumbnail.jpg?width=640&height=640&fit=bounds)


