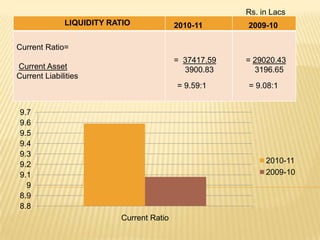
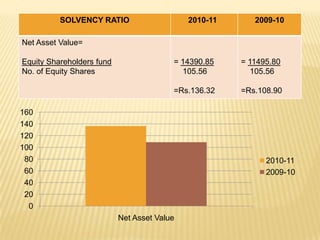
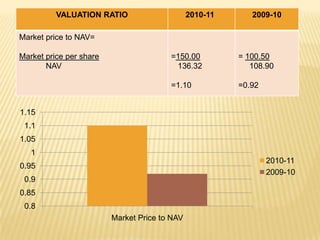
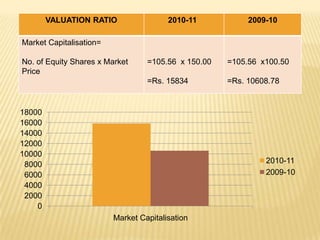
GROUP - 1
ATHIRA MOHAN -121
VINOD AMBOLKAR -122
ARJUN SREENIVASAN -123
DEBASHREE BANERJEE -124
MANISH BALERAO -125
KEVAL BHANUSHALI -126
ASHWINI CHOUDHARI -127
SHARON
                BIO-MEDICINE LTD
   Sharon Bio-Medicine Limited , Incorporated in 1989.

   It is mainly involved in manufacturing of Intermediates, Active
    Pharmaceutical Ingredients and Finished Dosage Forms.

   Growing at around 50% year on year Sharon now has an annual
    turnover of over $100 million.

   Recently started an Animal Toxicology Lab Operating as per GLP
    requirements.
KEY MEMBERS

   Mrs. Savita Gowda -MANAGING DIRECTOR.

   Mr. Mohan P. Kala -NON EXECUTIVE DIRECTOR.

   Mr. Lalit Misra – WHOLE TIME DIRECTOR.
Rs. in Lacs
              LIQUIDITY RATIO             2010-11      2009-10

Current Ratio=
                                          = 37417.59   = 29020.43
Current Asset                               3900.83      3196.65
Current Liabilities
                                          = 9.59:1     = 9.08:1


 9.7
 9.6
 9.5
 9.4
 9.3
 9.2                                                        2010-11
 9.1                                                        2009-10
   9
 8.9
 8.8
                          Current Ratio
LIQUIDITY RATIO                    2010-11      2009-10


Quick Ratio=

Current Assets – Stock - Prepaid          = 21896.22    = 17353.82
expenses                                    3900.83        3196.65
    Current Liabilities - Bank OD
                                          = 5.61:1      = 5.43:1

10
 9
 8
 7
 6
 5                                                             2010-11
 4                                                             2009-10
 3
 2
 1
 0
                            Quick Ratio
LIQUIDITY RATIO                   2010-11              2009-10

Debtors Turnover Ratio=

Sundry Debtors+ Bills Receivable x 365   = 19,253.50 x 365   = 15,877.20 x
       Credit sales                        60,604.66         365
                                                               49,649.88
                                         = 115.96 days
                                                             = 116.72 days
  116.8
  116.6
  116.4
  116.2
                                                                   2010-11
    116
                                                                   2009-10
  115.8
  115.6
  115.4
                          Debto Turn over Ratio
LIQUIDITY RATIO                  2010-11              2009-10

Creditors Turnover Ratio=

Sundry Creditors+Bills Payable x     = 3235.57      x365   = 2630.44 x365
365                                   54,334.88             44,609.28
     Credit purchases
                                     = 21.74 days          = 21.53 days

 21.8
21.75
 21.7
21.65
 21.6                                                              2010-11
21.55                                                              2009-10
 21.5
21.45
 21.4
                      Creditors Turnover Ratio
LIQUIDITY RATIO                  2010-11            2009-10

 Inventory holding period=

     Inventory         x365        = 15,521.37 x 365   = 11,666.61 x 365
 Cost of goods sold                  50,480.12            41,908.60

                                   = 112.23 days       = 101.61 days


114
112
110
108
106
104                                                             2010-11
102                                                             2009-10
100
 98
 96
                      Inventory Holding Period
SOLVENCY RATIO                     2010-11      2009-10

Net Asset Value=

Equity Shareholders fund                 = 14390.85    = 11495.80
No. of Equity Shares                       105.56         105.56

                                         =Rs.136.32    =Rs.108.90

160
140
120
100
 80                                                          2010-11
 60                                                          2009-10
 40
 20
  0
                           Net Asset Value
SOLVENCY RATIO                       2010-11      2009-10

Debt Equity Ratio=

Borrowed Funds                            = 34361.96     = 34256.42
Equity Shareholders fund                    14390.85       11495.80

                                          = 2.39:1       = 2.98:1


3.5
 3
2.5
 2
                                                                2010-11
1.5
                                                                2009-10
 1
0.5
 0
                           Debt Equity Ratio
SOLVENCY RATIO                       2010-11     2009-10

Interest coverage Ratio=

PBT+Financial charges + Non cash          = 7152.43       = 5142.05
charges                                     2680.81         2099.88
                Financial charges
                                          =2.67           =2.45

 2.7
2.65
 2.6
2.55
 2.5                                                          2010-11
2.45                                                          2009-10
 2.4
2.35
 2.3
                      Interest Coverage Ratio
VALUATION RATIO                   2010-11      2009-10

Earning per share=

Net profit before Tax                   = 3,647.22    = 2,402.19
No. of Equity Shares                      1,05.56       1,05.56

                                        = Rs. 34.55   = Rs. 22.75

40
35
30
25
20                                                          2010-11
15                                                          2009-10
10
 5
 0
                        Earning Per Share
VALUATION RATIO                      2010-11      2009-10

Price Earning Ratio=

Market price per share                   = 150           = 100.50
   Earning price                           34.55            22.75

                                         =Rs. 4.34       =Rs. 4.42

4.44
4.42
 4.4
4.38
                                                               2010-11
4.36
                                                               2009-10
4.34
4.32
 4.3
                         Price Earning Ratio
VALUATION RATIO                      2010-11      2009-10

Market price to NAV=

Market price per share                  =150.00          = 100.50
       NAV                               136.32             108.90

                                        =1.10            =0.92


1.15
 1.1
1.05
   1
                                                                 2010-11
0.95
                                                                 2009-10
 0.9
0.85
 0.8
                         Market Price to NAV
VALUATION RATIO                 2010-11           2009-10

Market Capitalisation=

No. of Equity Shares x Market     =105.56 x 150.00   =105.56 x100.50
Price
                                  =Rs. 15834         =Rs. 10608.78


18000
16000
14000
12000
10000
 8000                                                         2010-11
 6000                                                         2009-10
 4000
 2000
    0
                         Market Capitalisation

Sharon ratio.

  • 1.
    GROUP - 1 ATHIRAMOHAN -121 VINOD AMBOLKAR -122 ARJUN SREENIVASAN -123 DEBASHREE BANERJEE -124 MANISH BALERAO -125 KEVAL BHANUSHALI -126 ASHWINI CHOUDHARI -127
  • 2.
    SHARON BIO-MEDICINE LTD  Sharon Bio-Medicine Limited , Incorporated in 1989.  It is mainly involved in manufacturing of Intermediates, Active Pharmaceutical Ingredients and Finished Dosage Forms.  Growing at around 50% year on year Sharon now has an annual turnover of over $100 million.  Recently started an Animal Toxicology Lab Operating as per GLP requirements.
  • 3.
    KEY MEMBERS  Mrs. Savita Gowda -MANAGING DIRECTOR.  Mr. Mohan P. Kala -NON EXECUTIVE DIRECTOR.  Mr. Lalit Misra – WHOLE TIME DIRECTOR.
  • 4.
    Rs. in Lacs LIQUIDITY RATIO 2010-11 2009-10 Current Ratio= = 37417.59 = 29020.43 Current Asset 3900.83 3196.65 Current Liabilities = 9.59:1 = 9.08:1 9.7 9.6 9.5 9.4 9.3 9.2 2010-11 9.1 2009-10 9 8.9 8.8 Current Ratio
  • 5.
    LIQUIDITY RATIO 2010-11 2009-10 Quick Ratio= Current Assets – Stock - Prepaid = 21896.22 = 17353.82 expenses 3900.83 3196.65 Current Liabilities - Bank OD = 5.61:1 = 5.43:1 10 9 8 7 6 5 2010-11 4 2009-10 3 2 1 0 Quick Ratio
  • 6.
    LIQUIDITY RATIO 2010-11 2009-10 Debtors Turnover Ratio= Sundry Debtors+ Bills Receivable x 365 = 19,253.50 x 365 = 15,877.20 x Credit sales 60,604.66 365 49,649.88 = 115.96 days = 116.72 days 116.8 116.6 116.4 116.2 2010-11 116 2009-10 115.8 115.6 115.4 Debto Turn over Ratio
  • 7.
    LIQUIDITY RATIO 2010-11 2009-10 Creditors Turnover Ratio= Sundry Creditors+Bills Payable x = 3235.57 x365 = 2630.44 x365 365 54,334.88 44,609.28 Credit purchases = 21.74 days = 21.53 days 21.8 21.75 21.7 21.65 21.6 2010-11 21.55 2009-10 21.5 21.45 21.4 Creditors Turnover Ratio
  • 8.
    LIQUIDITY RATIO 2010-11 2009-10 Inventory holding period= Inventory x365 = 15,521.37 x 365 = 11,666.61 x 365 Cost of goods sold 50,480.12 41,908.60 = 112.23 days = 101.61 days 114 112 110 108 106 104 2010-11 102 2009-10 100 98 96 Inventory Holding Period
  • 9.
    SOLVENCY RATIO 2010-11 2009-10 Net Asset Value= Equity Shareholders fund = 14390.85 = 11495.80 No. of Equity Shares 105.56 105.56 =Rs.136.32 =Rs.108.90 160 140 120 100 80 2010-11 60 2009-10 40 20 0 Net Asset Value
  • 10.
    SOLVENCY RATIO 2010-11 2009-10 Debt Equity Ratio= Borrowed Funds = 34361.96 = 34256.42 Equity Shareholders fund 14390.85 11495.80 = 2.39:1 = 2.98:1 3.5 3 2.5 2 2010-11 1.5 2009-10 1 0.5 0 Debt Equity Ratio
  • 11.
    SOLVENCY RATIO 2010-11 2009-10 Interest coverage Ratio= PBT+Financial charges + Non cash = 7152.43 = 5142.05 charges 2680.81 2099.88 Financial charges =2.67 =2.45 2.7 2.65 2.6 2.55 2.5 2010-11 2.45 2009-10 2.4 2.35 2.3 Interest Coverage Ratio
  • 12.
    VALUATION RATIO 2010-11 2009-10 Earning per share= Net profit before Tax = 3,647.22 = 2,402.19 No. of Equity Shares 1,05.56 1,05.56 = Rs. 34.55 = Rs. 22.75 40 35 30 25 20 2010-11 15 2009-10 10 5 0 Earning Per Share
  • 13.
    VALUATION RATIO 2010-11 2009-10 Price Earning Ratio= Market price per share = 150 = 100.50 Earning price 34.55 22.75 =Rs. 4.34 =Rs. 4.42 4.44 4.42 4.4 4.38 2010-11 4.36 2009-10 4.34 4.32 4.3 Price Earning Ratio
  • 14.
    VALUATION RATIO 2010-11 2009-10 Market price to NAV= Market price per share =150.00 = 100.50 NAV 136.32 108.90 =1.10 =0.92 1.15 1.1 1.05 1 2010-11 0.95 2009-10 0.9 0.85 0.8 Market Price to NAV
  • 15.
    VALUATION RATIO 2010-11 2009-10 Market Capitalisation= No. of Equity Shares x Market =105.56 x 150.00 =105.56 x100.50 Price =Rs. 15834 =Rs. 10608.78 18000 16000 14000 12000 10000 8000 2010-11 6000 2009-10 4000 2000 0 Market Capitalisation