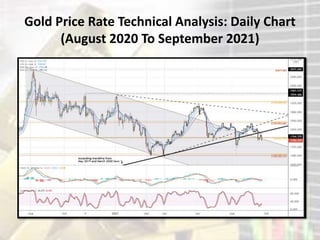
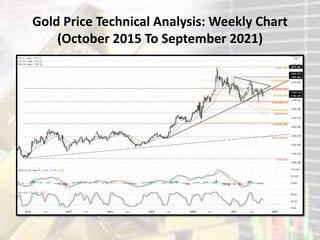
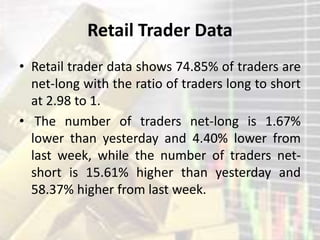
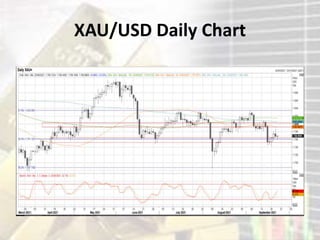
GOLD PRICE OUTLOOK
Points To Be Discussed Today:
• Gold Prices Failed To Retake
• Ugly Price Action Post-FOMC
• Gold Prices Have Unfavorable Fundamental Conditions
• Gold Volatility And Gold Prices’ Abnormal Relationship
• Gold Volatility Trading
• Gold Prices Remain Below Former Support
• XAU/USD Daily & Monthly Chart
Gold Prices Failed To Retake
• Gold prices failed to retake the uptrend from
the May 2019, March 2020, and March 2021
lows, and are nearing their monthly low.
• It remains the case that “selling the rally may
be the modus operandi henceforth.”
• According to the IG Client Sentiment Index,
gold prices surprisingly have a bullish bias in
the near-term.
Ugly Price Action Post-FOMC
• We’ve been ambivalent about rallies in gold
prices for the past several weeks.
• Just two days ago it was noted that “what’s
happening in gold prices is nothing more than a
‘dead cat bounce’…in recent Fed meetings and
moreover, minutes from those Fed meetings.
• Gold prices haven’t fared well as US policymakers
inch ever-closer towards making a stimulus taper
announcement.”
Gold Prices Have Unfavorable
Fundamental Conditions
• Price action in the 48-hours around the
September Fed meeting have vindicated this
apprehension towards the gold price rally that
marked the start of the week.
• Now that the FOMC has offered some more
clarity on its taper timeline and the tension
around China’s Evergrande, the country’s second
largest property developer, is being relieved.
• Gold prices have unfavorable fundamental
conditions in the near-term.
Gold’s Ascent Has Now Become A
Veritable Headwind
• In particular, now that US Treasury yields
are rising, which is translating into higher
US real yields (nominal yields less
inflation).
• One of the key factors that might have
otherwise supported gold’s ascent has
now become a veritable headwind.
Gold Volatility And Gold Prices’
Abnormal Relationship
• Historically, gold prices have a relationship with
volatility unlike other asset classes.
• While other asset classes like bonds and
stocks don’t like increased volatility – signaling
greater uncertainty around cash flows, dividends,
coupon payments, etc. – gold tends to benefit
during periods of higher volatility.
• Falling gold volatility and weak correlations
suggests continued difficult trading may be ahead
for gold prices.
GVZ (Gold Volatility) Technical Analysis: Daily Price
Chart (September 2020 To September 2021)
Gold Volatility Trading
• Gold volatility (as measured by the Cboe’s gold
volatility ETF, GVZ, which tracks the 1-month
implied volatility of gold as derived from the GLD
option chain) was trading at 16.37.
• The relationship between gold prices and gold
volatility remains abnormal.
• The 5-day correlation between GVZ and gold
prices is -0.27 while the 20-day correlation is -
0.71. One week ago, on September 16, the 5-day
correlation was -0.98 and the 20-day correlation
was -0.45.
Gold Price Rate Technical Analysis: Daily Chart
(August 2020 To September 2021)
Gold Prices Remain Below Former
Support
• Earlier this week it was noted that “even though a
rebound has transpired over the past 24-hours.
• Gold prices remain below former support in the
symmetrical triangle that encompassed price
action from January through July.
• And more recently have traded below the
ascending trendline from the May 2019, March
2020, and March 2021 lows.
• Further weakness cannot be ruled out at this
time.”
Gold Prices Remain Below
• Gold prices have since failed at these former
support levels, duly treating them as resistance
after what appeared to be a ‘dead cat bounce.’
• More losses may be on the way given the posture
of momentum indicators.
• Gold prices remain below their daily 5-, 8-, 13-,
and 21-EMA envelope, which is in bearish
sequential order.
• Daily MACD continues to decline while below its
signal line, and daily Slow Stochastics are pushing
back into oversold territory.
Gold Price Technical Analysis: Weekly Chart
(October 2015 To September 2021)
Gold Prices’ Technical Structure
• Gold prices’ technical structure on the weekly
timeframe has not improved by any stretch of the
imagination in the 48-hours around the
September Fed meeting.
• The weekly 4-, 13-, and 26-EMA envelope
continues to slide lower, while weekly MACD is
dropping further below its signal line.
• Weekly Slow Stochastics are accelerating lower
below their median line. It remains the case that
“selling the rally may be the modus operandi
henceforth.”
Gold Client Positioning
Retail Trader Data
• Retail trader data shows 74.85% of traders are
net-long with the ratio of traders long to short
at 2.98 to 1.
• The number of traders net-long is 1.67%
lower than yesterday and 4.40% lower from
last week, while the number of traders net-
short is 15.61% higher than yesterday and
58.37% higher from last week.
Gold Price Trend May Soon Reverse
Higher
• We typically take a contrarian view to crowd
sentiment, and the fact traders are net-long
suggests Gold prices may continue to fall.
• Yet traders are less net-long than yesterday
and compared with last week.
• Recent changes in sentiment warn that the
current Gold price trend may soon reverse
higher despite the fact traders remain net-
long.
XAU/USD Daily Chart
XAU/USD Monthly Chart
GOLD PRICE OUTLOOK
THANKS FOR LISTENING
GOLD PRICE OUTLOOK

September 27 I Session 1 I GBIH

  • 1.
  • 2.
    Points To BeDiscussed Today: • Gold Prices Failed To Retake • Ugly Price Action Post-FOMC • Gold Prices Have Unfavorable Fundamental Conditions • Gold Volatility And Gold Prices’ Abnormal Relationship • Gold Volatility Trading • Gold Prices Remain Below Former Support • XAU/USD Daily & Monthly Chart
  • 3.
    Gold Prices FailedTo Retake • Gold prices failed to retake the uptrend from the May 2019, March 2020, and March 2021 lows, and are nearing their monthly low. • It remains the case that “selling the rally may be the modus operandi henceforth.” • According to the IG Client Sentiment Index, gold prices surprisingly have a bullish bias in the near-term.
  • 4.
    Ugly Price ActionPost-FOMC • We’ve been ambivalent about rallies in gold prices for the past several weeks. • Just two days ago it was noted that “what’s happening in gold prices is nothing more than a ‘dead cat bounce’…in recent Fed meetings and moreover, minutes from those Fed meetings. • Gold prices haven’t fared well as US policymakers inch ever-closer towards making a stimulus taper announcement.”
  • 5.
    Gold Prices HaveUnfavorable Fundamental Conditions • Price action in the 48-hours around the September Fed meeting have vindicated this apprehension towards the gold price rally that marked the start of the week. • Now that the FOMC has offered some more clarity on its taper timeline and the tension around China’s Evergrande, the country’s second largest property developer, is being relieved. • Gold prices have unfavorable fundamental conditions in the near-term.
  • 6.
    Gold’s Ascent HasNow Become A Veritable Headwind • In particular, now that US Treasury yields are rising, which is translating into higher US real yields (nominal yields less inflation). • One of the key factors that might have otherwise supported gold’s ascent has now become a veritable headwind.
  • 7.
    Gold Volatility AndGold Prices’ Abnormal Relationship • Historically, gold prices have a relationship with volatility unlike other asset classes. • While other asset classes like bonds and stocks don’t like increased volatility – signaling greater uncertainty around cash flows, dividends, coupon payments, etc. – gold tends to benefit during periods of higher volatility. • Falling gold volatility and weak correlations suggests continued difficult trading may be ahead for gold prices.
  • 8.
    GVZ (Gold Volatility)Technical Analysis: Daily Price Chart (September 2020 To September 2021)
  • 9.
    Gold Volatility Trading •Gold volatility (as measured by the Cboe’s gold volatility ETF, GVZ, which tracks the 1-month implied volatility of gold as derived from the GLD option chain) was trading at 16.37. • The relationship between gold prices and gold volatility remains abnormal. • The 5-day correlation between GVZ and gold prices is -0.27 while the 20-day correlation is - 0.71. One week ago, on September 16, the 5-day correlation was -0.98 and the 20-day correlation was -0.45.
  • 10.
    Gold Price RateTechnical Analysis: Daily Chart (August 2020 To September 2021)
  • 11.
    Gold Prices RemainBelow Former Support • Earlier this week it was noted that “even though a rebound has transpired over the past 24-hours. • Gold prices remain below former support in the symmetrical triangle that encompassed price action from January through July. • And more recently have traded below the ascending trendline from the May 2019, March 2020, and March 2021 lows. • Further weakness cannot be ruled out at this time.”
  • 12.
    Gold Prices RemainBelow • Gold prices have since failed at these former support levels, duly treating them as resistance after what appeared to be a ‘dead cat bounce.’ • More losses may be on the way given the posture of momentum indicators. • Gold prices remain below their daily 5-, 8-, 13-, and 21-EMA envelope, which is in bearish sequential order. • Daily MACD continues to decline while below its signal line, and daily Slow Stochastics are pushing back into oversold territory.
  • 13.
    Gold Price TechnicalAnalysis: Weekly Chart (October 2015 To September 2021)
  • 14.
    Gold Prices’ TechnicalStructure • Gold prices’ technical structure on the weekly timeframe has not improved by any stretch of the imagination in the 48-hours around the September Fed meeting. • The weekly 4-, 13-, and 26-EMA envelope continues to slide lower, while weekly MACD is dropping further below its signal line. • Weekly Slow Stochastics are accelerating lower below their median line. It remains the case that “selling the rally may be the modus operandi henceforth.”
  • 15.
  • 16.
    Retail Trader Data •Retail trader data shows 74.85% of traders are net-long with the ratio of traders long to short at 2.98 to 1. • The number of traders net-long is 1.67% lower than yesterday and 4.40% lower from last week, while the number of traders net- short is 15.61% higher than yesterday and 58.37% higher from last week.
  • 17.
    Gold Price TrendMay Soon Reverse Higher • We typically take a contrarian view to crowd sentiment, and the fact traders are net-long suggests Gold prices may continue to fall. • Yet traders are less net-long than yesterday and compared with last week. • Recent changes in sentiment warn that the current Gold price trend may soon reverse higher despite the fact traders remain net- long.
  • 18.
  • 19.
  • 20.
  • 21.