Downloaded 404 times


![Expected Return(13 Jan- 07 March)
SI.NO. STOCKS E[R]
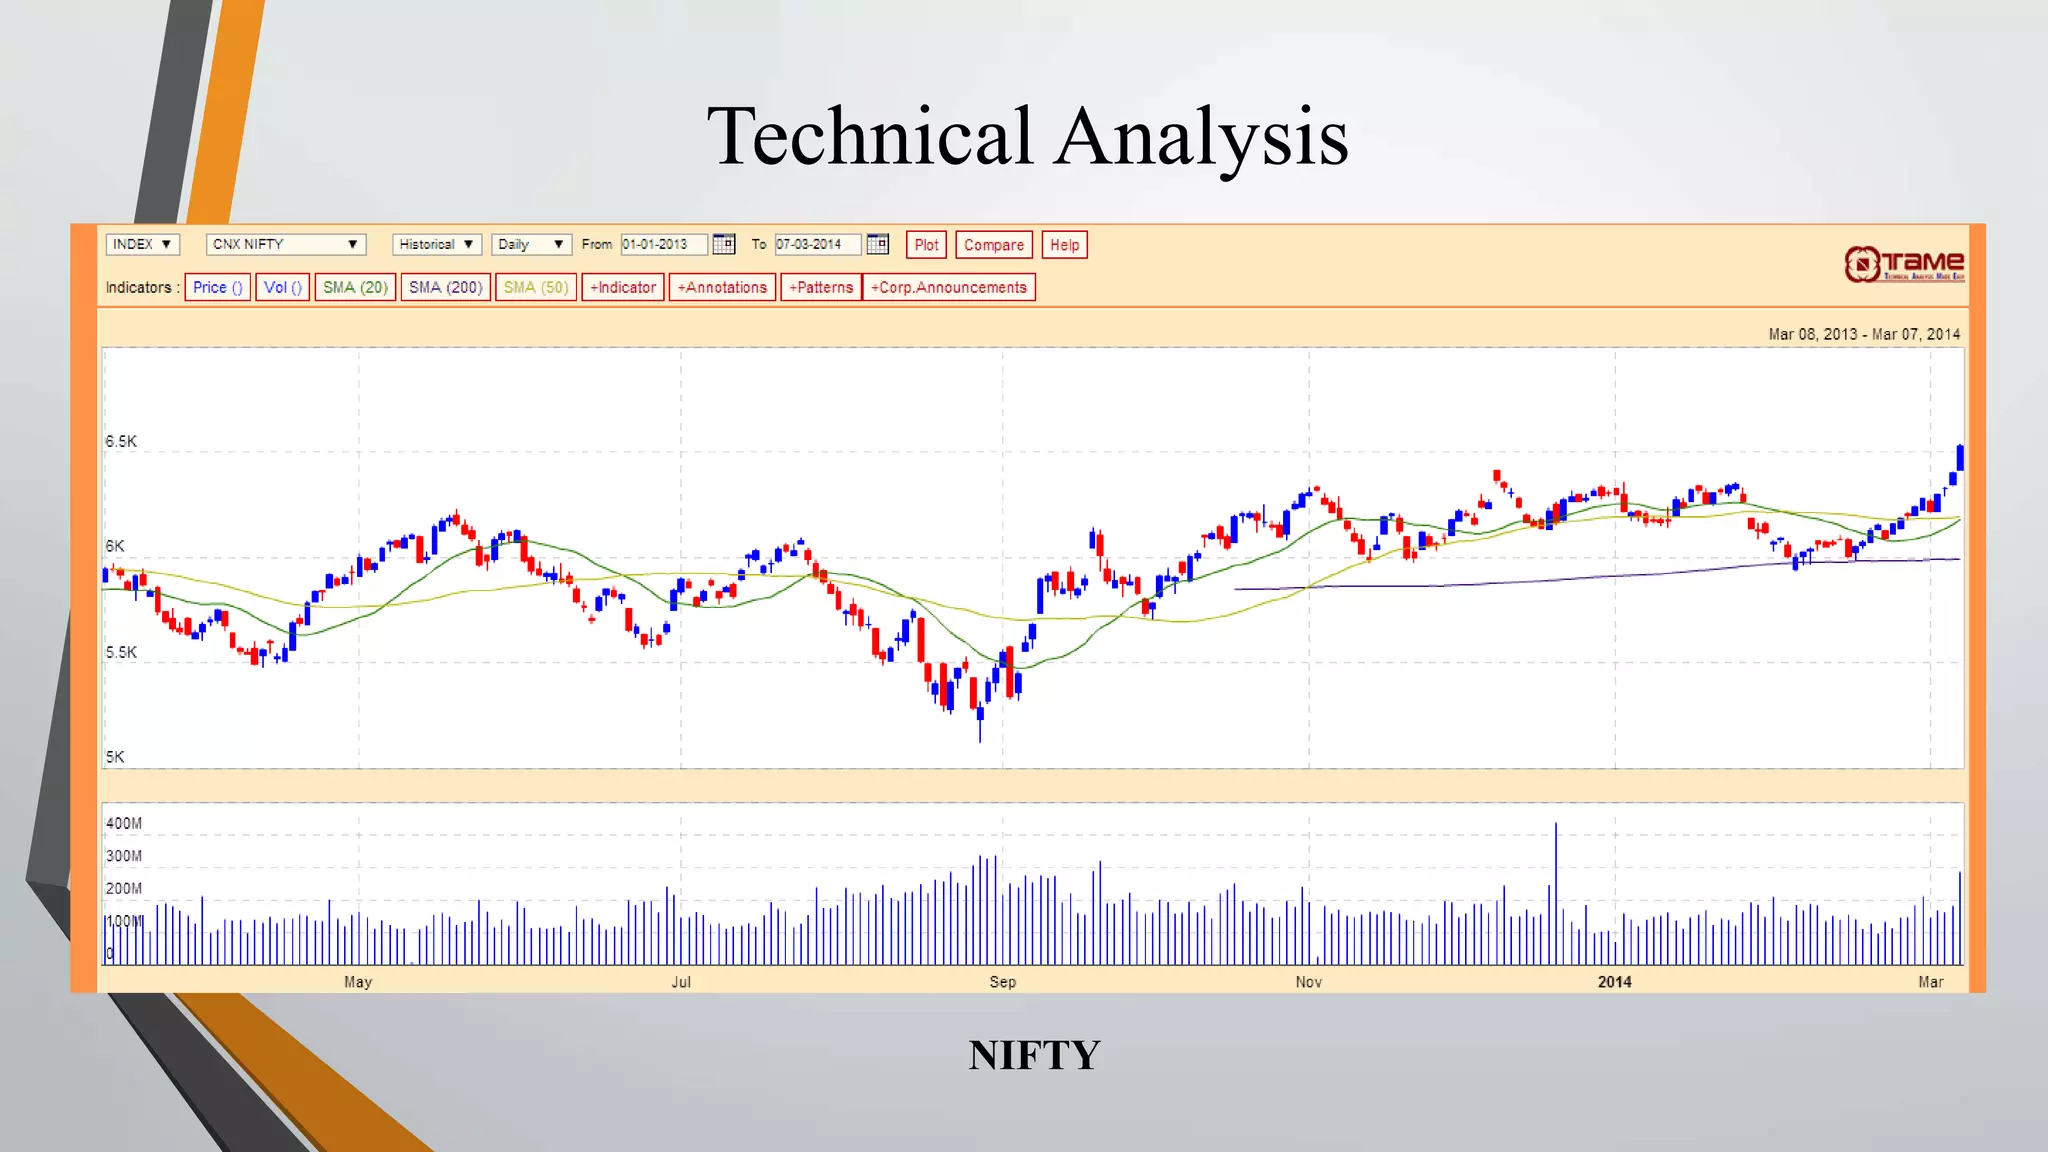
1 NIFTY 0.11%
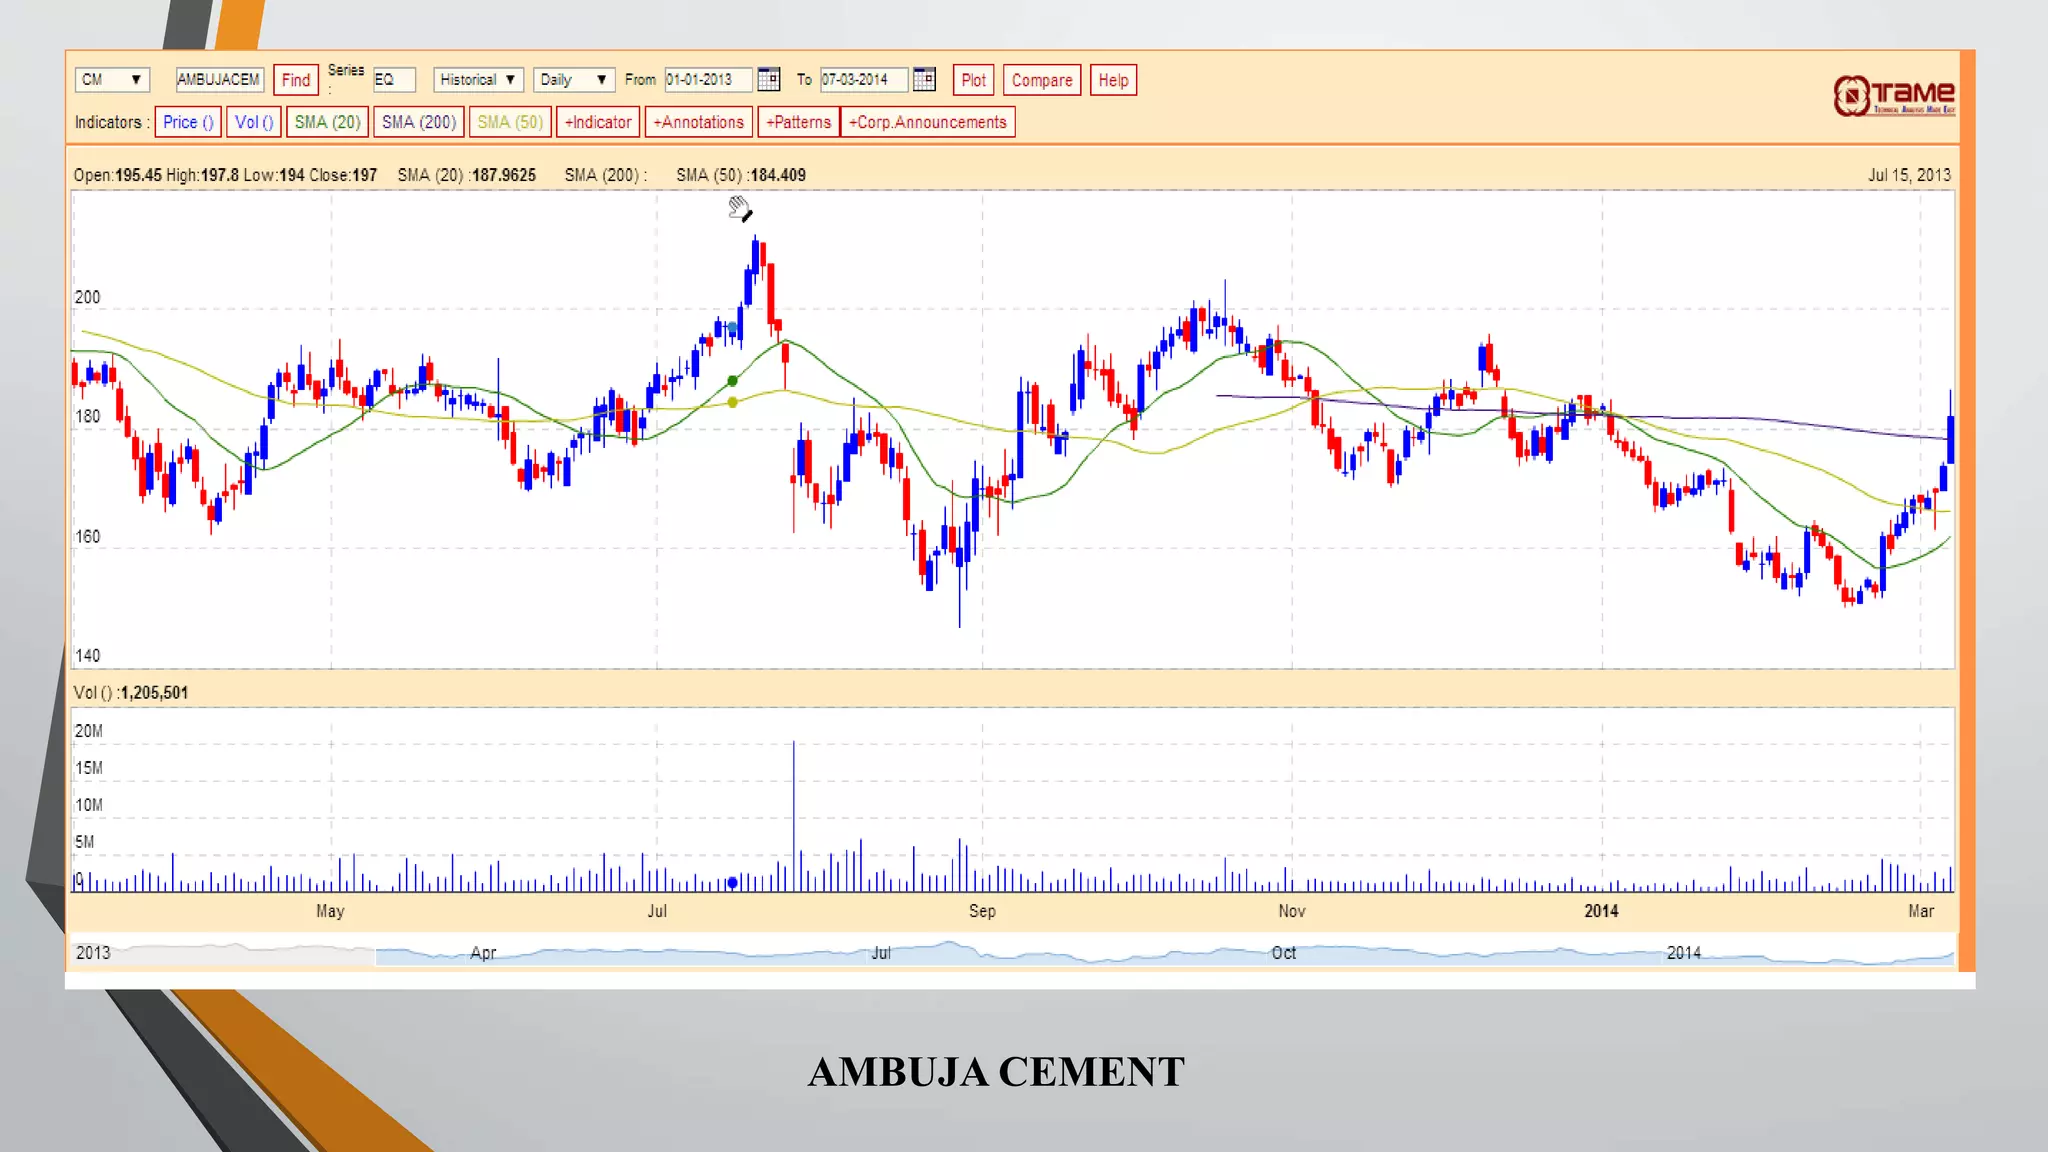
2 AMBUJACEM 0.20%
3 CIPLA -0.13%
4 HEROMOTOCO -0.03%
5 KOTAKBANK -0.01%
6 RANBAXY -0.36%](https://image.slidesharecdn.com/securityanalysisandportfoliomanagement-141217052207-conversion-gate01/75/Security-analysis-and-portfolio-management-15-2048.jpg)

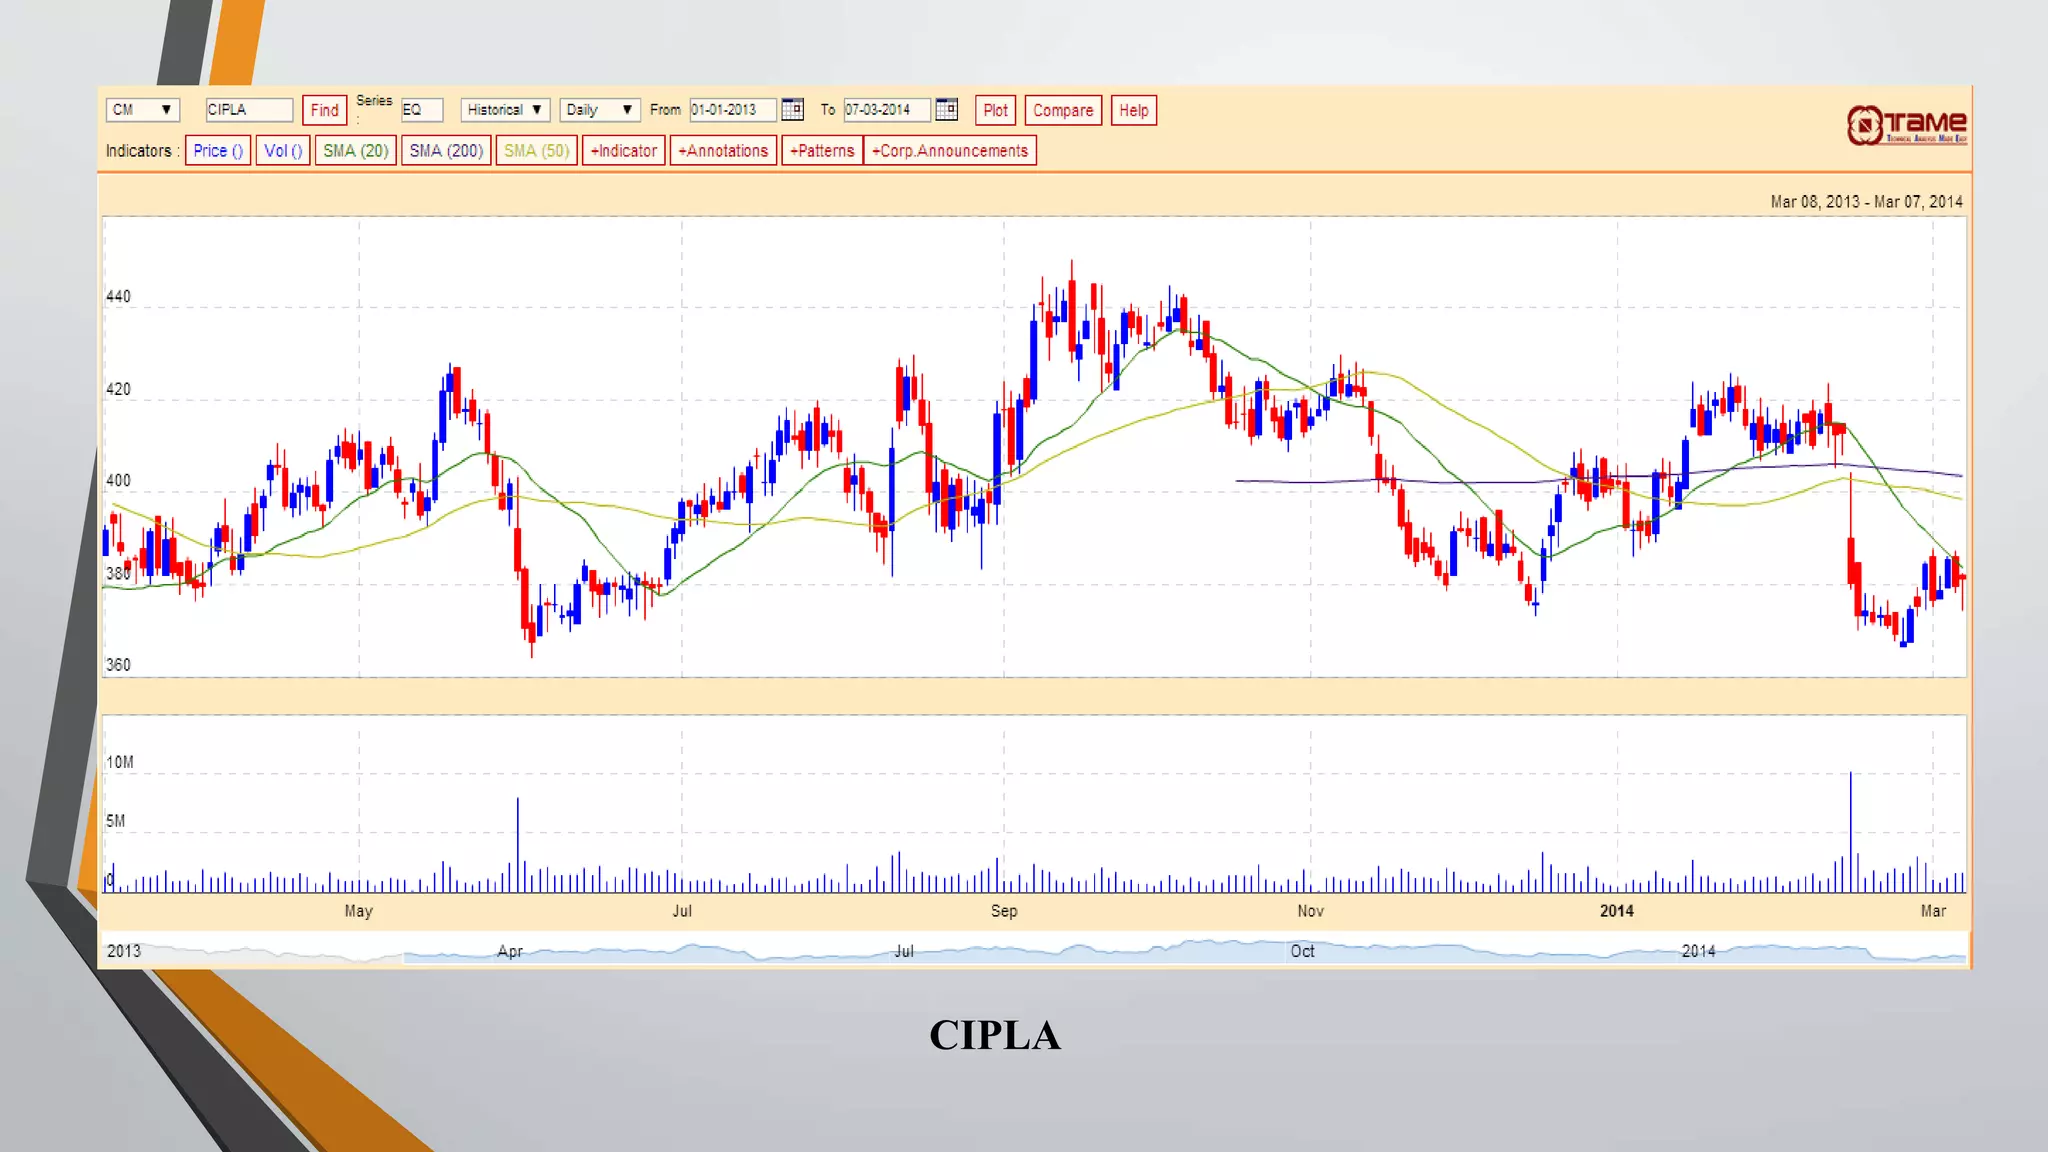
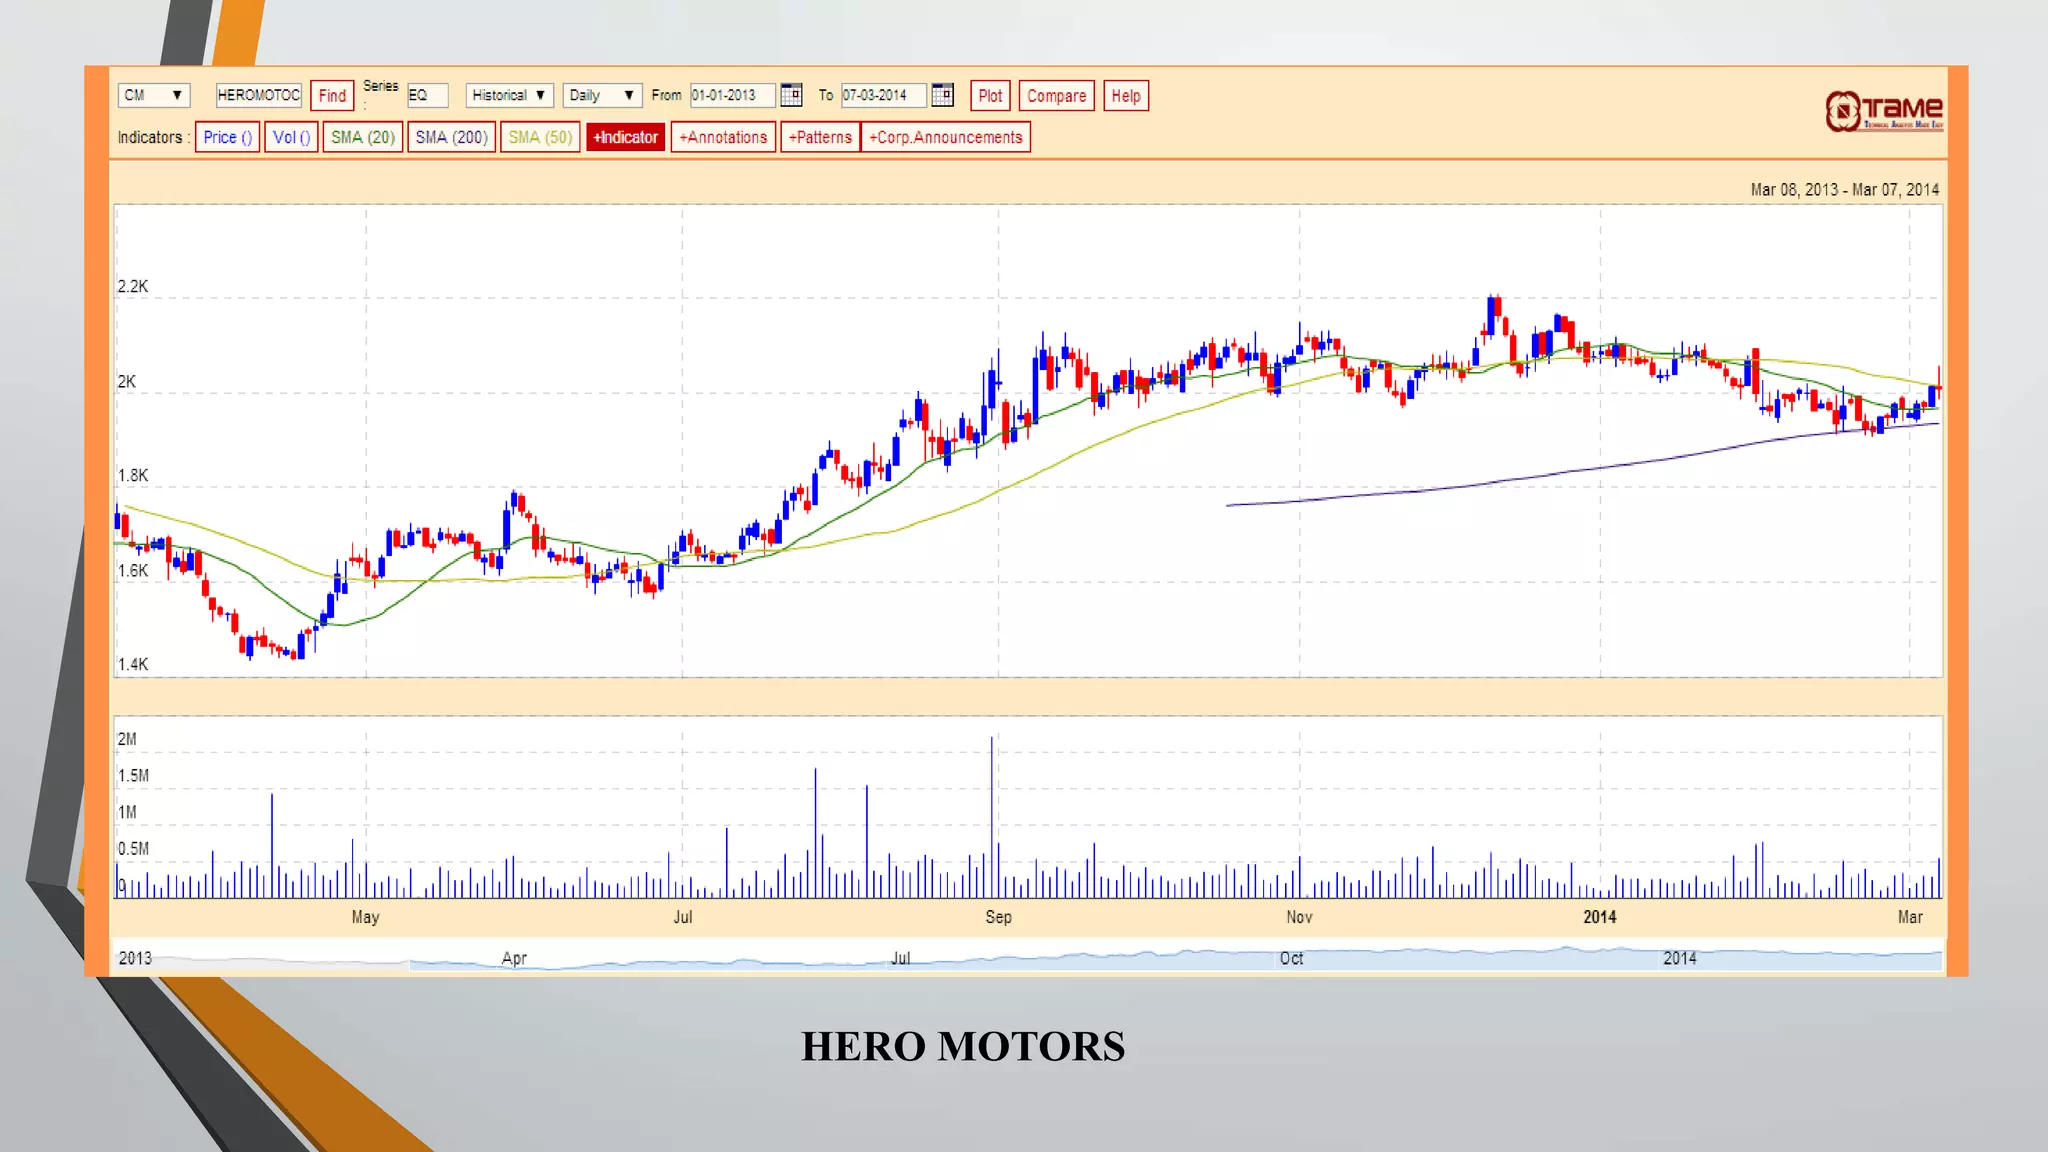
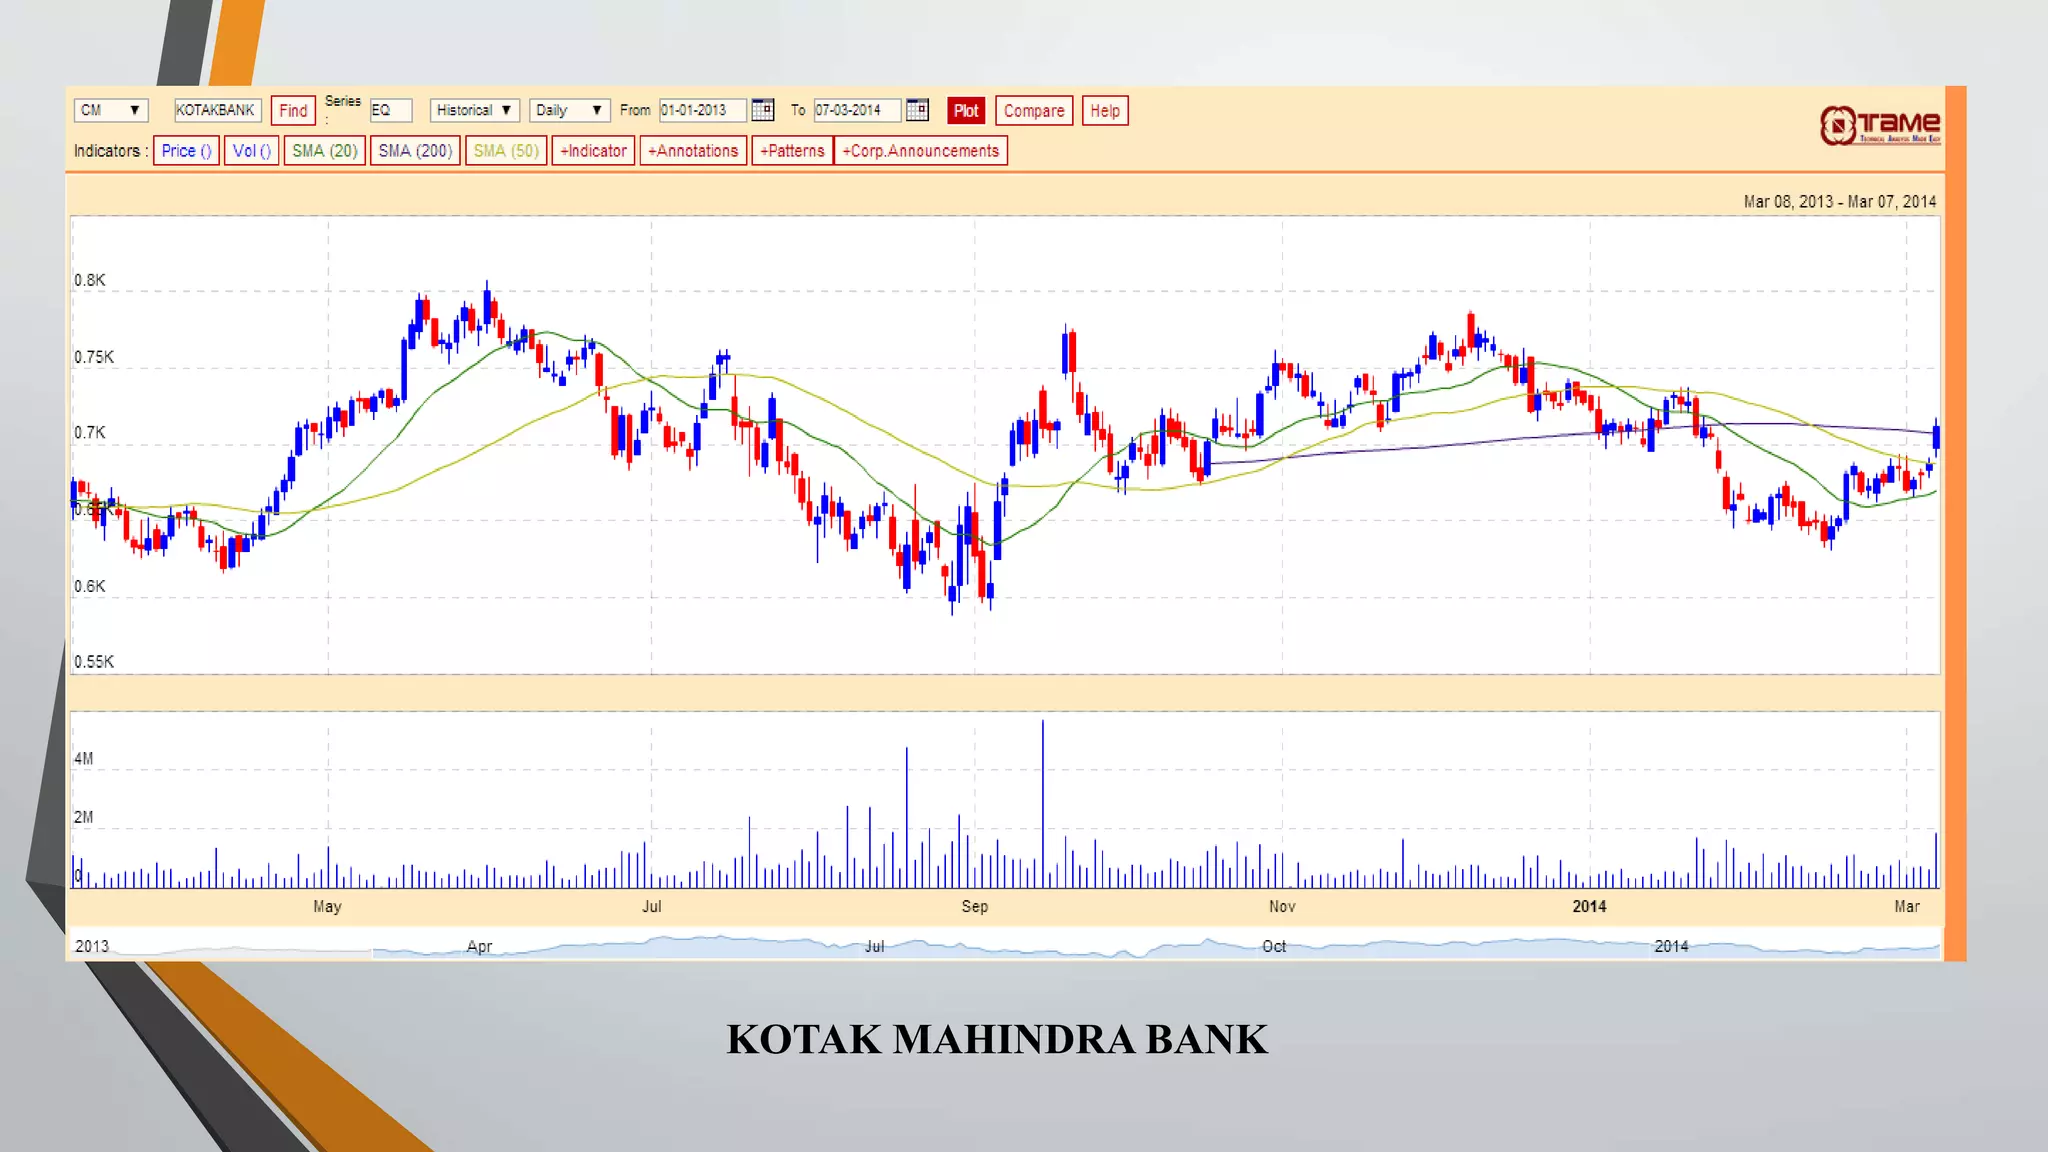
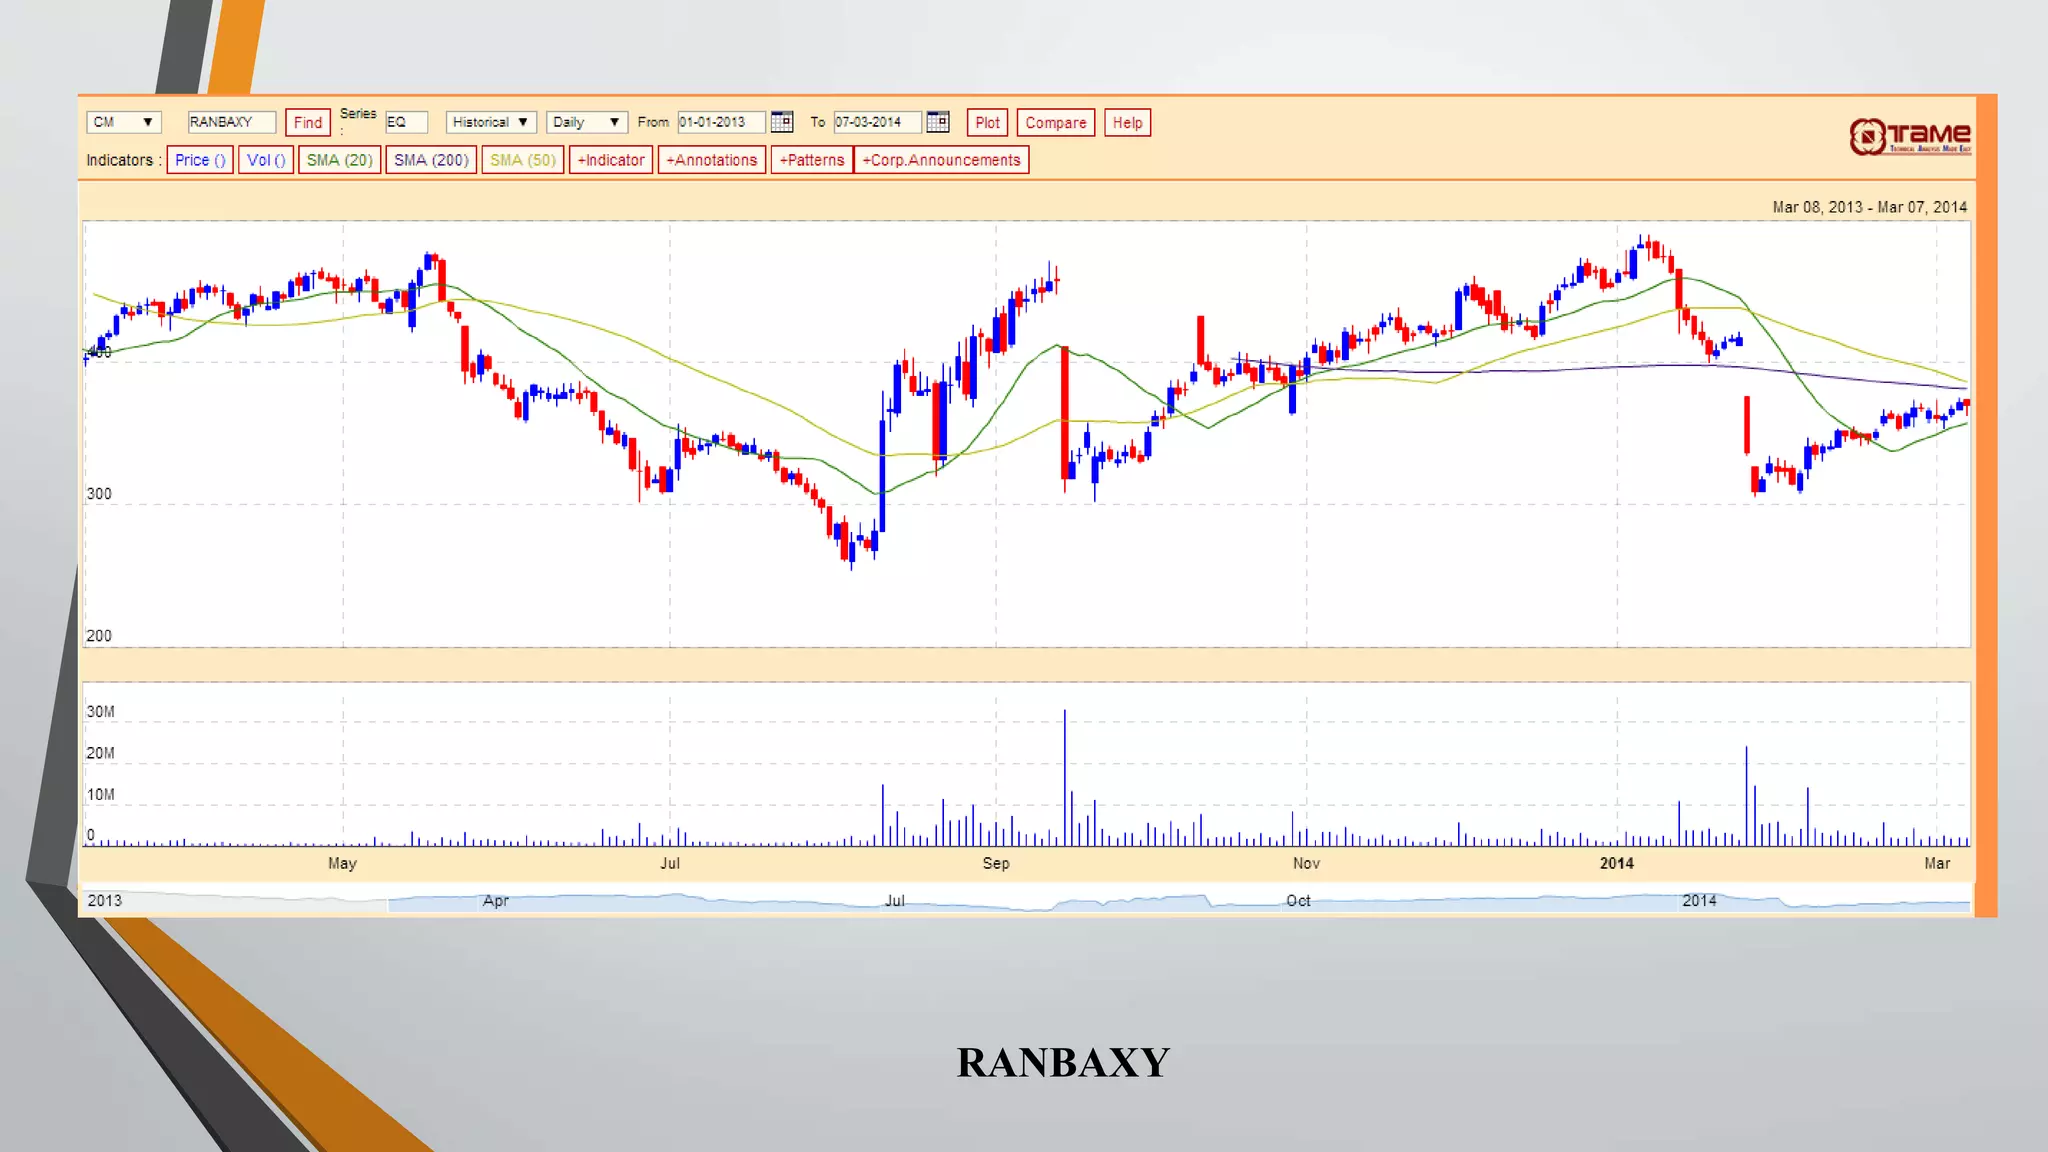


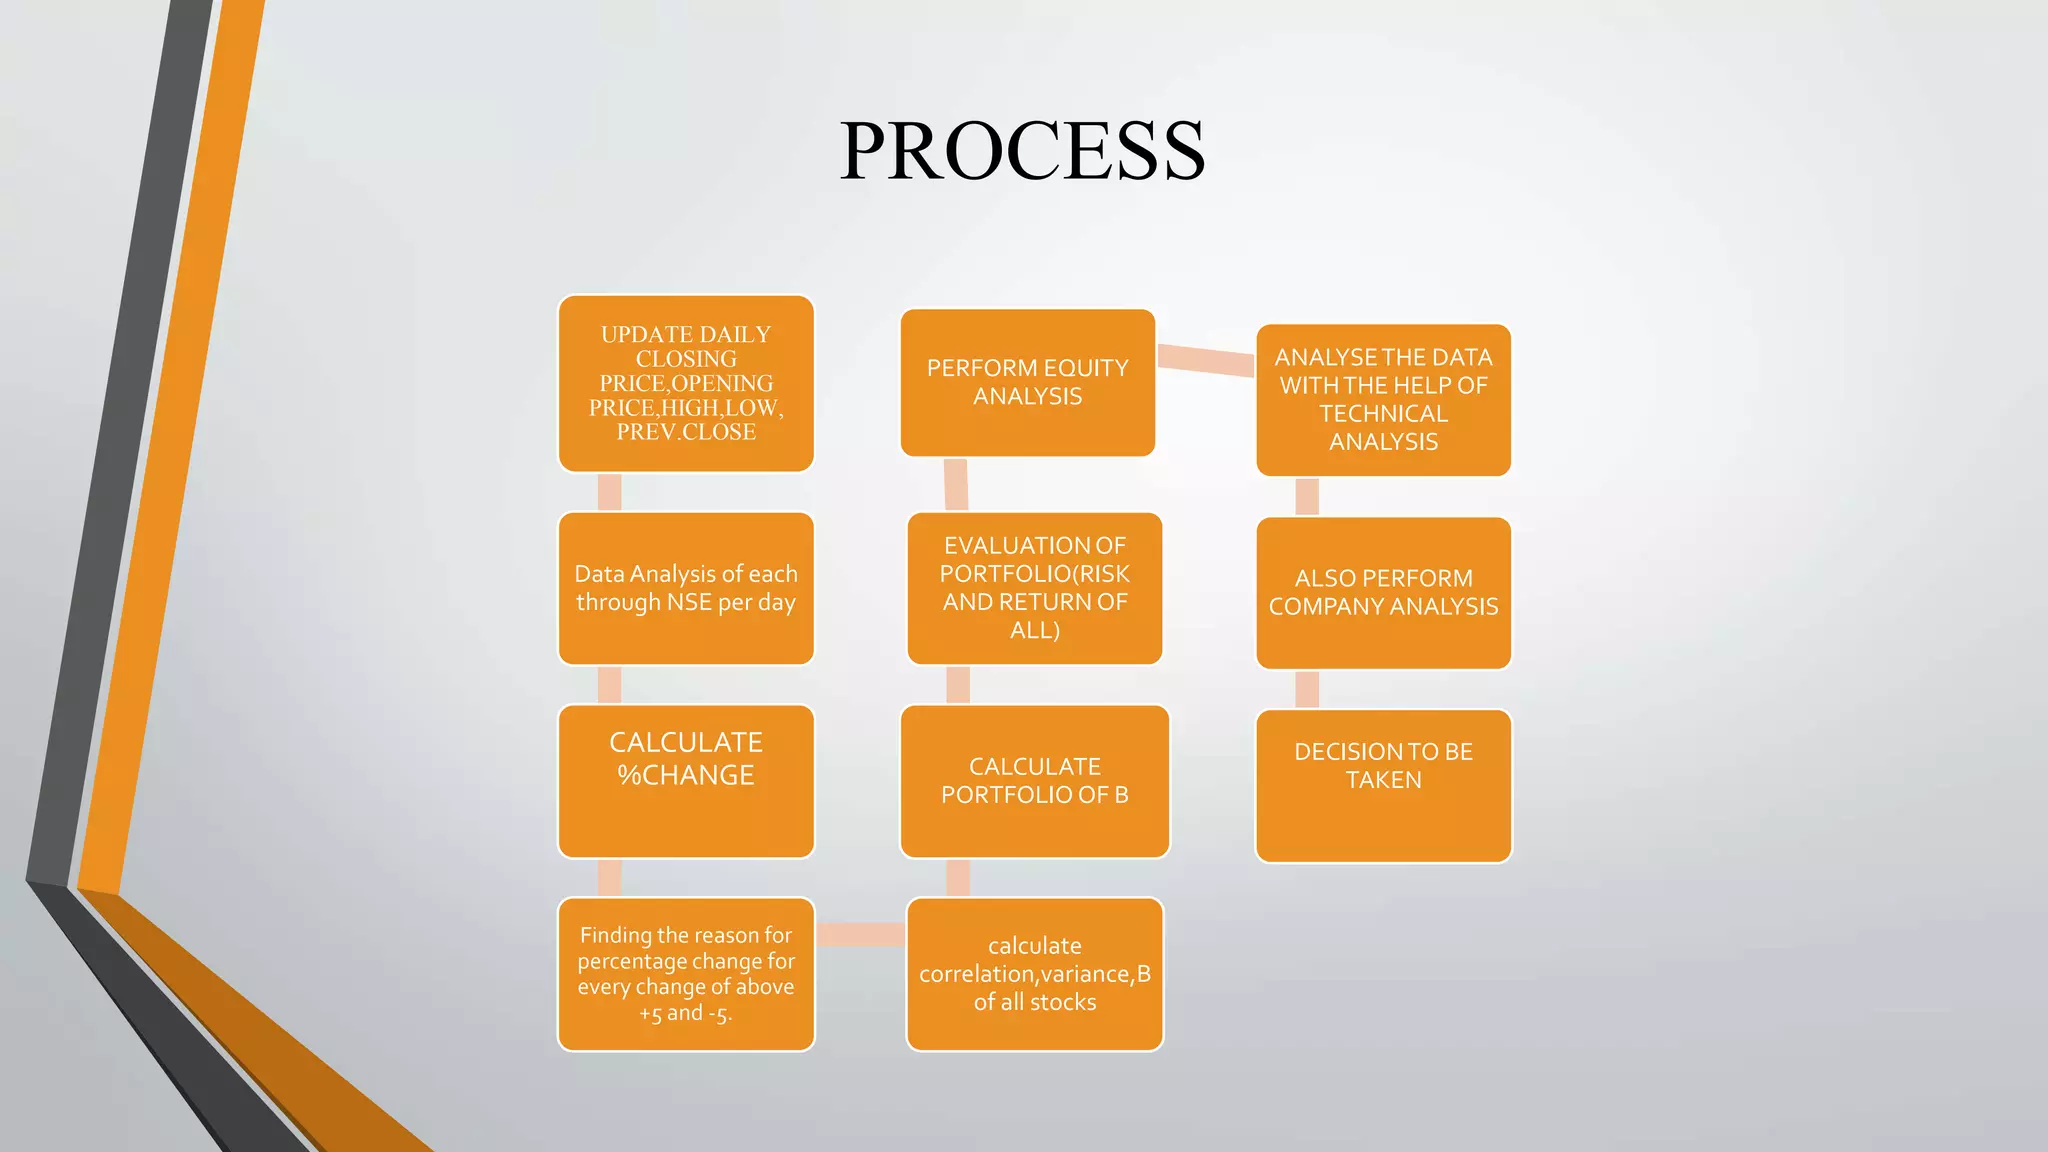
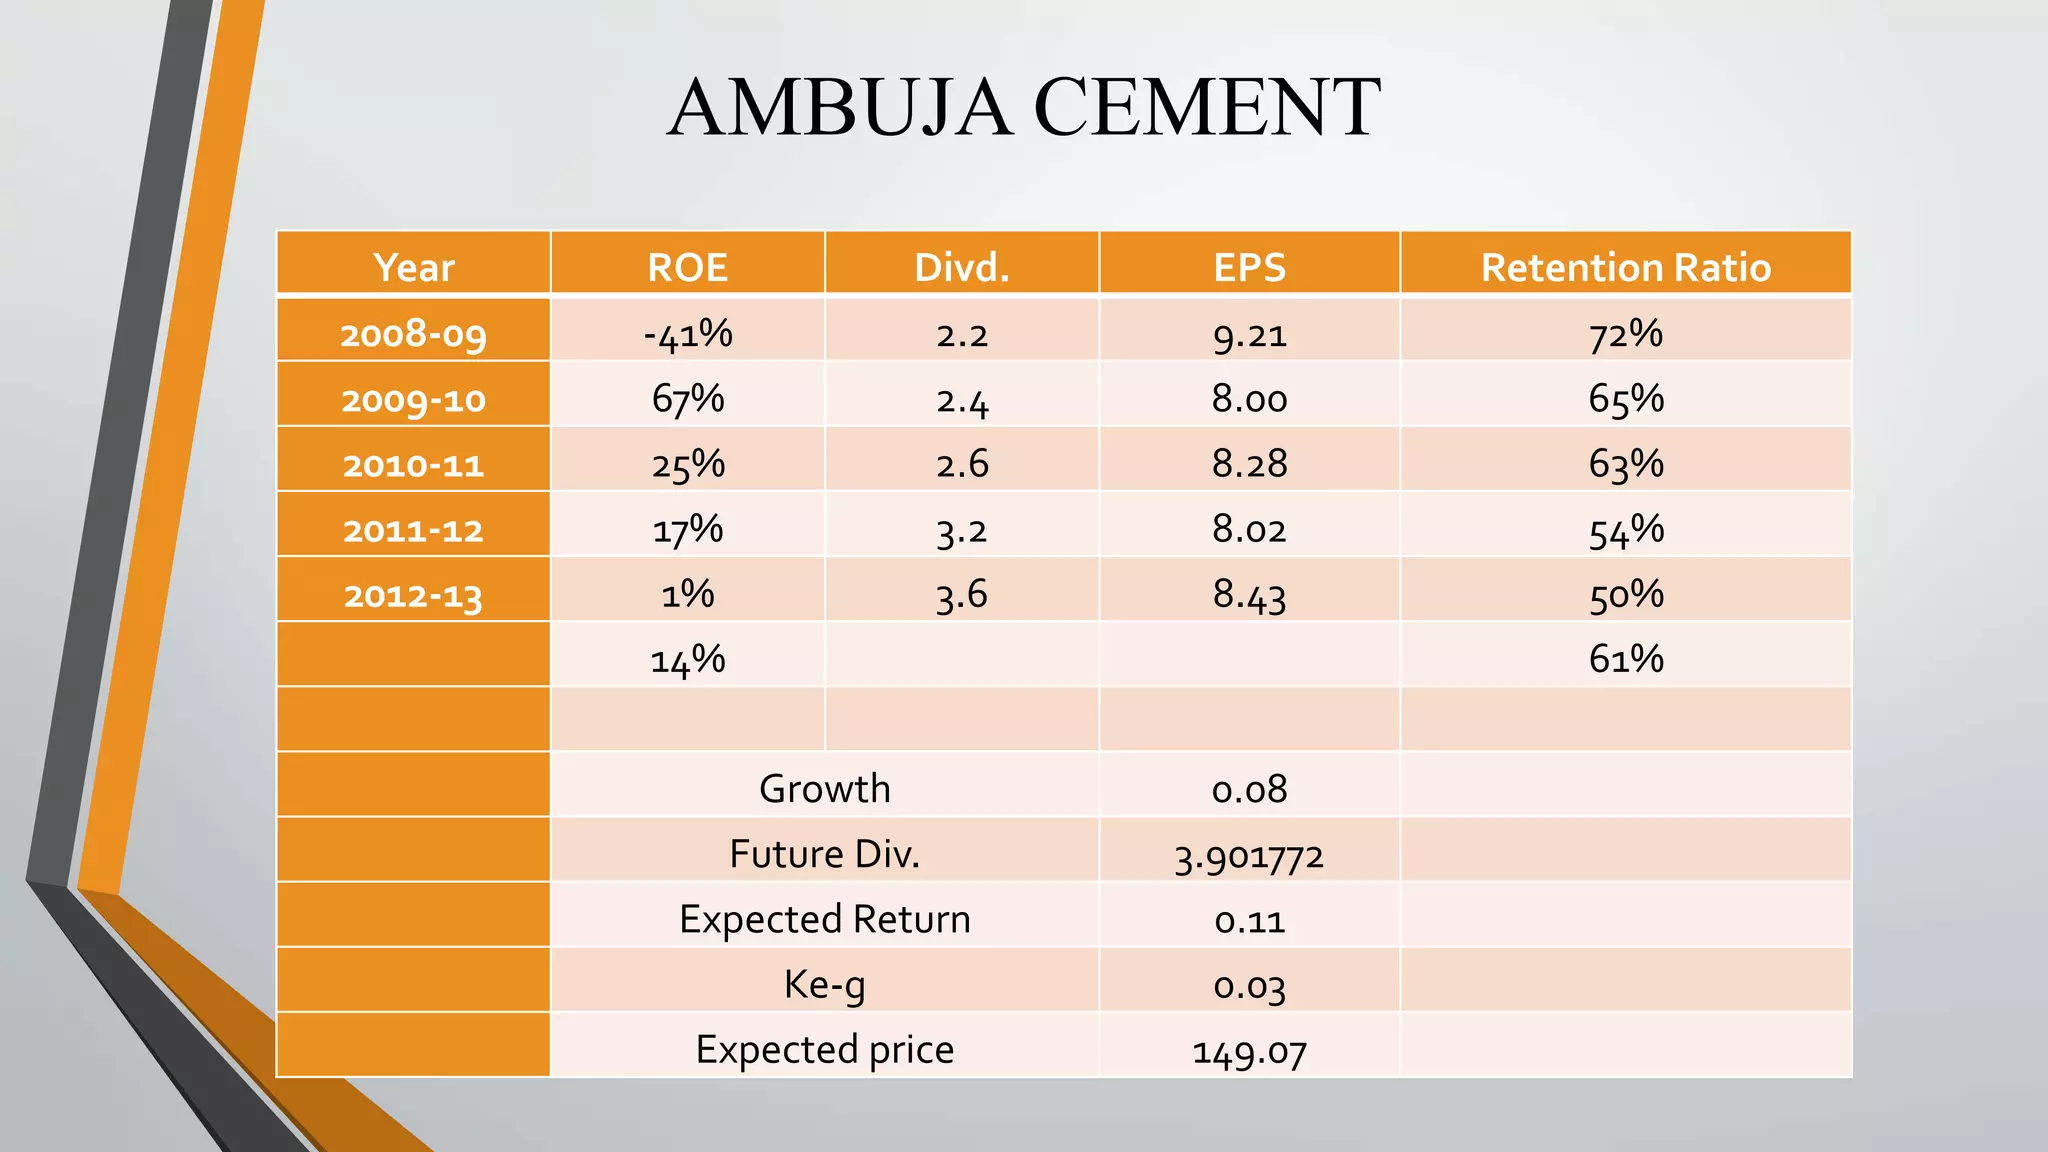
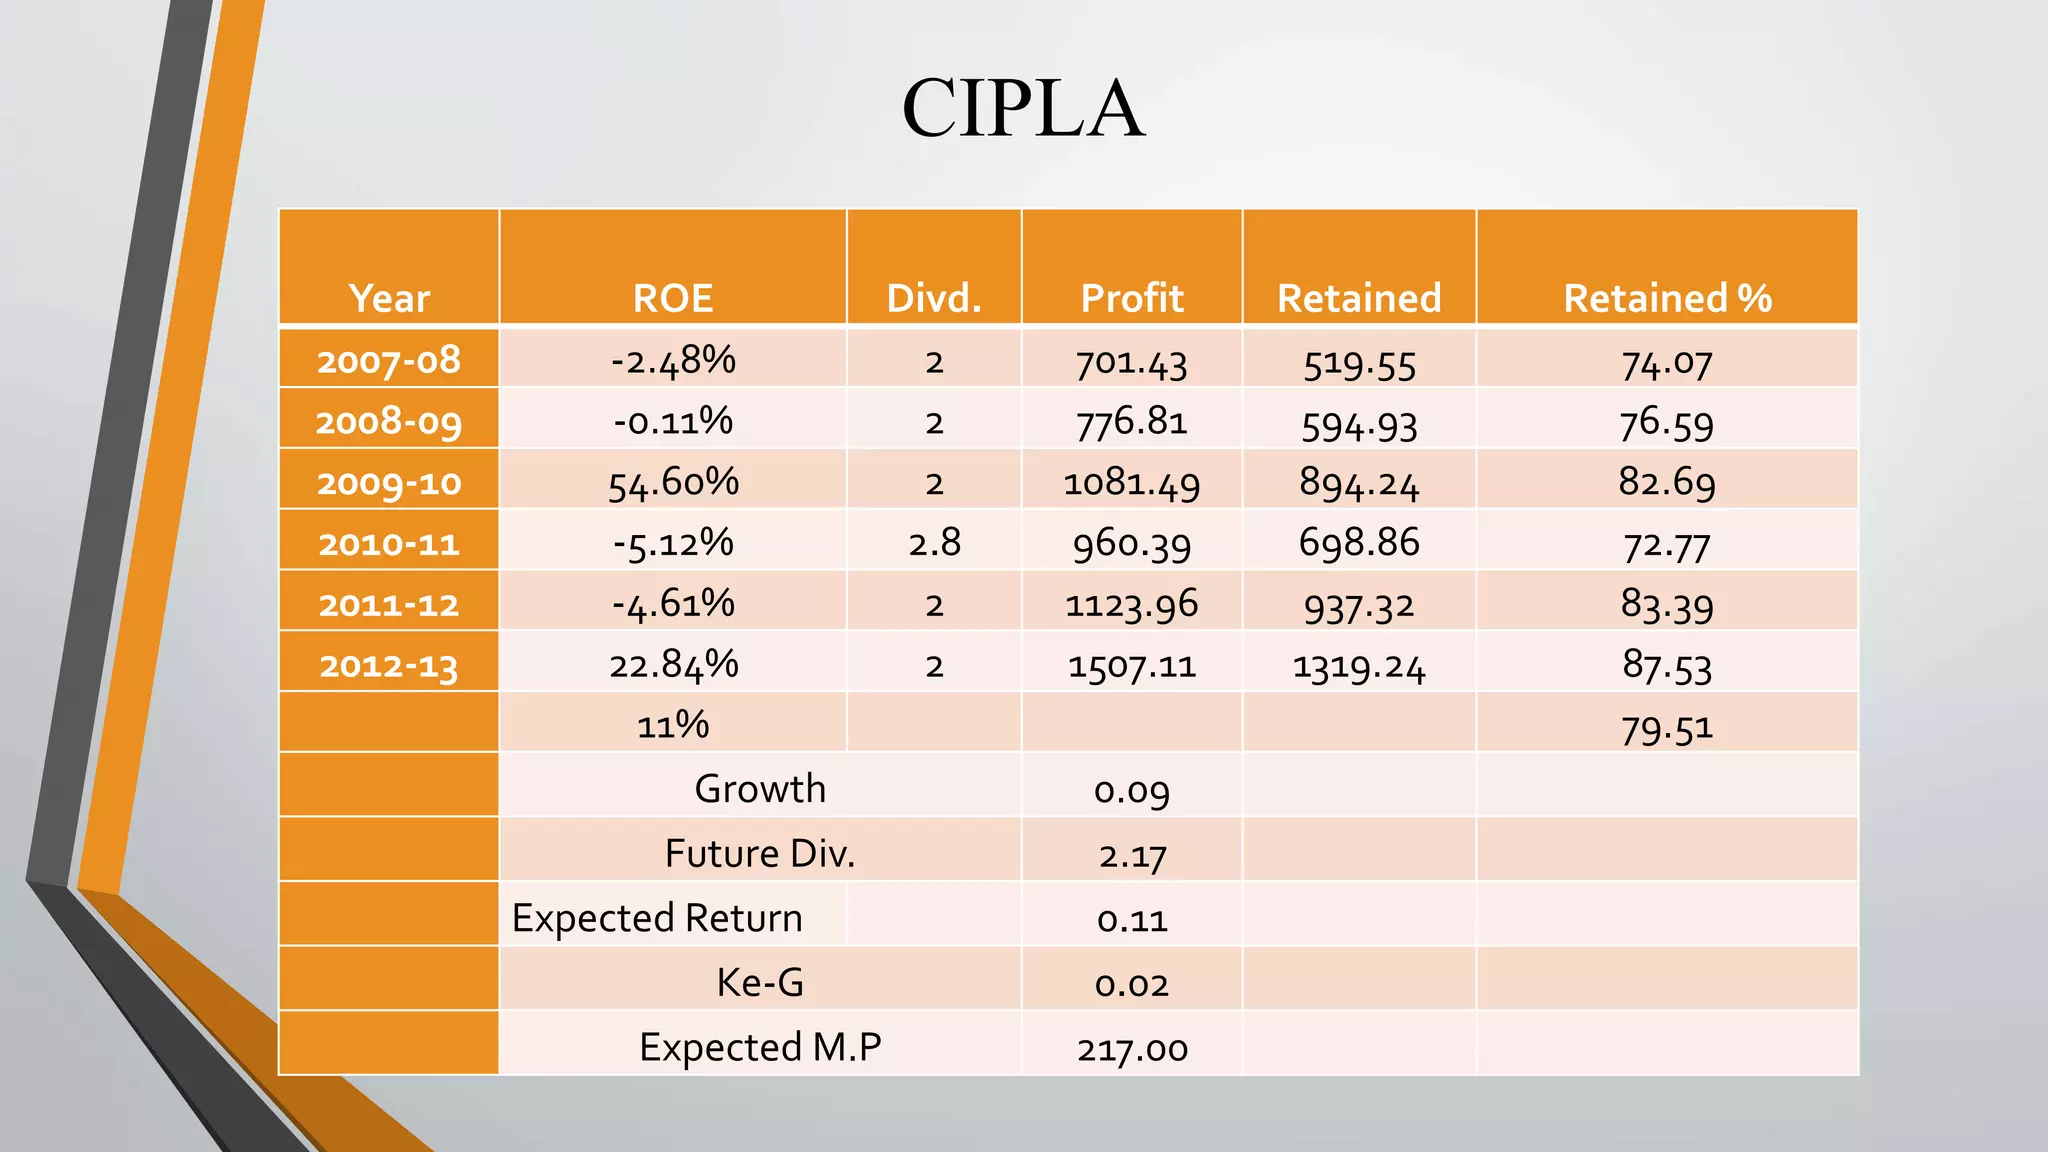
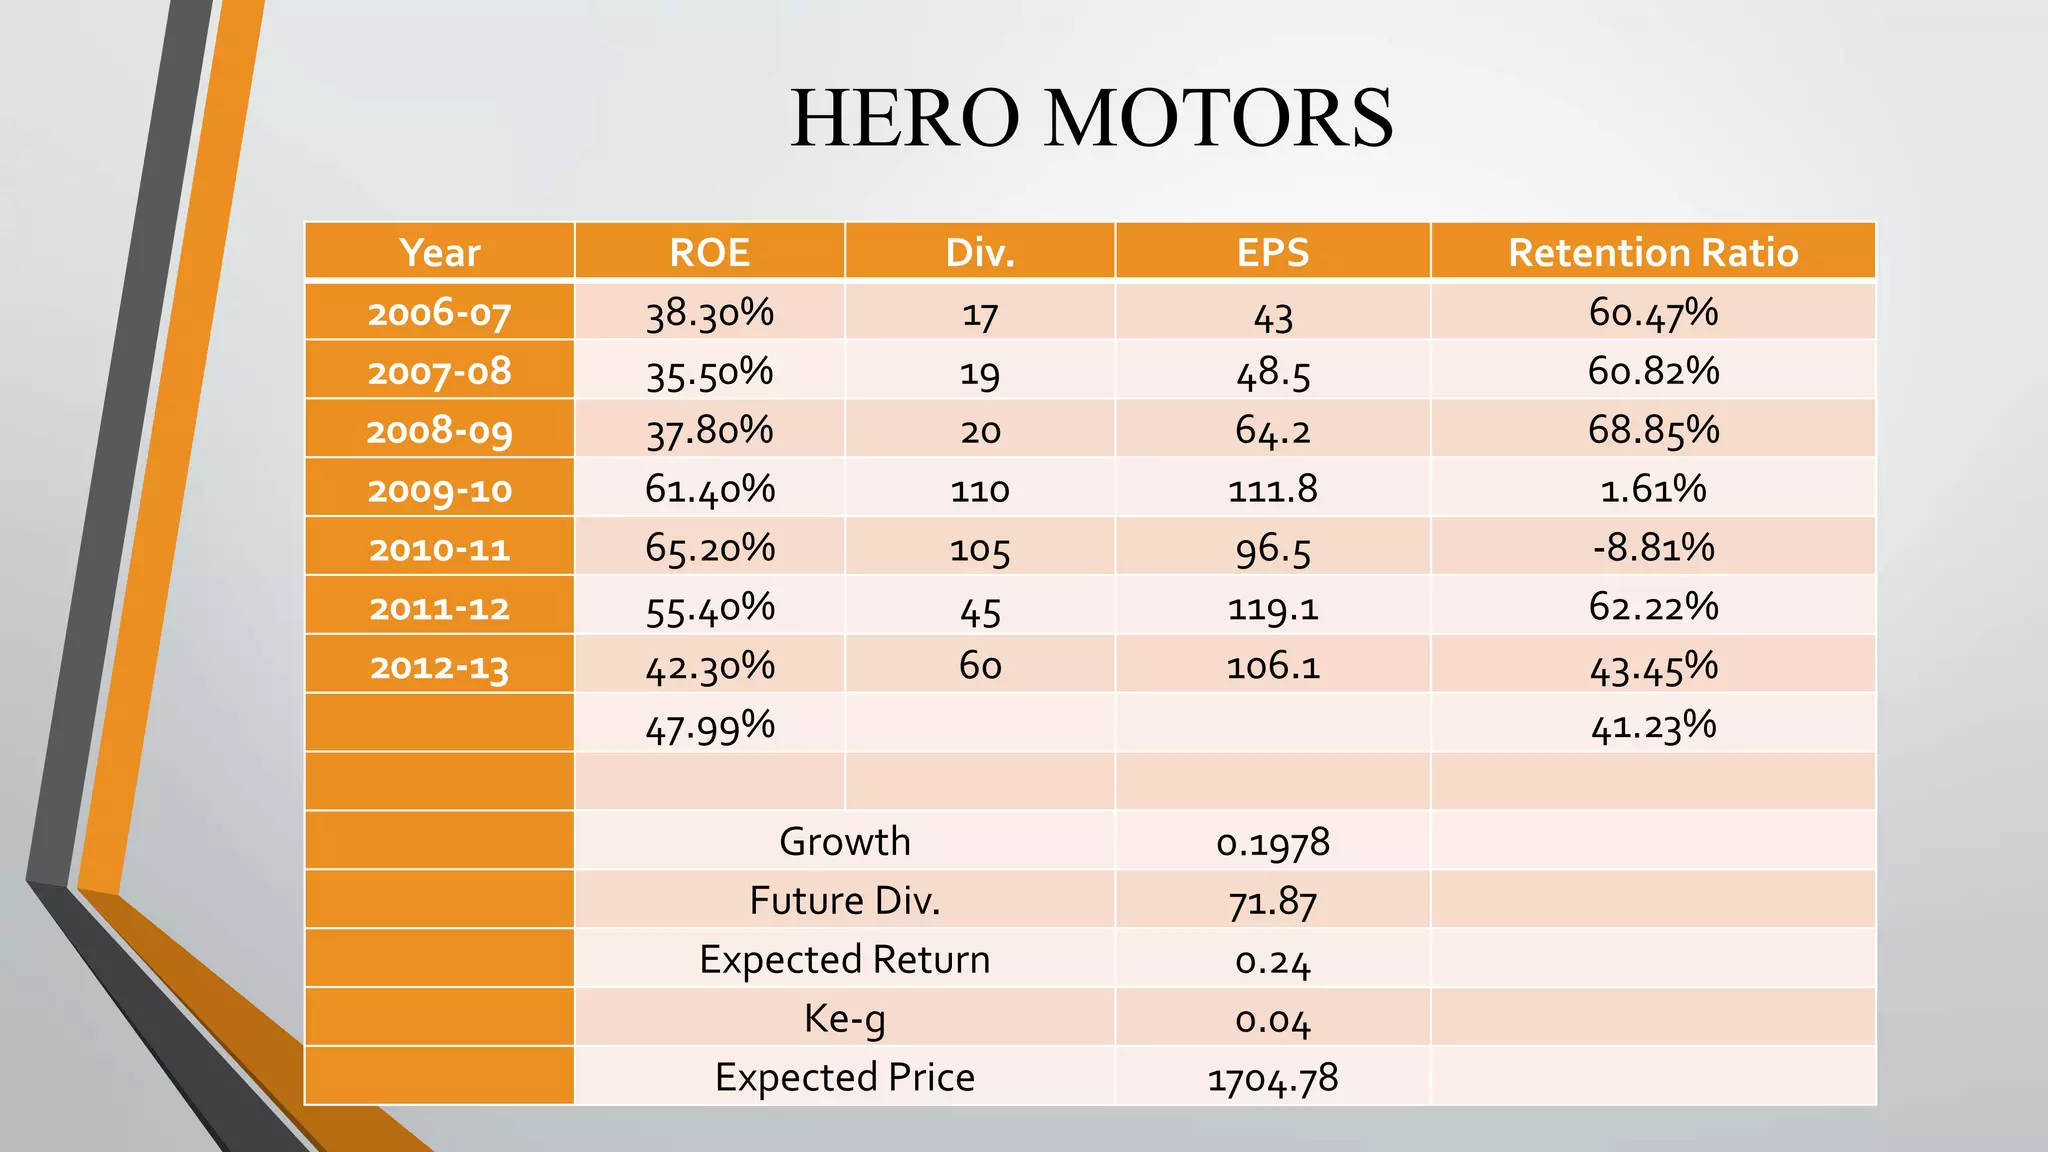
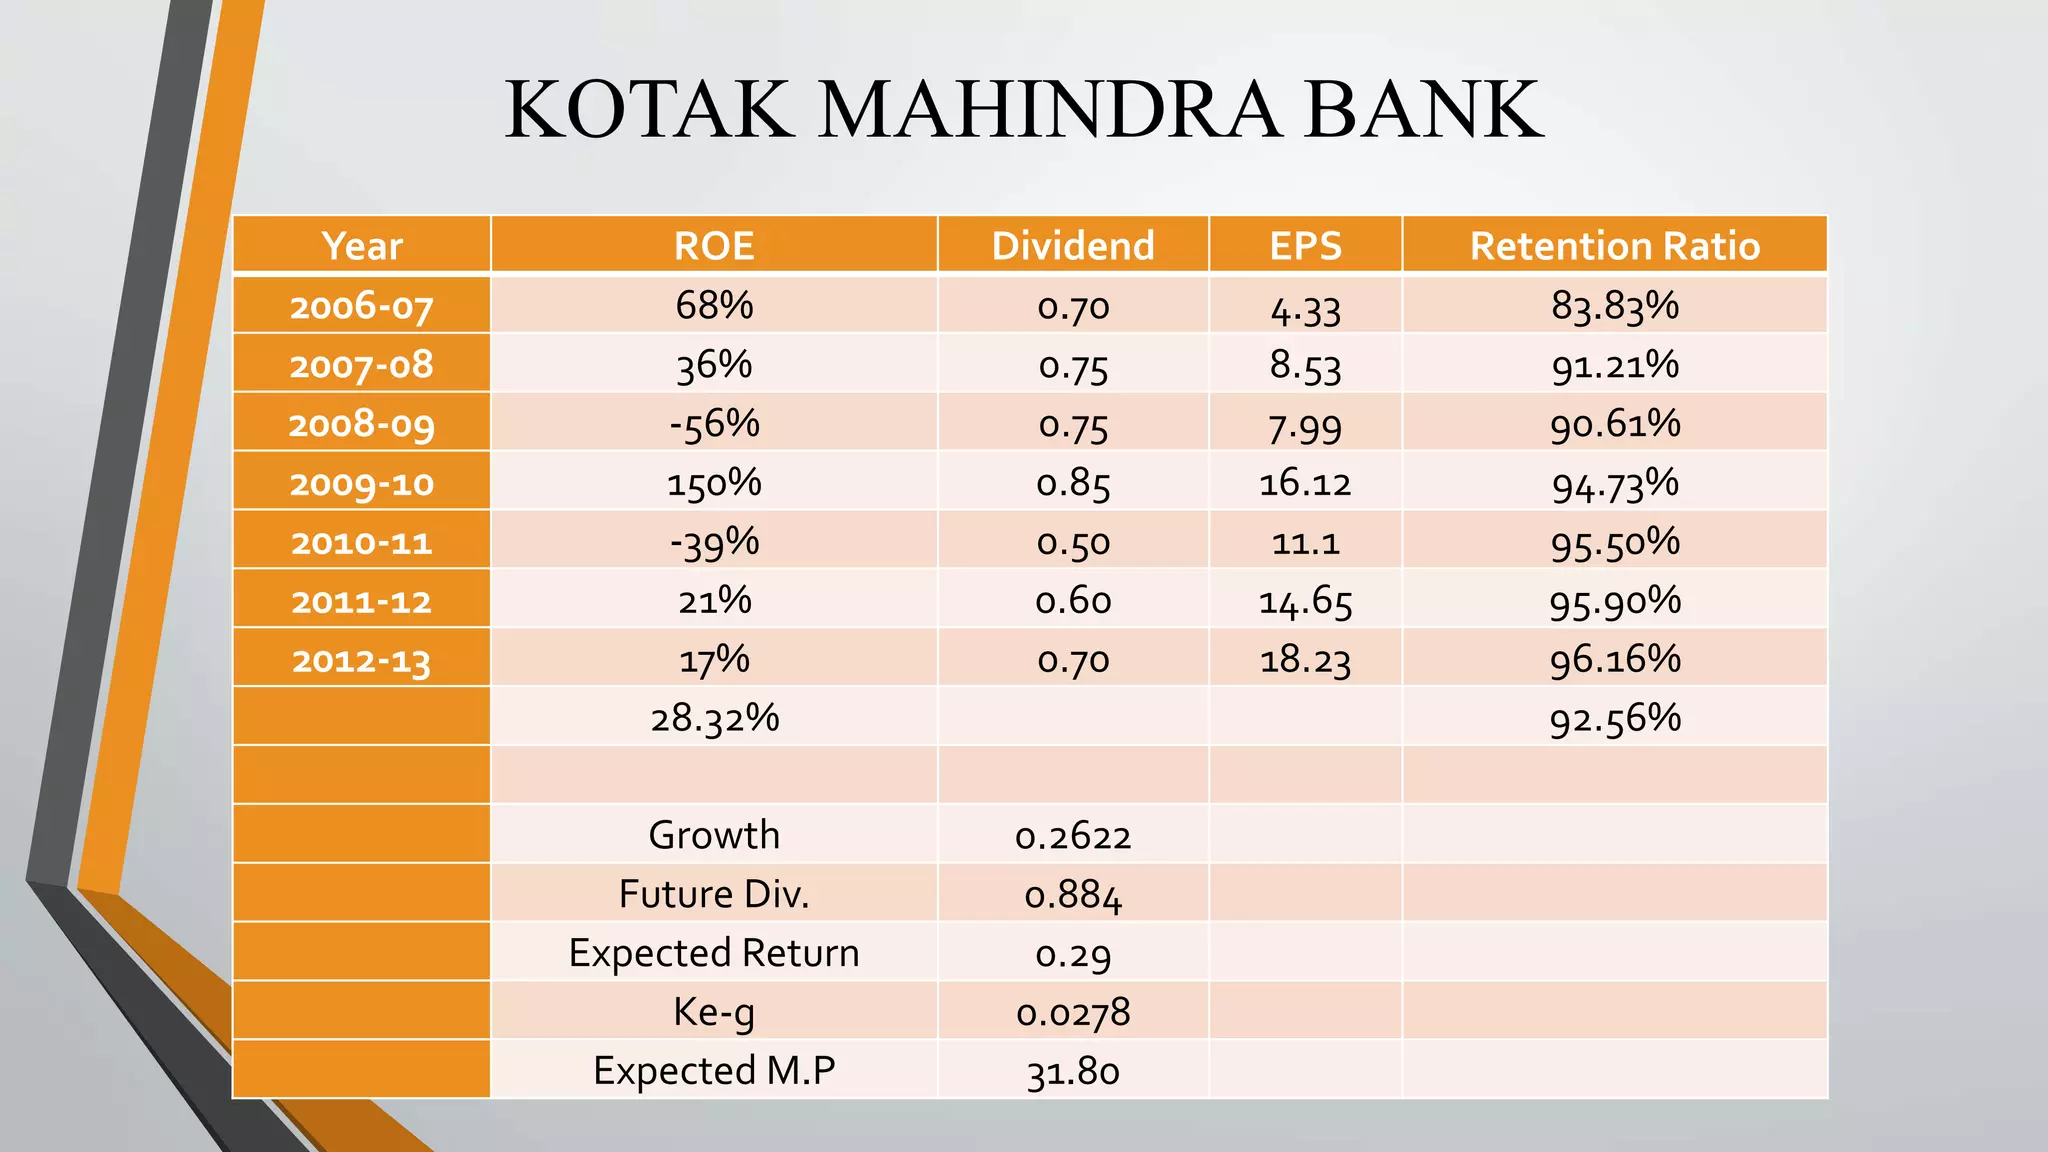
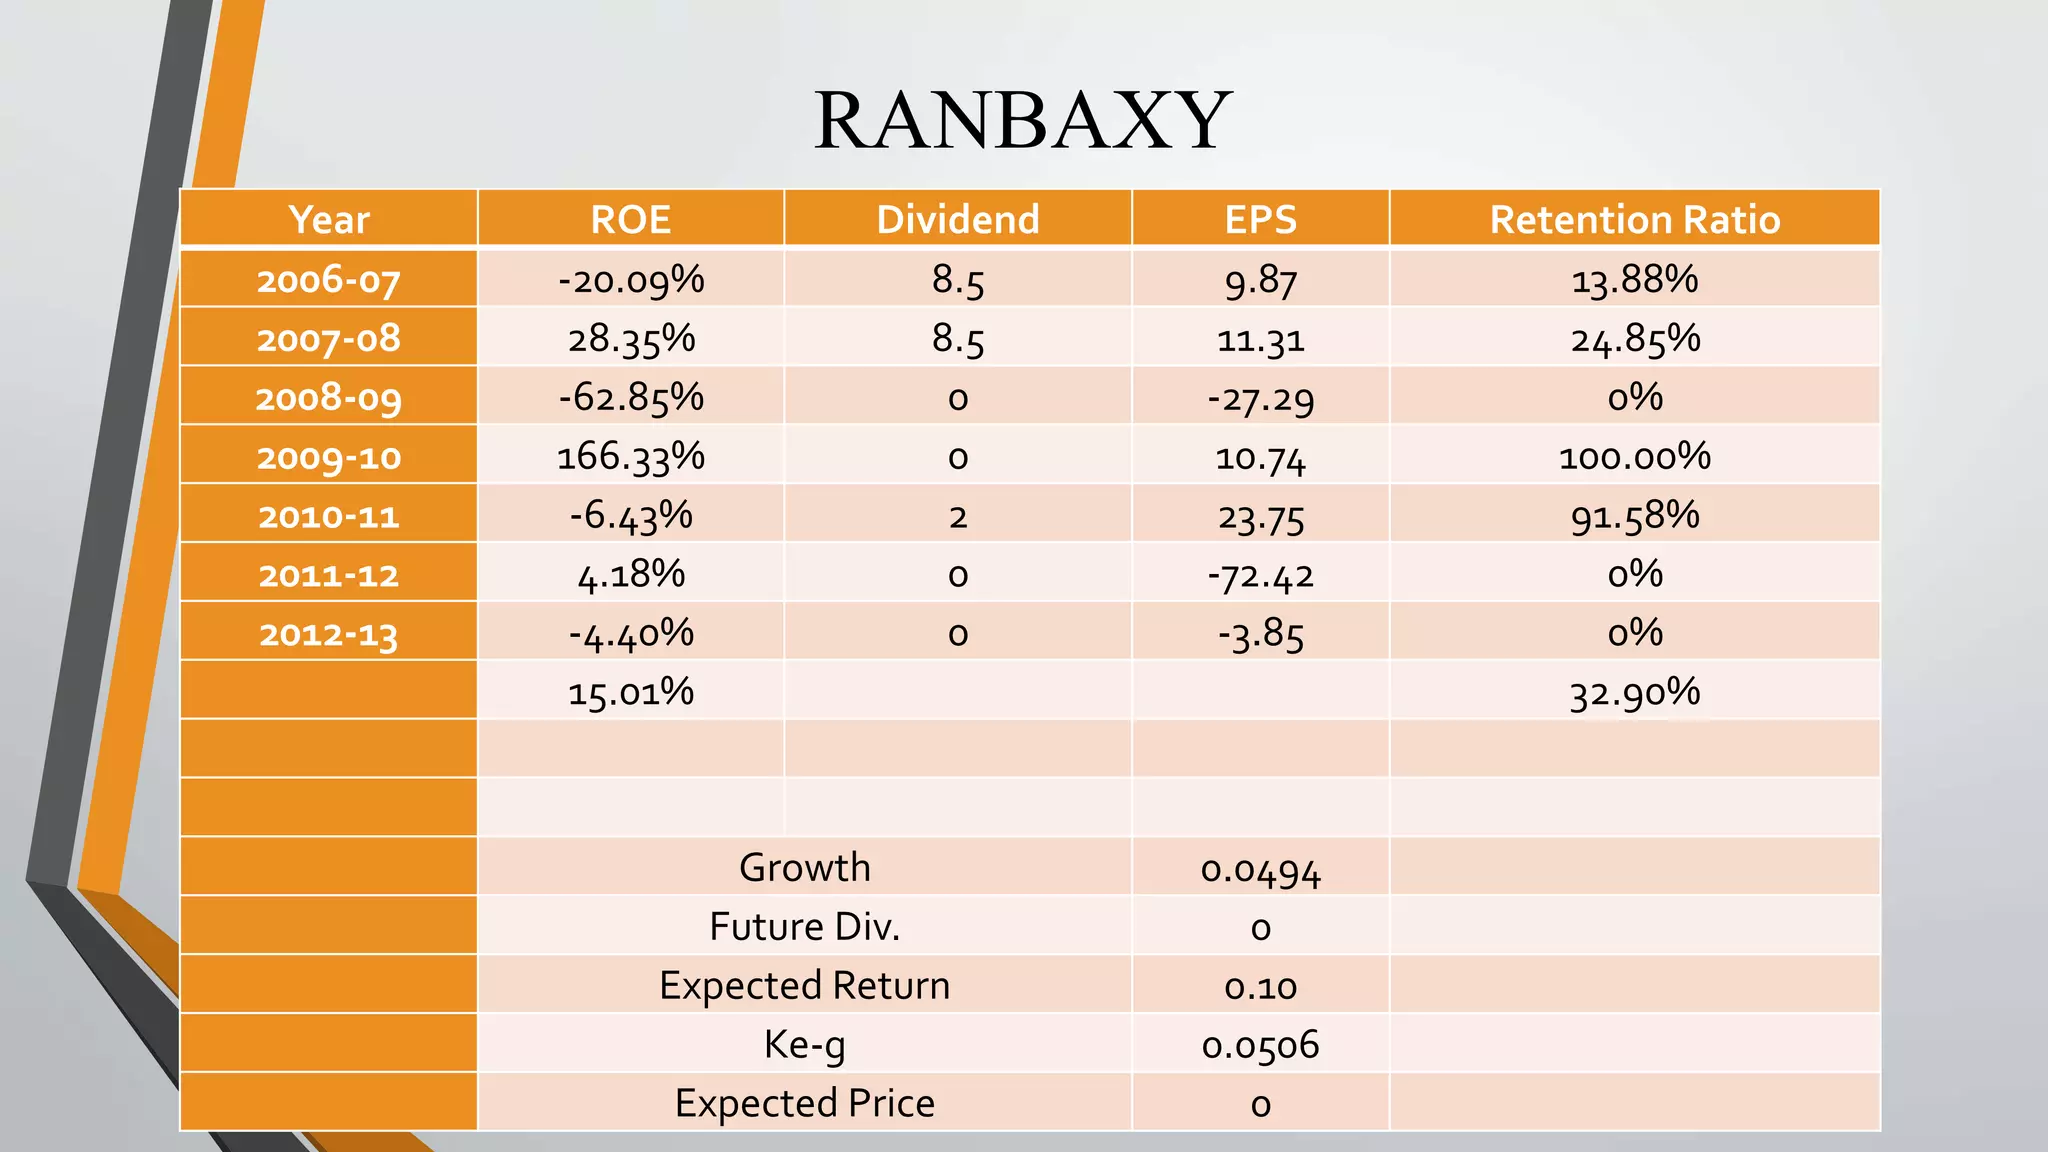
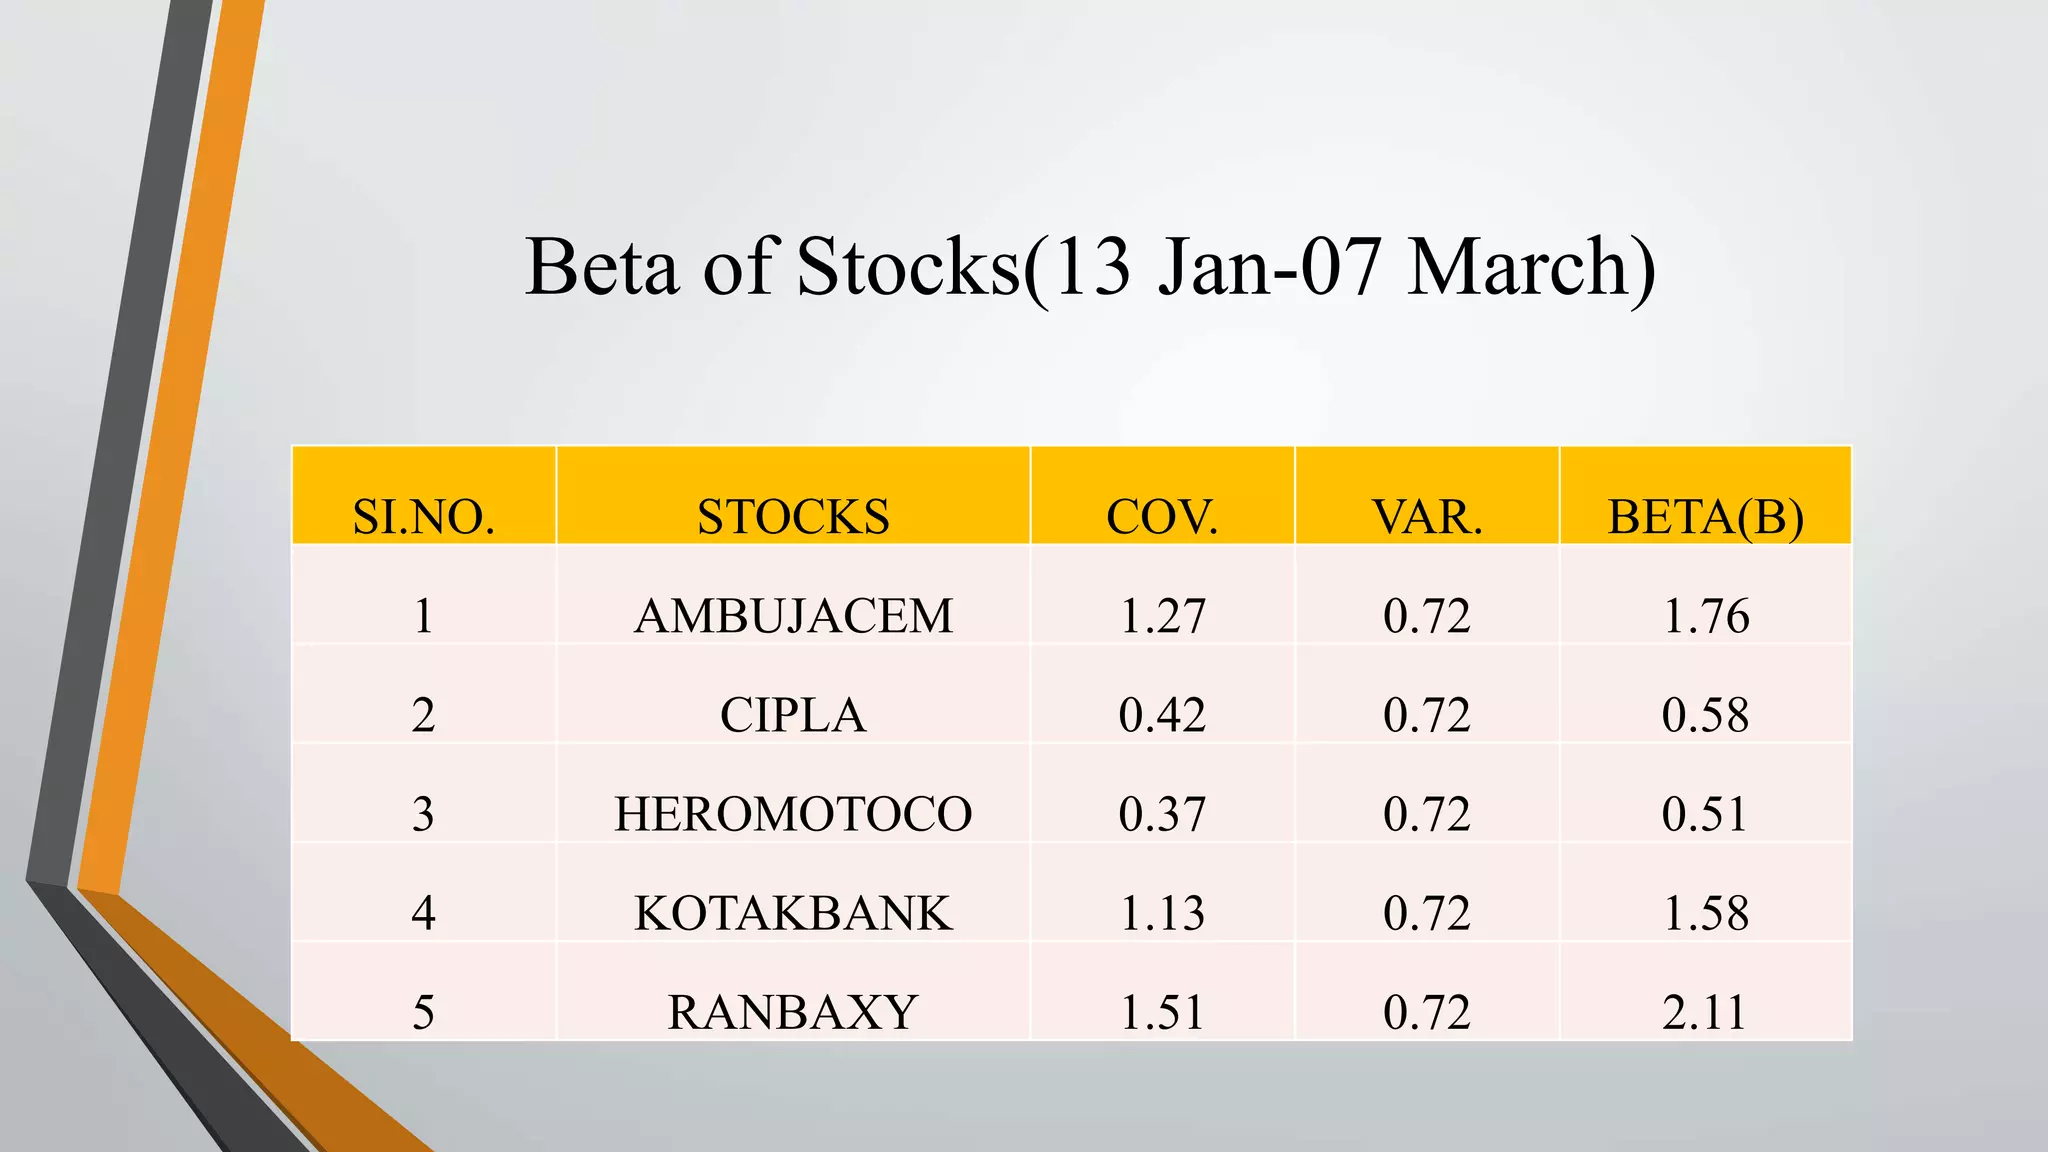
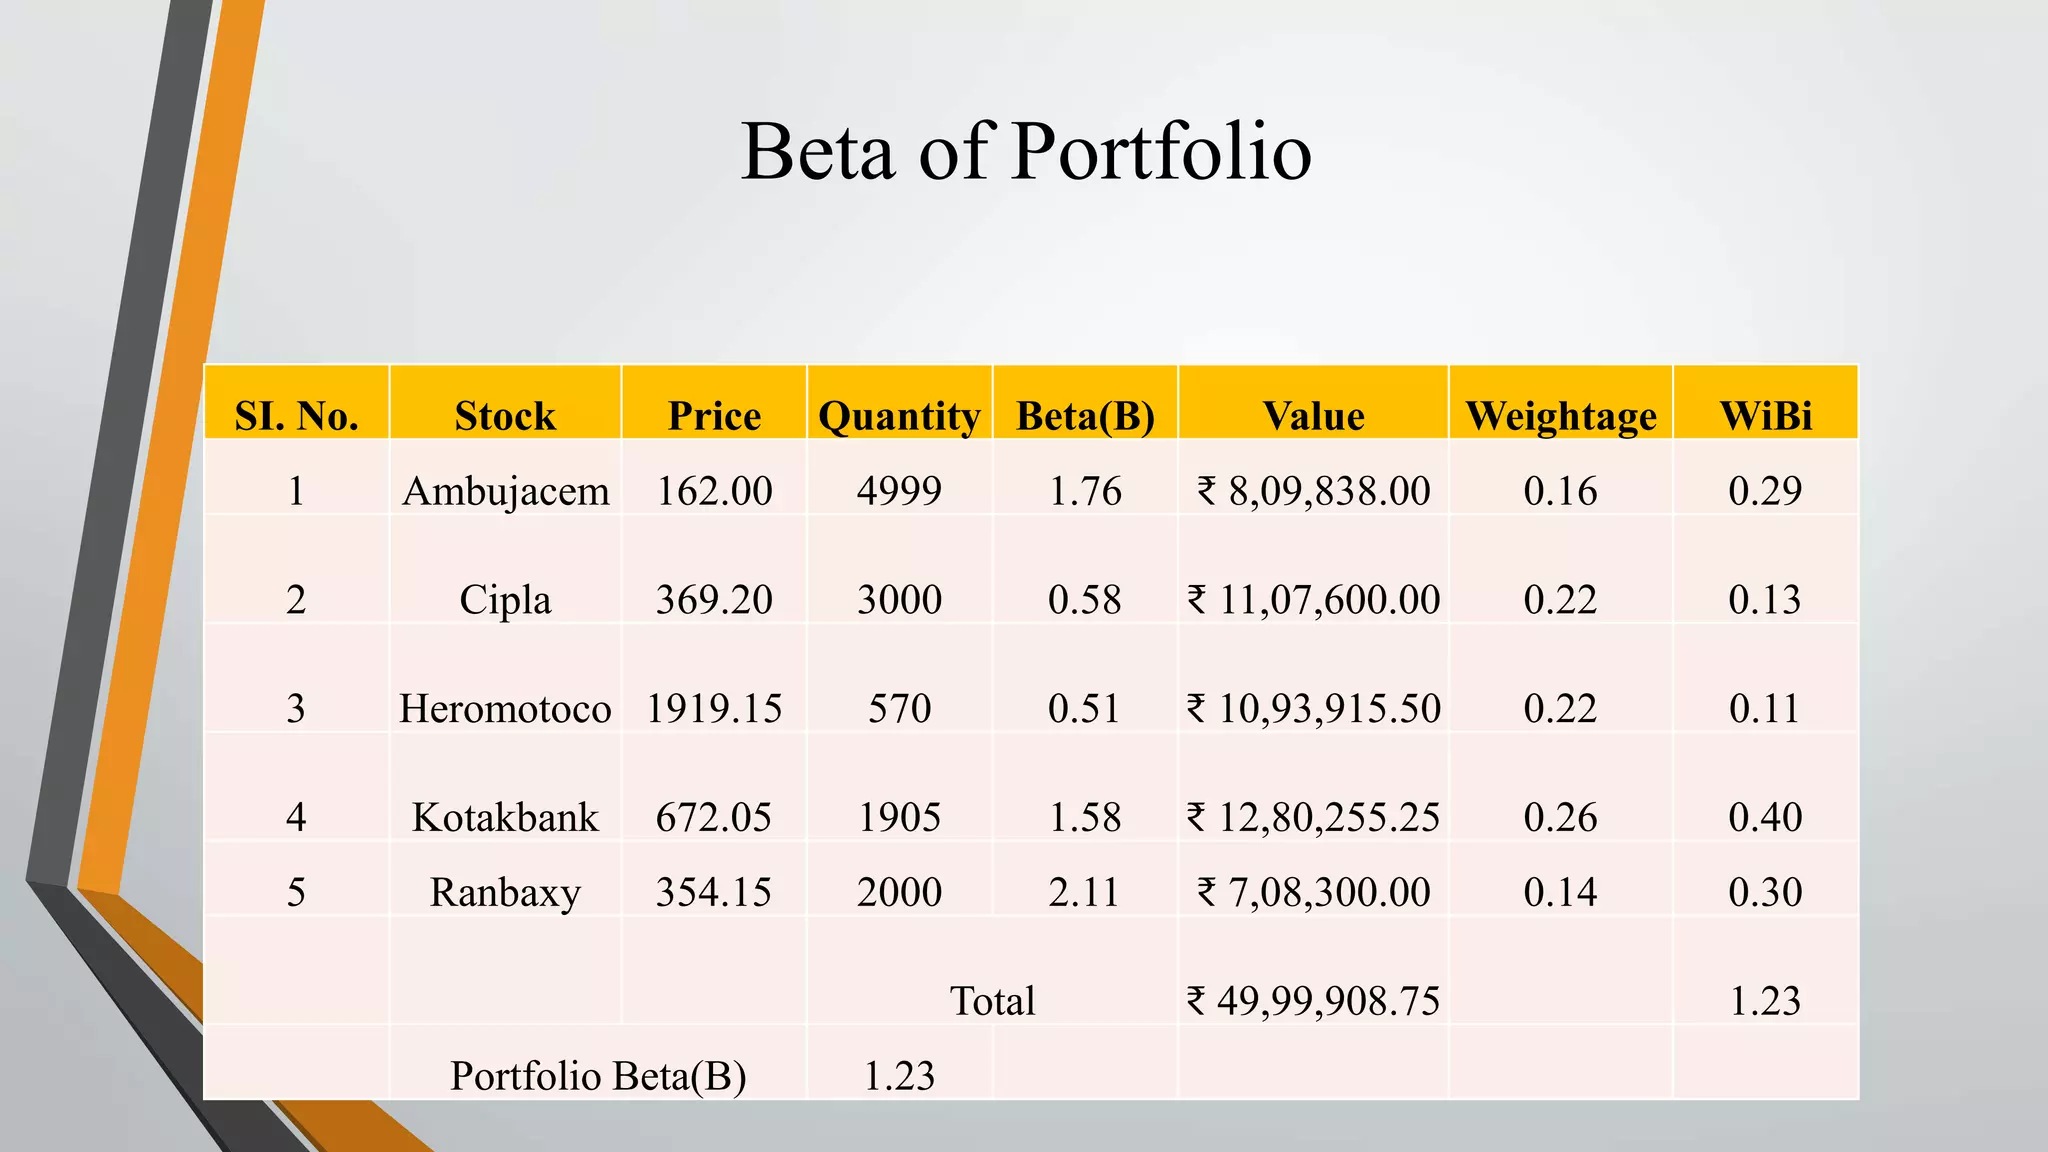
The document discusses a live project on security analysis and portfolio management aimed at studying companies' financial health through stock price movements. It includes objectives, processes, equity valuation, risk assessment, and portfolio evaluation of various stocks like Ambuja Cement, Cipla, Hero Motors, Kotak Mahindra Bank, and Ranbaxy. The project emphasizes maximizing investor returns while minimizing risk through diversification, technical and fundamental analysis, and understanding market conditions.


