

Recommended
Recommended
More Related Content
What's hot
What's hot (20)
Similar to Seagrasses of Red Sea
Similar to Seagrasses of Red Sea (20)
Seagrasses of Red Sea
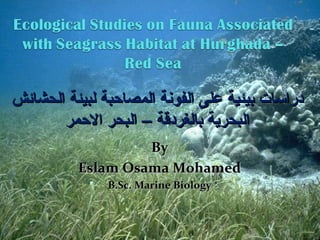
- 1. دراسات بيئية على الفونة المصاحبة لبيئة الحشائش البحرية بالغردقة – البحر الحمر By Eslam Osama Mohamed B.Sc. Marine Biology
- 2. Under supervision of Prof. Dr. Mohamed Mahmoud Abo Zaid Prof. of Aquatic Biology Dr. Abdel Kader Hassan Mohamed Lecture of Marine Ecology
- 3. Introduction Seagrasses are marine plants belonging to Angiospermae which adapted to live underwater. There are 12 genera around the world have about 60 species.
- 5. Economical importance • Production of the paper. • Fertilizer for agriculture. • Thermal and sound housing insulation. • Human food in several countries . • Carpets , hats, baskets and others.
- 6. The Problem There are few information about seagrasses and associated along the Egyptian Red Sea coast. Globally, The dynamics of faunal community associated with seagrasses is poorly understood.
- 7. Aim of the work This work aims to : Study the distribution of the seagrass beds located around Hurghada using traditional and advanced methods. Determine the seasonal variation in the fauna associated with seagrass beds. Study the movement of faunal community within seagrass as microhabitat
- 9. Survey Locations: the Egyptian Red Sea coast at Hurghada area and near shore Islands. the survey include 8 sectors based on information gathered from local community and fishermen. GPS point recorded for each sample in special data sheet, during 2007.
- 10. In each sector, some information collected such as Location Name Location Code lat long Seagrass sp GPS Date / / 2007 Density of seagrass Photos Type of bed mono multi Depth of the bed H.stipulace H.uninerves H.ovalis Se S.isoetifolium Epiphytic load ag T.hemprichii ra Th.ciliatum ss C.rotundata Sp C.serrulata Presence of Macro-benthic p. H.ovata No. of samples Code Core samples organisms Density of seagrass Epiphytic load Site description and sketch maps Bed Depth Status of seagrass for seagrass beds Macro- benthic Site description
- 11. Sampling of the Associated Fauna Samples collected using Core (10 cm diameter x 30 cm height) by snorkeling and SCUPA diving include all associated fauna and soil. All samples transferred to Lab in plastic bag with 10% formalin and water soluble Eosin.
- 12. Samples sieved by 0,5 mm sieve to collect macro-fauna and soil separated in other container to examine soil texture fauna examined under binocular microscope and all fauna sorted, counted and classified according to available literature to the nearest group.
- 13. Soil dried in oven at 65 for 96 hours and passed through series of sieves (from less than 0.106 to about 2 mm) to determine soil texture by weight percentage of each sieve content. Silt and Clay determined by pipette analysis methods (carver,1971)
- 14. The results applied to FAO triangle soil texture, 1977.
- 15. Remote sensing and GIS was done in Quick Bird Satellite images (60 cm resolution) using ERDAS imagine (ver. 8.1) Many trails have been done on the satellite image to get the most accurate distribution of seagrass beds
- 16. Seasonal study Three sites have been selected to study seasonal variation in faunal community structure 3 1 2
- 17. Sampling Three quadrates was taken (.25 x .25 cm) to remove shoots to study epifauna inhabits in seagrasses After remove shoots three core were taken(10cm x 10 cm) to study in fauna inhabits seagrasses Three cores were taken (10 cm x 10 cm) also in adjacent sand to study in fauna inhabits in the sand.
- 18. Sampling Three quadrates was taken (.25 x .25 cm) to remove shoots to study epifauna inhabits in seagrasses After remove shoots three core were taken(10cm x 10 cm) to study in fauna inhabits seagrasses Three cores were taken (10 cm x 10 cm) also in adjacent sand to study in fauna inhabits in the sand.
- 19. Three sediment samples were taken to determine the organic content within the bed and in adjacent sand habitat Seagrass Canopy height was measured using a ruler Temperature , salinity and PH were measured by field multiprop.
- 20. In Laboratory Sorted, counted & identified counted L.A.I Dried at 70 C0 to 72 Dried at 375 C0 to 16h
- 21. Data handled using a lot of programs like PRIMAR (ver.5.2.2), SURFER (ver.8.5) and Statistica (ver. 5.1)
- 23. The survey results indicate that there are about 7 Species at Hurghada from 11 recorded in the Red Sea
- 24. Two sectors were mono specific bed (North Hurghada and South Ahyaa sectors) and the rest six sectors were mixed beds . The dominance of H. stipulacea in all sectors Density of seagrasses ranged between 50% in South Hurghada sectors to 85% in many sectors. The seagrasses found in depth ranged between 0.5 m in different locations to 15 m in North Ahyaa. Epiphytes was almost found in medium load on seagrass blades Mollusca and Echinoderms were the most observed macro benthos
- 25. Soil Analysis Most of seagrass species tend to grow in sandy soil, while the other tend to grow in gravels and coarse sand soil texture such as Th. ciliatum The only species adapted to grow in soil contains high silt and clay was H. stipulacea, although he also grown in soil contain high coarse sand content.
- 26. Soil similarity
- 27. Supervised Classification
- 28. Unsupervised classification depending on 20 shades. Distribution of seagrass depending on the 20 shades classification
- 29. Unsupervised classification depending on 30 shades. The size of seagrass beds around Hurghada estimated by about 1,954,480 m2
- 30. Associated Faunal Composition The total numbers of recognized species were 142 possible species belonging to 10 different taxonomic groups.
- 32. Faunal abundance in surveyed sectors Erq sheraton and Abo Monkar were the highest sectors while El-Dahar was the lowest sector
- 34. Similarity between location based on faunal density Similarity proved that the effect of anthropogenic activity on faunal community associated with seagrass beds North Hurghada and South Ahyaa was the highest similarity while El- Dahar was the lowest similarity with other sectors
- 35. Foraminifera study There are 13 species of foraminifera recorded ranged between 7 in South Hurghada to 13 in North Gifton sector Sorites marginalis was the most dominant species The lowest density recorded at El Dahar, while North Hurghada and South Ahyaa were the highest
- 36. Foraminifera study There are 13 species of foraminifera recorded ranged between 7 in South Hurghada to 13 in North Gifton sector Sorites marginalis was the most dominant species The lowest density recorded at El Dahar, while North Hurghada and South Ahyaa were the highest
- 37. Foraminifera similarity between sectors based on density: Similarity based on the geographical range and the highest density inhabiting soft sediment
- 39. Shoot count
- 41. Leaf Area Index (L.A.I)
- 42. Canopy Height
- 44. Biomass of Each species
- 45. Organic Content
- 46. Faunal composition Seasonal fauna composed of 117 species belonging to 8 different taxonomic groups
- 47. Faunal composition in each microhabitat
- 48. Taxonomy and faunal Identification Phylum: Annelida Class: Polycheata Order: Capitellida Family: Capitellidae Genus:Capitella capitata Fabricius, 1780 Heteromastus filiformis Claparède, 1864 Capitelldea sp Grube, 1862 Decamastus gracilis Hartman, 1963 Family: Maldanidae Genus: Micromaldane bispinosa Hartmann-Schröder, 1960 Clymenura sp Verrill, 1900 Axiothella obockensis Gravier, 1905
- 49. Micromaldane bispinosa Lumbrineris nitida Platynereis sp1 Ophelia polycheles Armandia longicaudata Praxillella gracilis
- 50. Smaragdia rangiana Smaragdia souverbiana littorina juv. 2 Cyprea juv 1 Rissoina sp 1 Strompus juv. Rissoina sp latirus juv. littorina juv.1 Mitra typha Ancilla lineolata Cyprea juv. Zebina tridenta
- 51. Microprotopus maculata Stenothoe marina Crab Larva 1 Nymphon sp Menaethius monoceros Amphilochus sp
- 52. Abundance of Epifauna • The most abundant groups were Polycheats and Crustacea •Spring season was the highest, while the summer was the lowest from density point of view
- 53. Abundance of Infauna The most abundant groups were Gastropoda and Bivalvia Spring and summer were the most abundant seasons
- 55. Oligocheats
- 56. Crustacea
- 57. Gastropoda
- 58. Bivalvia
- 59. Nematoda
- 60. Echiondermata has been recorded only at , while Cephalochordata only at Abo Monkar
- 61. Association between fauna and microhabitats Epifauna contains (13species) 7 polycheats, 2 isopoda, 2 crabs and 1 gastropoda Infauna contains (17 species ) 12 polycheats, 3 bivalvia, 2 gastropoda Sand contains ( 8 species) 3 plycheats, 2 gastropoda, 2 crustacea, single echinoderm
- 62. Mobility of fauna between microhabitats 13 species found in both shoot and root microhabitat (10 polycheats, single crab, gastropoda and mysida) 40 species found in both root and sand habitat ( 13 gastropoda, 12 polycheats, 11 bivlvia, 2 oligocheats, single and ampipoda and echinodermata) 29 species found in all microhabitats
- 63. Statistical analysis T. test proved that there are no significant difference between samples which indicated that the beds are homogenous ANOVA one way and two way proved that there are significance difference between number of individuals and species with habitats and groups
- 64. Diversity Marine Station Shannon winner Delta Diversity
- 65. Abo Monkar Shannon winner Delta Diversity
- 66. El Fanous Shannon winner Delta Diversity
- 67. Faunal Correlations Marine station 140 25 y = 3374.7x-1.9193 20 y = -7.789x + 63.22 120 No. of individuals No. of species R2 = 0.9609 R² = 0.915 15 100 10 80 5 60 0 5.0 6.0 7.0 8.0 5.0 6.0 7.0 8.0 Canopy height (cm) Canopy height (cm) 25 2.7 y = -0.002x2 + 0.468x + 0.314 y = 0.026x2 - 0.029x + 2.505 20 R² = 0.978 R² = 0.605 Diversit index No. of species 2.6 15 10 2.5 5 2.4 0 0.0 0.5 1.0 1.5 2.0 2.5 3.0 30 80 Biomass (gm)130 180 Organic content %
- 68. Abo Monkar No. of individuals No. of individuals 120 120 y = -1.041x + 175.2 100 R² = 0.982 100 y = -2.467x + 154.0 80 80 R² = 0.965 60 60 40 20 40 0 20 70 100 130 20.0 30.0 40.0 50.0 60.0 2 Biomass (gm) Leaf Area Index m No. of individuals No. of individuals 110 120 -3.94 y = -0.032x + 148.0 90 y = 86326x 100 R² = 0.931 R² = 0.971 70 80 50 60 30 40 10 20 5.0 6.0 7.0 8.0 9.0 1000 2000 3000 4000 Canopy height (cm) Shoot count 45 No. of species 40 y = 10.29x + 19.27 35 R² = 0.763 30 1.0 1.5 2.0 2.5 3.0 Organic content %
- 69. El Fanous No. of individuals No. of individuals y = 11.25x - 195.0 120 100 R² = 0.937 y = -13.89x + 187.4 100 R² = 0.935 80 80 60 60 40 40 20.0 22.0 24.0 26.0 28.0 5.0 7.0 9.0 11.0 Leaf area index m2 Canopy Height (cm) No. of species 20 40 y = -2.245x + 131.7 No. of species y = -24.95x + 71.33 15 R² = 0.993 R² = 0.768 35 10 30 5 25 0 90 100 110 120 130 20 1.2 1.4 1.6 1.8 2.0 Shoot biomass (gm) Organic content% No. of individuals No. of species 14000 y = 3578.x + 254.6 40 y = 5.602x + 13.88 R² = 0.977 35 R² = 0.709 11000 30 25 8000 20 5000 15 1.4 2.4 3.4 1.5 2.0 2.5 3.0 3.5 4.0 Organic content% Organic content%
- 71. Seagrass habitat need more attention Mapping of seagrass habitat along the coast of the Egyptian Red Sea is needed to determine the extent of such important habitat Seagrass community around Hurghada area is still in a healthy state despite the anthropogenic activities which impacted other ecosystems especially at Islands. The presence of seagrass is of great importance to the micro- invertebrate fauna which represent an important segment of the food chain in the Red Sea coast. The fauna inhabiting the shoots or canopy of the seagrass differ in abundance and diversity from that inhabiting the root microhabitat. Seagrass as an ecosystem should be included in the protection mandate of the EEAA as the case of coral reef.