The document discusses several studies on the green economy and its workforce implications for the San Diego region. Some key findings include:
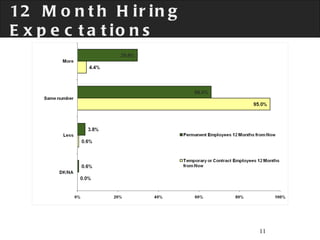
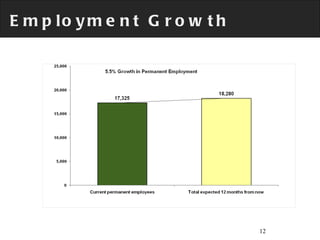
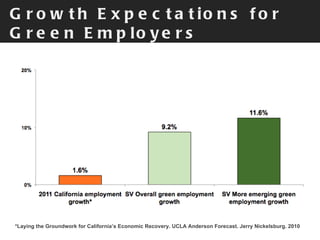
1. Emerging green industries are expected to experience strong growth, with over half of employers anticipating increased staffing levels.
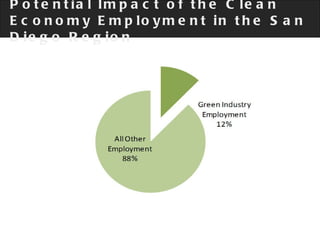
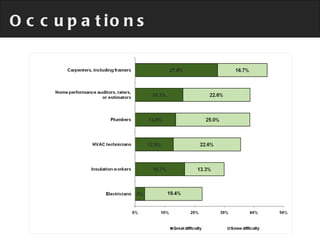
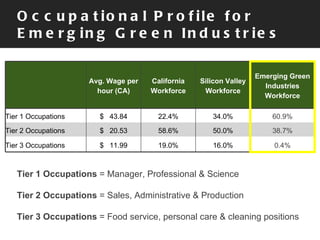
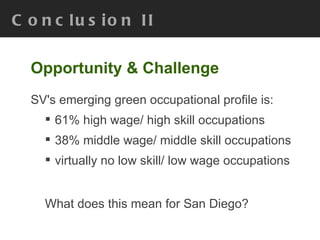
2. Green jobs fall into three tiers - high-wage/high-skill occupations make up over 60% of jobs, middle-wage/middle-skill occupations are around 38%, and low-skill/low-wage occupations are virtually non-existent.
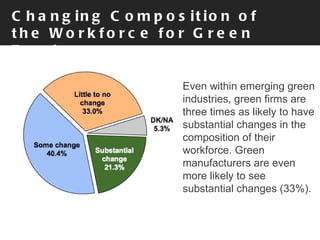
3. Over three-fifths of green employers expect at least some change to the composition of their workforce, with one-fifth expecting substantial changes.


![San Diego Green Economy: Workforce Implications Thank you very much! Philip Jordan, Green LMI Consulting (617) 395-8898 [email_address] http://GreenLMI.com](https://image.slidesharecdn.com/sdgreenmay26v2-110603074144-phpapp01/85/Sd-green-may_26_v2-30-320.jpg)


