1
Scouter 와 InfluxDB– Grafana 연동 가이드
본 문서에서는 Scouter 의 모니터링 데이터를 오픈소스 시계열 DB 인 InfluxDB 에 적재하고
Grafana 를 이용하여 시각화 하는 방법에 대해서 가이드 한다. 사전에 Scouter 가 설치되어
있어야 하며, Scouter 의 설치가 되어 있지 않다면 Quick Start Guide 를 참고하여 환경을 구
성한다.
1. InfluxDB 설치
본 문서에서는 RPM Based Linux 를 기반으로 설명하며, 타 OS Architecture 에 대한 설
치는 InfluxDB 홈페이지를 참고한다.
1.1. 저장소 등록
1.2. 패키지 설치
1.3. 서비스 등록 및 실행
1.4. 설치 확인
http://${SERVER_IP_OR_HOSTNAME}:8083 에 정상적으로 접속되는지 확인한다.
* InfluxDB 는 8083, 8086 두 개의 포트를 사용하여, 방화벽이 동작할 경우 해당 포트
를 추가해야 한다. 또한 UDP 를 사용한 데이터 적재 기능을 사용할 경우
/etc/influxdb/influxdb.conf 파일에서 해당 기능을 활성화 시키고 influxdb 서비스를 재
구동한다.
2. Grafana 설치
본 문서에서는 RPM Based Linux 를 기반으로 설명하며, 타 OS Architecture 에 대한 설
cat <<EOF | sudo tee /etc/yum.repos.d/influxdb.repo
[influxdb]
name = InfluxDB Repository - RHEL $releasever
baseurl = https://repos.influxdata.com/rhel/$releasever/$basearch/stable
enabled = 1
gpgcheck = 1
gpgkey = https://repos.influxdata.com/influxdb.key
EOF
sudo yum install influxdb
sudo systemctl enable influxdb
sudo systemctl start influxdb
2.
2
치는 Grafana 홈페이지를참고한다
2.1. 패키지 설치
2.2. 서비스 등록 및 실행
2.3. 설치 확인
http://${SERVER_IP_OR_HOSTNAME}:3000 에 정상적으로 접속되는지 확인한다.
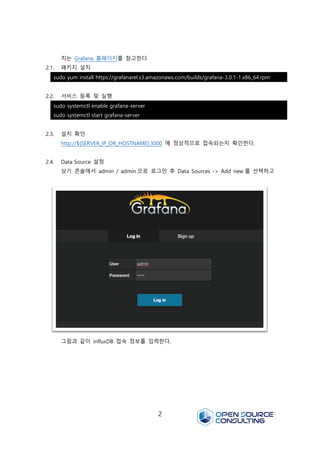
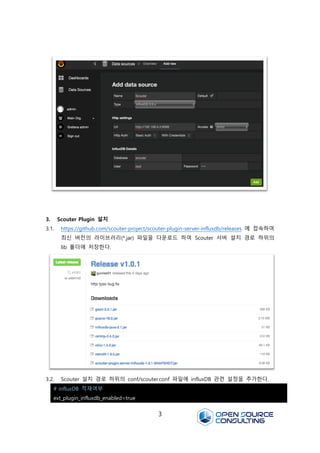
2.4. Data Source 설정
상기 콘솔에서 admin / admin 으로 로그인 후 Data Sources -> Add new 를 선택하고
그림과 같이 influxDB 접속 정보를 입력한다.
sudo yum install https://grafanarel.s3.amazonaws.com/builds/grafana-3.0.1-1.x86_64.rpm
sudo systemctl enable grafana-server
sudo systemctl start grafana-server
3.
3
3. Scouter Plugin설치
3.1. https://github.com/scouter-project/scouter-plugin-server-influxdb/releases 에 접속하여
최신 버전의 라이브러리(*.jar) 파일을 다운로드 하여 Scouter 서버 설치 경로 하위의
lib 폴더에 저장한다.
3.2. Scouter 설치 경로 하위의 conf/scouter.conf 파일에 influxDB 관련 설정을 추가한다.
# influxDB 적재여부
ext_plugin_influxdb_enabled=true
4.
4
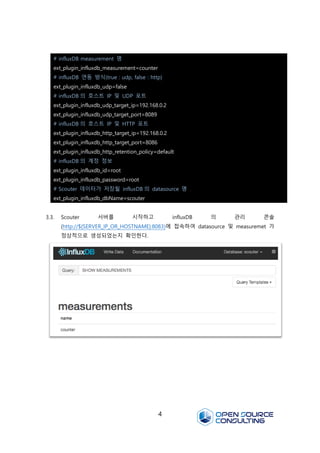
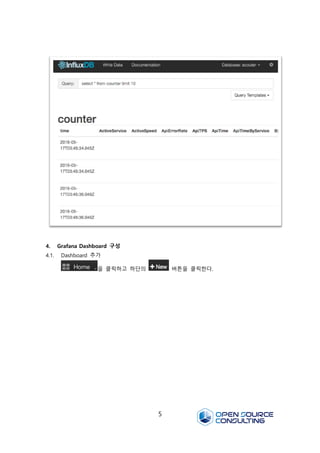
3.3. Scouter 서버를시작하고 influxDB 의 관리 콘솔
(http://${SERVER_IP_OR_HOSTNAME}:8083)에 접속하여 datasource 및 measuremet 가
정상적으로 생성되었는지 확인한다.
# influxDB measurement 명
ext_plugin_influxdb_measurement=counter
# influxDB 연동 방식(true : udp, false : http)
ext_plugin_influxdb_udp=false
# influxDB 의 호스트 IP 및 UDP 포트
ext_plugin_influxdb_udp_target_ip=192.168.0.2
ext_plugin_influxdb_udp_target_port=8089
# influxDB 의 호스트 IP 및 HTTP 포트
ext_plugin_influxdb_http_target_ip=192.168.0.2
ext_plugin_influxdb_http_target_port=8086
ext_plugin_influxdb_http_retention_policy=default
# influxDB 의 계정 정보
ext_plugin_influxdb_id=root
ext_plugin_influxdb_password=root
# Scouter 데이터가 저장될 influxDB 의 datasource 명
ext_plugin_influxdb_dbName=scouter
6
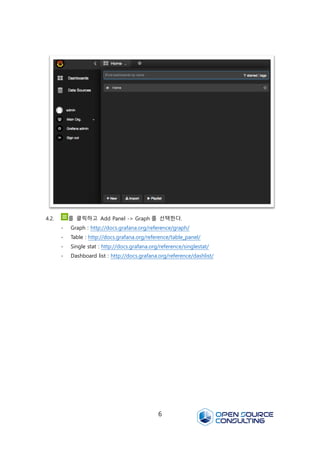
4.2. 를 클릭하고Add Panel -> Graph 를 선택한다.
- Graph : http://docs.grafana.org/reference/graph/
- Table : http://docs.grafana.org/reference/table_panel/
- Single stat : http://docs.grafana.org/reference/singlestat/
- Dashboard list : http://docs.grafana.org/reference/dashlist/
7.
7
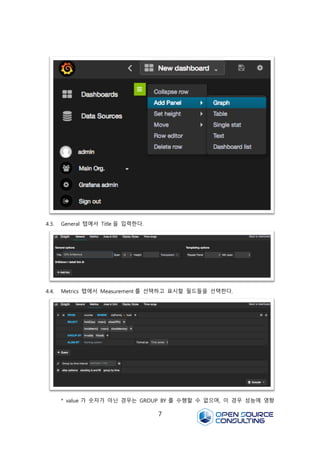
4.3. General 탭에서Title 을 입력한다.
4.4. Metrics 탭에서 Measurement 를 선택하고 표시할 필드들을 선택한다.
* value 가 숫자가 아닌 경우는 GROUP BY 를 수행할 수 없으며, 이 경우 성능에 영향
8.
8
을 줄 수있으므로 GROUP BY 절과 Aggregation function 을 사용할 수 있도록 한다.
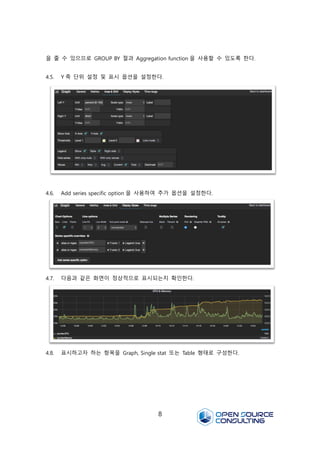
4.5. Y 축 단위 설정 및 표시 옵션을 설정한다.
4.6. Add series specific option 을 사용하여 추가 옵션을 설정한다.
4.7. 다음과 같은 화면이 정상적으로 표시되는지 확인한다.
4.8. 표시하고자 하는 항목을 Graph, Single stat 또는 Table 형태로 구성한다.
![1
Scouter 와 InfluxDB – Grafana 연동 가이드
본 문서에서는 Scouter 의 모니터링 데이터를 오픈소스 시계열 DB 인 InfluxDB 에 적재하고
Grafana 를 이용하여 시각화 하는 방법에 대해서 가이드 한다. 사전에 Scouter 가 설치되어
있어야 하며, Scouter 의 설치가 되어 있지 않다면 Quick Start Guide 를 참고하여 환경을 구
성한다.
1. InfluxDB 설치
본 문서에서는 RPM Based Linux 를 기반으로 설명하며, 타 OS Architecture 에 대한 설
치는 InfluxDB 홈페이지를 참고한다.
1.1. 저장소 등록
1.2. 패키지 설치
1.3. 서비스 등록 및 실행
1.4. 설치 확인
http://${SERVER_IP_OR_HOSTNAME}:8083 에 정상적으로 접속되는지 확인한다.
* InfluxDB 는 8083, 8086 두 개의 포트를 사용하여, 방화벽이 동작할 경우 해당 포트
를 추가해야 한다. 또한 UDP 를 사용한 데이터 적재 기능을 사용할 경우
/etc/influxdb/influxdb.conf 파일에서 해당 기능을 활성화 시키고 influxdb 서비스를 재
구동한다.
2. Grafana 설치
본 문서에서는 RPM Based Linux 를 기반으로 설명하며, 타 OS Architecture 에 대한 설
cat <<EOF | sudo tee /etc/yum.repos.d/influxdb.repo
[influxdb]
name = InfluxDB Repository - RHEL $releasever
baseurl = https://repos.influxdata.com/rhel/$releasever/$basearch/stable
enabled = 1
gpgcheck = 1
gpgkey = https://repos.influxdata.com/influxdb.key
EOF
sudo yum install influxdb
sudo systemctl enable influxdb
sudo systemctl start influxdb](https://image.slidesharecdn.com/scouterinfluxdbgrafana-160520014222/85/Scouter-influx-db-grafana-1-320.jpg)

![[오픈소스컨설팅]Scouter 설치 및 사용가이드(JBoss)](https://cdn.slidesharecdn.com/ss_thumbnails/scouterjboss-160310001021-thumbnail.jpg?width=640&height=640&fit=bounds)

![[오픈소스컨설팅] 스카우터 사용자 가이드 2020](https://cdn.slidesharecdn.com/ss_thumbnails/2020scouteruserguide-200122014357-thumbnail.jpg?width=640&height=640&fit=bounds)


![[AWS Dev Day] 실습워크샵 | Amazon EKS 핸즈온 워크샵](https://cdn.slidesharecdn.com/ss_thumbnails/awsdevdayseoul2019-amazonekshands-onworkshopv0-190930092336-thumbnail.jpg?width=640&height=640&fit=bounds)


![[오픈소스컨설팅] EFK Stack 소개와 설치 방법](https://cdn.slidesharecdn.com/ss_thumbnails/elasticstack-210712042246-thumbnail.jpg?width=640&height=640&fit=bounds)


![[213]monitoringwithscouter 이건희](https://cdn.slidesharecdn.com/ss_thumbnails/213monitoringwithscouter-161025011551-thumbnail.jpg?width=640&height=640&fit=bounds)

![[NDC18] 야생의 땅 듀랑고의 데이터 엔지니어링 이야기: 로그 시스템 구축 경험 공유 (2부)](https://cdn.slidesharecdn.com/ss_thumbnails/ndc2018-2-180430180517-thumbnail.jpg?width=640&height=640&fit=bounds)
![[2018] NHN 모니터링의 현재와 미래 for 인프라 엔지니어](https://cdn.slidesharecdn.com/ss_thumbnails/cloudinfra02-190131073314-thumbnail.jpg?width=640&height=640&fit=bounds)


![[D2 COMMUNITY] Spark User Group - 스파크를 통한 딥러닝 이론과 실제](https://cdn.slidesharecdn.com/ss_thumbnails/520160211-160307085845-thumbnail.jpg?width=640&height=640&fit=bounds)


![[오픈소스컨설팅] 아파치톰캣 운영가이드 v1.3](https://cdn.slidesharecdn.com/ss_thumbnails/opensourceconsultingtomcatoperationguidev1-181113020525-thumbnail.jpg?width=640&height=640&fit=bounds)
![[오픈소스컨설팅]쿠버네티스를 활용한 개발환경 구축](https://cdn.slidesharecdn.com/ss_thumbnails/opensourceconsutingkubernetesv0-191010000815-thumbnail.jpg?width=640&height=640&fit=bounds)
![[오픈소스컨설팅] Open Stack Ceph, Neutron, HA, Multi-Region](https://cdn.slidesharecdn.com/ss_thumbnails/openstackoscv0-160718105826-thumbnail.jpg?width=640&height=640&fit=bounds)
![[오픈소스컨설팅] 프로메테우스 모니터링 살펴보고 구성하기](https://cdn.slidesharecdn.com/ss_thumbnails/oscprometheus-190422050231-thumbnail.jpg?width=640&height=640&fit=bounds)
![[오픈소스컨설팅] Ansible을 활용한 운영 자동화 교육](https://cdn.slidesharecdn.com/ss_thumbnails/ansibleautomationv1-190221013416-thumbnail.jpg?width=640&height=640&fit=bounds)
![[오픈소스컨설팅] Docker를 활용한 Gitlab CI/CD 구성 테스트](https://cdn.slidesharecdn.com/ss_thumbnails/dockergitlabci-cd-180103202327-thumbnail.jpg?width=640&height=640&fit=bounds)
![[오픈소스컨설팅]클라우드기반U2L마이그레이션 전략 및 고려사항](https://cdn.slidesharecdn.com/ss_thumbnails/u2l-171114134117-thumbnail.jpg?width=640&height=640&fit=bounds)
![[오픈소스컨설팅]레드햇계열리눅스7 운영자가이드 - 기초편](https://cdn.slidesharecdn.com/ss_thumbnails/rhel7-160406045643-thumbnail.jpg?width=640&height=640&fit=bounds)
![[오픈소스컨설팅]Docker기초 실습 교육 20181113_v3](https://cdn.slidesharecdn.com/ss_thumbnails/oscdockereducation20181113hanv3-181113075418-thumbnail.jpg?width=640&height=640&fit=bounds)

![[오픈소스컨설팅] Red Hat ReaR (relax and-recover) Quick Guide](https://cdn.slidesharecdn.com/ss_thumbnails/redhatrearrelax-and-recoverquickguidev1-170419093210-thumbnail.jpg?width=640&height=640&fit=bounds)
![[오픈소스컨설팅] 오픈소스 기반 솔루션 방향성 잡기](https://cdn.slidesharecdn.com/ss_thumbnails/solutionidea-210226024013-thumbnail.jpg?width=640&height=640&fit=bounds)
![[오픈소스컨설팅]systemd on RHEL7](https://cdn.slidesharecdn.com/ss_thumbnails/systemdrhel7-160405035049-thumbnail.jpg?width=640&height=640&fit=bounds)
![[오픈소스컨설팅]Docker on Kubernetes v1](https://cdn.slidesharecdn.com/ss_thumbnails/dockeronkubernetesv1-160830033537-thumbnail.jpg?width=640&height=640&fit=bounds)

![[오픈소스컨설팅] 2019년 클라우드 생존전략](https://cdn.slidesharecdn.com/ss_thumbnails/opensourceconsultingcloudstrategyv2-190109001332-thumbnail.jpg?width=640&height=640&fit=bounds)
![[오픈소스컨설팅]Atlassian JIRA Quick Guide](https://cdn.slidesharecdn.com/ss_thumbnails/jiraquickguidev2-160420123530-thumbnail.jpg?width=640&height=640&fit=bounds)
![[오픈소스컨설팅]ELK기반 장애예방시스템_구성_2016.12](https://cdn.slidesharecdn.com/ss_thumbnails/opensourceconsulting-elkv2-180716032900-thumbnail.jpg?width=640&height=640&fit=bounds)
![[오픈소스컨설팅] AWS re:Invent 2018 기계학습(ML)부분 후기](https://cdn.slidesharecdn.com/ss_thumbnails/reinventreview-181218230336-thumbnail.jpg?width=640&height=640&fit=bounds)
