Download as PDF, PPTX
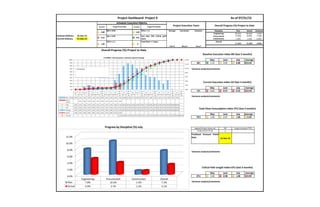

The document provides a project dashboard for Project X as of July 31, 2015. It includes metrics on schedule performance, progress by discipline, execution indices, and variance analysis. Overall project progress is 3.1% against a plan of 7.3%, with procurement lagging at 3.7% actual versus a 10.2% plan. Variance comments note a critical path length index of 0.99 and total float consumption index of 0.99, indicating schedule risks.


