Beginners Guide to TikTok for Search - Rachel Pearson - We are Tilt __ Bright...
San Antonio Veteran Landscape
1. COMMUNITY
DRIVING
IMPACT
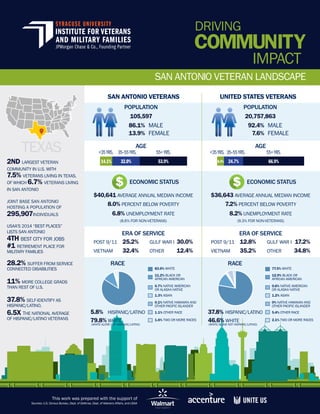
SAN ANTONIO VETERAN LANDSCAPE
TEXAS
2ND LARGEST VETERAN
COMMUNITY IN U.S. WITH
7.5% VETERANS LIVING IN TEXAS,
OF WHICH 6.7% VETERANS LIVING
IN SAN ANTONIO
JOINT BASE SAN ANTONIO
HOSTING A POPULATION OF
295,907INDIVIDUALS
USAA’S 2014 “BEST PLACES”
LISTS SAN ANTONIO
4TH BEST CITY FOR JOBS
#1 RETIREMENT PLACE FOR
MILITARY FAMILIES
28.2% SUFFER FROM SERVICE
CONNECTED DISABILITIES
11% MORE COLLEGE GRADS
THAN REST OF U.S.
37.8% SELF-IDENTIFY AS
HISPANIC/LATINO,
6.5X THE NATIONAL AVERAGE
OF HISPANIC/LATINO VETERANS
SAN ANTONIO VETERANS UNITED STATES VETERANS
POPULATION
86.1% MALE
13.9% FEMALE
105,597
POPULATION
92.4% MALE
7.6% FEMALE
20,757,863
AGE
<35YRS. 35–55YRS. 55+YRS.
14.1% 32.0% 53.9%
AGE
ECONOMIC STATUS
$40,641 AVERAGE ANNUAL MEDIAN INCOME
8.0% PERCENT BELOW POVERTY
6.8% UNEMPLOYMENT RATE
(8.6% FOR NON-VETERANS)
ECONOMIC STATUS
$36,643 AVERAGE ANNUAL MEDIAN INCOME
7.2% PERCENT BELOW POVERTY
8.2% UNEMPLOYMENT RATE
(9.3% FOR NON-VETERANS)
ERA OF SERVICE
POST 9/11 25.2% GULF WAR I 30.0%
VIETNAM 32.4% OTHER 12.4%
ERA OF SERVICE
POST 9/11 12.8% GULF WAR I 17.2%
VIETNAM 35.2% OTHER 34.8%
RACE
5.8% HISPANIC/LATINO
79.8% WHITE
RACE
This work was prepared with the support of
<35YRS. 35–55YRS. 55+YRS.
8.4% 24.7% 66.9%
(WHITE ALONE NOT HISPANIC/LATINO)
37.8% HISPANIC/LATINO
46.6% WHITE
(WHITE ALONE NOT HISPANIC/LATINO)
1.6%
Two
or
More
Races
83.9%
White
11.2%
Black
or
African
American
0.7%
American
Indian
or
Alaska
NaDve
1.3
%
Asian
0.1%
NaDve
Hawaiian
and
Other
Pacific
Islander
1.1%
Some
Other
Race
2.1%
Two
or
More
Races
77.5%
White
12.9%
Black
or
African
American
0.6%
American
Indian
or
Alaska
NaCve
1.2
%
Asian
0%
NaCve
Hawaiian
and
Other
Pacific
Islander
5.4%
Some
Other
Race
83.9% WHITE
11.2% BLACK OR
AFRICAN AMERICAN
0.7% NATIVE AMERICAN
OR ALASKA NATIVE
1.3% ASIAN
0.1% NATIVE HAWAIIAN AND
OTHER PACIFIC ISLANDER
1.1% OTHER RACE
1.6% TWO OR MORE RACES
77.5% WHITE
12.9% BLACK OR
AFRICAN AMERICAN
0.6% NATIVE AMERICAN
OR ALASKA NATIVE
1.2% ASIAN
0% NATIVE HAWAIIAN AND
OTHER PACIFIC ISLANDER
5.4% OTHER RACE
2.1% TWO OR MORE RACES
Sources: U.S. Census Bureau, Dept. of Defense, Dept. of Veterans Affairs, and USAA
2. REGISTERED 501(C)(3) NON-PROFITS
VETERAN AND MILITARY SPECIFIC
NON-PROFITS (W30)
COMMUNITY
DRIVING
IMPACT
1,632
SAN ANTONIO NON-PROFIT LANDSCAPE
TEXAS
2 SAN ANTONIO NON-PROFITS
AWARDED SUPPORTIVE SERVICES FOR
VETERAN FAMILIES (SSVF) FUNDING
IN 2015
1.7% NON-PROFITS ARE VETERAN-
SPECIFIC DESPITE BEXAR COUNTY
BEING THE SECOND LARGEST
VETERAN COMMUNITY IN TEXAS
HOME TO 2 MAJOR VETERAN
AND MILITARY FAMILY SERVING
COLLABORATIVES
MAJORITY OF SAN ANTONIO’S
NON-PROFITS OPERATE IN THESE
ZIP CODE AREAS:
78229 (POPULATION 29,591)
24.5% BELOW FEDERAL POVERTY
LEVEL
78216 (POPULATION 38,846)
14.9% BELOW FEDERAL POVERTY
LEVEL
78201 (POPULATION 42,759)
20.3% BELOW FEDERAL POVERTY
LEVEL; 85.1% ARE HISPANIC
SAN ANTONIO NON-PROFITS BY NUMBERS
27
NON-PROFITS BY SERVICE AREAS
1.0% EMPLOYMENT
NON-PROFITS ANNUAL REVENUE
(IN MILLIONS OF DOLLARS)
COMMUNITY
HOUSING
FAMILY SUPPORT
EMPLOYMENT
EDUCATION
HEALTH AND WELLNESS 10.13
2.41
5.06
2.11
1.71
1.28
Health
&
Welness
Educa0on
Employment
Family
Support
Housing
Community
1.28
1.71
2.11
5.06
2.41
10.13
VETERAN
EDUCATION
EXPENDITURES
12%OF VA’S SPENDING IN BEXAR COUNTY GOES TOWARDS EDUCATION,
THE MOST SPENT IN TEXAS
13,298STUDENTS RECEIVING G.I. BILL BENEFITS
2SCHOOLS HAVE VETERAN SUCCESS
ON CAMPUS COUNSELORS
11OF SAN ANTONIO COLLEGES/UNIVERSITIES HAVE
STUDENT VETERAN ORGANIZATIONS
38
VA’S VETERANS HEALTH ADMINISTRATION
SERVED BY THE SOUTH TEXAS VETERANS HEALTH CARE SYSTEM
5
OUTPATIENT CLINICS
2
VET CENTERS
5
COMMUNITY-BASED
OUTPATIENT CLINICS
This work was prepared with the support of
31.0%
COMMUNITY
8.0% HOUSING
2.0% VETERAN SPECIFIC
12.0% HEALTH/WELLNESS
27.0% EDUCATION
19.0%
FAMILY SUPPORT