Download as PDF, PPTX


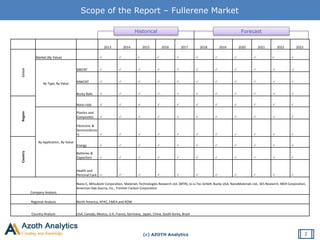

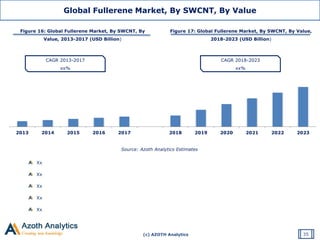
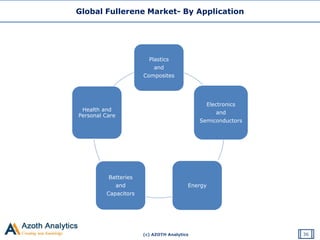
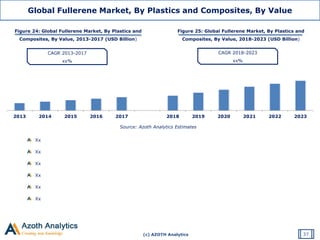
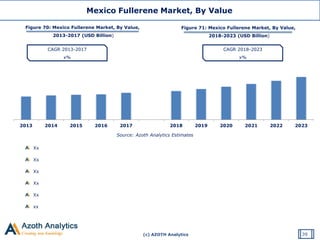
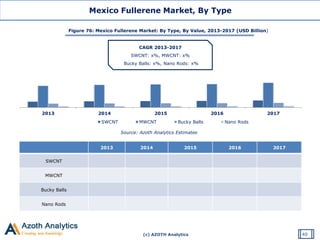
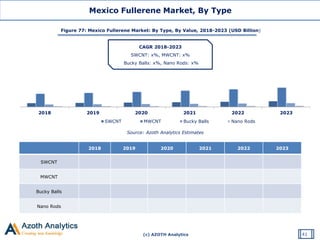
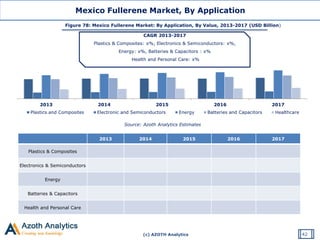

The document provides a comprehensive analysis of the global fullerene market, covering various types such as SWCNT, MWCNT, bucky balls, and nano rods, along with their applications in sectors including electronics, energy, and health. It includes historical data from 2013 to 2017 and forecasts until 2023 segmented by region and country, such as North America, APAC, EMEA, and ROW. Key companies in the market are also profiled, with strategic recommendations indicating that the APAC region is expected to witness the highest growth during the forecast period.


![Global Hepatitis B Virus [HBV] Treatment Market: Opportunities and Forecast (...](https://cdn.slidesharecdn.com/ss_thumbnails/globalhepatitisbhpvtreatmentmarketreport-180220055404-thumbnail.jpg?width=640&height=640&fit=bounds)


