Downloaded 16 times
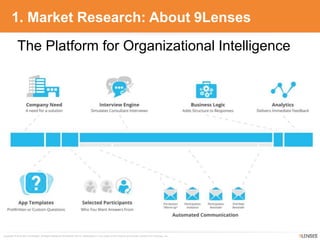
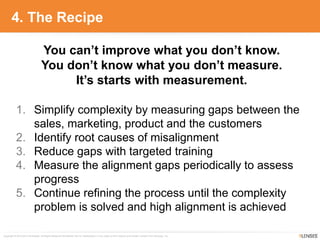
![Copyright © 2010-2014 9Lenses®, All Rights Reserved Worldwide. Not for redistribution in any outlet or form without prior written consent from 9Lenses, Inc.
5. Best Practices: Training
Determine
Specific
Gaps
Implement
Training
Follow Up
Analysis
Example: Implement a roadmap for continuous feedback & training.
“I would personally like to be invited to
[local] in person training sessions
rather than any Computer based or
Instructor led trainings.”
“I would like to spend more face to face
time with the Reps in my territory to learn
the benefits and business value that
our solution can bring.”
“I think ongoing training to learn new
product features and capabilities is
needed on a regular basis.”](https://image.slidesharecdn.com/salesalignmentslideshare-141230154553-conversion-gate02/85/Sales-Alignment-18-320.jpg)

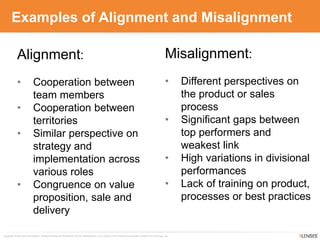
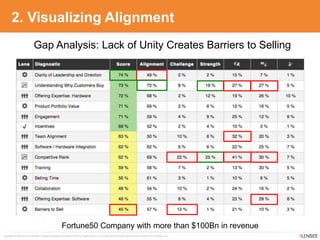
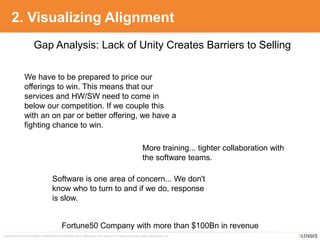
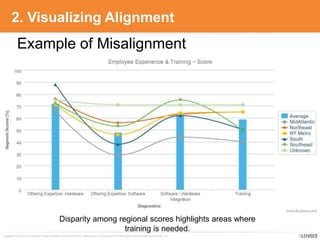
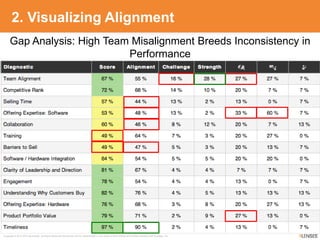
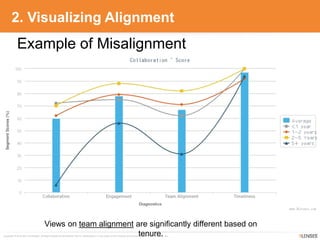
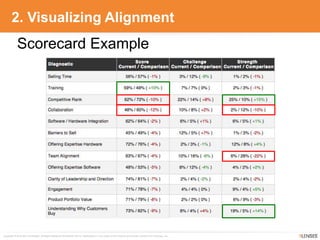
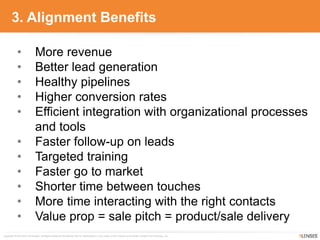
The document discusses sales alignment and how the SaaS company 9Lenses helps companies achieve it. It notes that misalignment between sales, marketing, and other teams costs companies 10% of revenue on average. 9Lenses measures various data points to identify alignment gaps and determine how to close deals faster through targeted training. It provides examples of alignment visualizations and best practices for periodic assessment and refinement of alignment.


![[9Lenses + CSC] – Transforming the Way you Discover Organizational Insights](https://cdn.slidesharecdn.com/ss_thumbnails/cinonyc-transformingthewayyoudiscoverorganizationalinsights-141205120853-conversion-gate02-thumbnail.jpg?width=640&height=640&fit=bounds)

