The document summarizes national minimum wage levels in EU member states as of January 2017. It finds that minimum wages were below €500 per month in 10 eastern member states, between €500-€1000 in 5 southern states, and over €1000 in 7 western and northern states. When adjusted for cost of living differences using purchasing power standards, the gap in minimum wages was reduced from a ratio of 1 to 9 euros to a ratio of 1 to 3. Minimum wages were closest to median earnings in Portugal, France and Slovenia at over 60% of the median. Compared to 2008 levels, minimum wages increased everywhere except Greece, with some eastern states seeing rises of over 60%.
Bratislava, 19. jún 2013 – Podľa tohtoročnej štúdie New Direction – The Foundation for European Reform a Institut économique Molinari Tax Burden of Typical Workers in the EU 27 pripadá deň daňového oslobodenia (Tax Liberation Day) na Slovensku na 20. júna. Deň daňového oslobodenia sa odvíja od základnej daňovo-odvodovej záťaže príjmovo priemerného zamestnanca, ktorá na Slovensku dosahuje takmer 46,7% mzdových nákladov, čo je viac ako priemer v daňami a odvodmi preťaženej EÚ.
Viac na www.konzervativizmus.sk
June 2010 edition. Economic insight into the current EMEA region (europe, africa and middle east). Regional Statistics, employment news and current legislation affecting the jobs economy.
American Journal of Multidisciplinary Research and Development is indexed, refereed and peer-reviewed journal, which is designed to publish research articles.
American Journal of Multidisciplinary Research and Development is indexed, refereed and peer-reviewed journal, which is designed to publish research articles.
This paper explores wage and income disparities in 14 EU member states during 1994–2001 by using the ECHP data. The results reveal that there are noticeable differences in wages across EU countries measured at both gross and net level. There is no evidence for wage convergence across countries over the period, which indicates that if convergence does exists, the process is rather slow. There are remarkable differences in the income levels across 14 EU member states. Within countries, however, income disparities seem to have declined in most cases. By using household-level data it is also possible to estimate a Gini coefficient at the level of the European Union. This enables us to compare income disparities between the United States and the EU. Based on the results, income disparities across households in the European Union are substantially smaller than those in the US.
podľa tohtoročnej štúdie New Direction – the Foundation for European Reform a Institut économique Molinari (IEM) pripadol deň daňového oslobodenia (Tax Liberation Day) na Slovensku na 20. júna. Je to rovnaký deň ako v minulom roku, aj keď základné daňovo-odvodové zaťaženie priemerného zamestnanca na Slovensku (podľa ktorého sa Počíta tento deň) sa nepatrne zvýšil z 46,65 % v roku 2013 na aktuálnych 46,73% k nákladom práce. Takéto zaťaženie slovenských zamestnancov daňou z príjmu, DPH a odvodmi je takmer o 1,5 percentuálny bod vyššie ako je priemer v EÚ. Viac na www.konzervativizmus.sk
Tax Aspects of Gender Budgeting - Margit SCHRATZENSTALLER (Austria)OECD Governance
Presentation given at the OECD Gender Budgeting Experts Meeting, Vienna, Austria. 18-19 June 2018
For more information see http://www.oecd.org/gov/budgeting/gender-budgeting-experts-meeting-2018.htm
What website can I sell pi coins securely.DOT TECH
Currently there are no website or exchange that allow buying or selling of pi coins..
But you can still easily sell pi coins, by reselling it to exchanges/crypto whales interested in holding thousands of pi coins before the mainnet launch.
Who is a pi merchant?
A pi merchant is someone who buys pi coins from miners and resell to these crypto whales and holders of pi..
This is because pi network is not doing any pre-sale. The only way exchanges can get pi is by buying from miners and pi merchants stands in between the miners and the exchanges.
How can I sell my pi coins?
Selling pi coins is really easy, but first you need to migrate to mainnet wallet before you can do that. I will leave the telegram contact of my personal pi merchant to trade with.
Tele-gram.
@Pi_vendor_247
Introduction to Indian Financial System ()Avanish Goel
The financial system of a country is an important tool for economic development of the country, as it helps in creation of wealth by linking savings with investments.
It facilitates the flow of funds form the households (savers) to business firms (investors) to aid in wealth creation and development of both the parties
More Related Content
Similar to Salarios mínimos nacionales en la ue 2017
June 2010 edition. Economic insight into the current EMEA region (europe, africa and middle east). Regional Statistics, employment news and current legislation affecting the jobs economy.
American Journal of Multidisciplinary Research and Development is indexed, refereed and peer-reviewed journal, which is designed to publish research articles.
American Journal of Multidisciplinary Research and Development is indexed, refereed and peer-reviewed journal, which is designed to publish research articles.
This paper explores wage and income disparities in 14 EU member states during 1994–2001 by using the ECHP data. The results reveal that there are noticeable differences in wages across EU countries measured at both gross and net level. There is no evidence for wage convergence across countries over the period, which indicates that if convergence does exists, the process is rather slow. There are remarkable differences in the income levels across 14 EU member states. Within countries, however, income disparities seem to have declined in most cases. By using household-level data it is also possible to estimate a Gini coefficient at the level of the European Union. This enables us to compare income disparities between the United States and the EU. Based on the results, income disparities across households in the European Union are substantially smaller than those in the US.
podľa tohtoročnej štúdie New Direction – the Foundation for European Reform a Institut économique Molinari (IEM) pripadol deň daňového oslobodenia (Tax Liberation Day) na Slovensku na 20. júna. Je to rovnaký deň ako v minulom roku, aj keď základné daňovo-odvodové zaťaženie priemerného zamestnanca na Slovensku (podľa ktorého sa Počíta tento deň) sa nepatrne zvýšil z 46,65 % v roku 2013 na aktuálnych 46,73% k nákladom práce. Takéto zaťaženie slovenských zamestnancov daňou z príjmu, DPH a odvodmi je takmer o 1,5 percentuálny bod vyššie ako je priemer v EÚ. Viac na www.konzervativizmus.sk
Tax Aspects of Gender Budgeting - Margit SCHRATZENSTALLER (Austria)OECD Governance
Presentation given at the OECD Gender Budgeting Experts Meeting, Vienna, Austria. 18-19 June 2018
For more information see http://www.oecd.org/gov/budgeting/gender-budgeting-experts-meeting-2018.htm
What website can I sell pi coins securely.DOT TECH
Currently there are no website or exchange that allow buying or selling of pi coins..
But you can still easily sell pi coins, by reselling it to exchanges/crypto whales interested in holding thousands of pi coins before the mainnet launch.
Who is a pi merchant?
A pi merchant is someone who buys pi coins from miners and resell to these crypto whales and holders of pi..
This is because pi network is not doing any pre-sale. The only way exchanges can get pi is by buying from miners and pi merchants stands in between the miners and the exchanges.
How can I sell my pi coins?
Selling pi coins is really easy, but first you need to migrate to mainnet wallet before you can do that. I will leave the telegram contact of my personal pi merchant to trade with.
Tele-gram.
@Pi_vendor_247
Introduction to Indian Financial System ()Avanish Goel
The financial system of a country is an important tool for economic development of the country, as it helps in creation of wealth by linking savings with investments.
It facilitates the flow of funds form the households (savers) to business firms (investors) to aid in wealth creation and development of both the parties
The Evolution of Non-Banking Financial Companies (NBFCs) in India: Challenges...beulahfernandes8
Role in Financial System
NBFCs are critical in bridging the financial inclusion gap.
They provide specialized financial services that cater to segments often neglected by traditional banks.
Economic Impact
NBFCs contribute significantly to India's GDP.
They support sectors like micro, small, and medium enterprises (MSMEs), housing finance, and personal loans.
Currently pi network is not tradable on binance or any other exchange because we are still in the enclosed mainnet.
Right now the only way to sell pi coins is by trading with a verified merchant.
What is a pi merchant?
A pi merchant is someone verified by pi network team and allowed to barter pi coins for goods and services.
Since pi network is not doing any pre-sale The only way exchanges like binance/huobi or crypto whales can get pi is by buying from miners. And a merchant stands in between the exchanges and the miners.
I will leave the telegram contact of my personal pi merchant. I and my friends has traded more than 6000pi coins successfully
Tele-gram
@Pi_vendor_247
What price will pi network be listed on exchangesDOT TECH
The rate at which pi will be listed is practically unknown. But due to speculations surrounding it the predicted rate is tends to be from 30$ — 50$.
So if you are interested in selling your pi network coins at a high rate tho. Or you can't wait till the mainnet launch in 2026. You can easily trade your pi coins with a merchant.
A merchant is someone who buys pi coins from miners and resell them to Investors looking forward to hold massive quantities till mainnet launch.
I will leave the telegram contact of my personal pi vendor to trade with.
@Pi_vendor_247
what is the future of Pi Network currency.DOT TECH
The future of the Pi cryptocurrency is uncertain, and its success will depend on several factors. Pi is a relatively new cryptocurrency that aims to be user-friendly and accessible to a wide audience. Here are a few key considerations for its future:
Message: @Pi_vendor_247 on telegram if u want to sell PI COINS.
1. Mainnet Launch: As of my last knowledge update in January 2022, Pi was still in the testnet phase. Its success will depend on a successful transition to a mainnet, where actual transactions can take place.
2. User Adoption: Pi's success will be closely tied to user adoption. The more users who join the network and actively participate, the stronger the ecosystem can become.
3. Utility and Use Cases: For a cryptocurrency to thrive, it must offer utility and practical use cases. The Pi team has talked about various applications, including peer-to-peer transactions, smart contracts, and more. The development and implementation of these features will be essential.
4. Regulatory Environment: The regulatory environment for cryptocurrencies is evolving globally. How Pi navigates and complies with regulations in various jurisdictions will significantly impact its future.
5. Technology Development: The Pi network must continue to develop and improve its technology, security, and scalability to compete with established cryptocurrencies.
6. Community Engagement: The Pi community plays a critical role in its future. Engaged users can help build trust and grow the network.
7. Monetization and Sustainability: The Pi team's monetization strategy, such as fees, partnerships, or other revenue sources, will affect its long-term sustainability.
It's essential to approach Pi or any new cryptocurrency with caution and conduct due diligence. Cryptocurrency investments involve risks, and potential rewards can be uncertain. The success and future of Pi will depend on the collective efforts of its team, community, and the broader cryptocurrency market dynamics. It's advisable to stay updated on Pi's development and follow any updates from the official Pi Network website or announcements from the team.
If you are looking for a pi coin investor. Then look no further because I have the right one he is a pi vendor (he buy and resell to whales in China). I met him on a crypto conference and ever since I and my friends have sold more than 10k pi coins to him And he bought all and still want more. I will drop his telegram handle below just send him a message.
@Pi_vendor_247
Exploring Abhay Bhutada’s Views After Poonawalla Fincorp’s Collaboration With...beulahfernandes8
The financial landscape in India has witnessed a significant development with the recent collaboration between Poonawalla Fincorp and IndusInd Bank.
The launch of the co-branded credit card, the IndusInd Bank Poonawalla Fincorp eLITE RuPay Platinum Credit Card, marks a major milestone for both entities.
This strategic move aims to redefine and elevate the banking experience for customers.
The secret way to sell pi coins effortlessly.DOT TECH
Well as we all know pi isn't launched yet. But you can still sell your pi coins effortlessly because some whales in China are interested in holding massive pi coins. And they are willing to pay good money for it. If you are interested in selling I will leave a contact for you. Just telegram this number below. I sold about 3000 pi coins to him and he paid me immediately.
Telegram: @Pi_vendor_247
where can I find a legit pi merchant onlineDOT TECH
Yes. This is very easy what you need is a recommendation from someone who has successfully traded pi coins before with a merchant.
Who is a pi merchant?
A pi merchant is someone who buys pi network coins and resell them to Investors looking forward to hold thousands of pi coins before the open mainnet.
I will leave the telegram contact of my personal pi merchant to trade with
@Pi_vendor_247
The European Unemployment Puzzle: implications from population agingGRAPE
We study the link between the evolving age structure of the working population and unemployment. We build a large new Keynesian OLG model with a realistic age structure, labor market frictions, sticky prices, and aggregate shocks. Once calibrated to the European economy, we quantify the extent to which demographic changes over the last three decades have contributed to the decline of the unemployment rate. Our findings yield important implications for the future evolution of unemployment given the anticipated further aging of the working population in Europe. We also quantify the implications for optimal monetary policy: lowering inflation volatility becomes less costly in terms of GDP and unemployment volatility, which hints that optimal monetary policy may be more hawkish in an aging society. Finally, our results also propose a partial reversal of the European-US unemployment puzzle due to the fact that the share of young workers is expected to remain robust in the US.
How to get verified on Coinbase Account?_.docxBuy bitget
t's important to note that buying verified Coinbase accounts is not recommended and may violate Coinbase's terms of service. Instead of searching to "buy verified Coinbase accounts," follow the proper steps to verify your own account to ensure compliance and security.
how to sell pi coins in all Africa Countries.DOT TECH
Yes. You can sell your pi network for other cryptocurrencies like Bitcoin, usdt , Ethereum and other currencies And this is done easily with the help from a pi merchant.
What is a pi merchant ?
Since pi is not launched yet in any exchange. The only way you can sell right now is through merchants.
A verified Pi merchant is someone who buys pi network coins from miners and resell them to investors looking forward to hold massive quantities of pi coins before mainnet launch in 2026.
I will leave the telegram contact of my personal pi merchant to trade with.
@Pi_vendor_247
US Economic Outlook - Being Decided - M Capital Group August 2021.pdfpchutichetpong
The U.S. economy is continuing its impressive recovery from the COVID-19 pandemic and not slowing down despite re-occurring bumps. The U.S. savings rate reached its highest ever recorded level at 34% in April 2020 and Americans seem ready to spend. The sectors that had been hurt the most by the pandemic specifically reduced consumer spending, like retail, leisure, hospitality, and travel, are now experiencing massive growth in revenue and job openings.
Could this growth lead to a “Roaring Twenties”? As quickly as the U.S. economy contracted, experiencing a 9.1% drop in economic output relative to the business cycle in Q2 2020, the largest in recorded history, it has rebounded beyond expectations. This surprising growth seems to be fueled by the U.S. government’s aggressive fiscal and monetary policies, and an increase in consumer spending as mobility restrictions are lifted. Unemployment rates between June 2020 and June 2021 decreased by 5.2%, while the demand for labor is increasing, coupled with increasing wages to incentivize Americans to rejoin the labor force. Schools and businesses are expected to fully reopen soon. In parallel, vaccination rates across the country and the world continue to rise, with full vaccination rates of 50% and 14.8% respectively.
However, it is not completely smooth sailing from here. According to M Capital Group, the main risks that threaten the continued growth of the U.S. economy are inflation, unsettled trade relations, and another wave of Covid-19 mutations that could shut down the world again. Have we learned from the past year of COVID-19 and adapted our economy accordingly?
“In order for the U.S. economy to continue growing, whether there is another wave or not, the U.S. needs to focus on diversifying supply chains, supporting business investment, and maintaining consumer spending,” says Grace Feeley, a research analyst at M Capital Group.
While the economic indicators are positive, the risks are coming closer to manifesting and threatening such growth. The new variants spreading throughout the world, Delta, Lambda, and Gamma, are vaccine-resistant and muddy the predictions made about the economy and health of the country. These variants bring back the feeling of uncertainty that has wreaked havoc not only on the stock market but the mindset of people around the world. MCG provides unique insight on how to mitigate these risks to possibly ensure a bright economic future.
US Economic Outlook - Being Decided - M Capital Group August 2021.pdf
Salarios mínimos nacionales en la ue 2017
1. 25/2017 - 10 February 2017
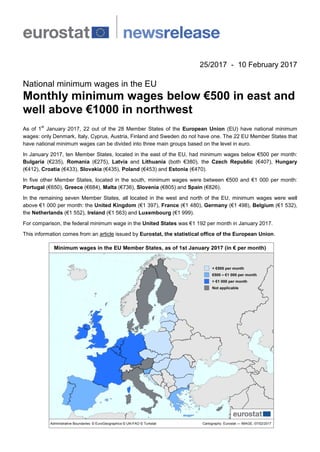
National minimum wages in the EU
Monthly minimum wages below €500 in east and
well above €1000 in northwest
As of 1
st
January 2017, 22 out of the 28 Member States of the European Union (EU) have national minimum
wages: only Denmark, Italy, Cyprus, Austria, Finland and Sweden do not have one. The 22 EU Member States that
have national minimum wages can be divided into three main groups based on the level in euro.
In January 2017, ten Member States, located in the east of the EU, had minimum wages below €500 per month:
Bulgaria (€235), Romania (€275), Latvia and Lithuania (both €380), the Czech Republic (€407), Hungary
(€412), Croatia (€433), Slovakia (€435), Poland (€453) and Estonia (€470).
In five other Member States, located in the south, minimum wages were between €500 and €1 000 per month:
Portugal (€650), Greece (€684), Malta (€736), Slovenia (€805) and Spain (€826).
In the remaining seven Member States, all located in the west and north of the EU, minimum wages were well
above €1 000 per month: the United Kingdom (€1 397), France (€1 480), Germany (€1 498), Belgium (€1 532),
the Netherlands (€1 552), Ireland (€1 563) and Luxembourg (€1 999).
For comparison, the federal minimum wage in the United States was €1 192 per month in January 2017.
This information comes from an article issued by Eurostat, the statistical office of the European Union.
2. Gap reduced from 1 to 9 in euro to 1 to 3 when minimum wages are expressed in PPS
Across the 22 Member States concerned, minimum wages range from less than 300 euros per month in both
Bulgaria (€235) and Romania (€275) to just below 2 000 euros a month in Luxembourg (€1 999). In other words,
the highest minimum wage in the EU is around 9 times the lowest.
Minimum wages in the EU Member States, as of 1st
January 2017
(in € per month)
0 500 1 000 1 500 2 000
Bulgaria
Romania
Latvia
Lithuania
Czech Republic
Hungary
Croatia
Slovakia
Poland
Estonia
Portugal
Greece
Malta
Slovenia
Spain
United Kingdom
France
Germany
Belgium
Netherlands
Ireland
Luxembourg
However, the disparities in minimum wages across the EU States are considerably smaller once price level
differences are eliminated: minimum wages in those Member States with relatively lower price levels become
relatively higher when expressed in purchasing power standard (PPS), and relatively lower in those Member States
with higher price levels. The gap is reduced to a ratio of about 1:3, ranging from 501 PPS per month in Bulgaria to
1 659 PPS in Luxembourg.
Minimum wages closest to median earnings in Portugal, France and Slovenia
Minimum wages may also be measured in relative terms, i.e. as a proportion of the median gross monthly earnings.
In 2014, among Member States concerned and for which data on median earnings are available, minimum wages
were above 60% of the median gross monthly earnings in only three Member States: Portugal (64%), France and
Slovenia (both 62%). In contrast, minimum wages were less than half of the median earnings in seven Member
States: the Czech Republic (39%), Estonia (40%), Ireland and Spain (both 45%), Slovakia (46%), Malta (48%)
and the United Kingdom (49%).
Minimum wages decreased compared with 2008 only in Greece
Compared with 2008, minimum wages in 2017, expressed in euro, increased in every Member State having a
national minimum wage, except Greece where they dropped by 14%. Between 2008 and 2017, minimum wages
doubled in Bulgaria (+109%) and Romania (+99%). In addition, Slovakia (+80%) as well as the three EU Baltic
Member States – Estonia (+69%), Latvia (+65%) and Lithuania (+64%) – also recorded significant increases.
3. Geographical information
In January 2017, Belgium, Bulgaria, the Czech Republic, Germany (since 1
st
January 2015), Estonia, Ireland, Greece, Spain,
France, Croatia, Latvia, Lithuania, Luxembourg, Hungary, Malta, the Netherlands, Poland, Portugal, Romania, Slovenia,
Slovakia, and the United Kingdom had a national minimum wage as defined below.
Methods and definitions
Minimum wage statistics, published bi-annually by Eurostat, refer to monthly national minimum wages applied on 1 January and
1 July each year. The national minimum wage usually applies to all employees, or at least to a large majority of employees in a
country. It is fixed at an hourly, weekly or monthly rate, and is enforced by law, often after consultation with social partners, or
directly by a national inter-sectorial agreement. Minimum wages are generally presented as monthly wage rates for gross
earnings, that is, before the deduction of income tax and social security contributions payable by the employee; these
deductions vary from country to country.
Country notes:
For those countries where the national minimum wage is not fixed at a monthly rate (for example, where minimum wages are
specified on an hourly or weekly basis) the level of the minimum wage is converted into a monthly rate according to conversion
factors supplied by the countries:
Germany: (hourly rate x 39.1 hours x 52 weeks) / 12 months (the value 39.1 hours results from the quarterly earnings survey
and relates to mean basic hours per week for full time employees in NACE Rev.2 sections B to S).The national minimum wage
is €8.84 per hour
Ireland: (hourly rate x 39 hours x 52 weeks) / 12 months. The national minimum wage is €9.25 per hour
France: (hourly rate x 35 hours x 52 weeks) / 12 months. The national minimum wage is €9.76 per hour
Malta: (weekly rate x 52 weeks) / 12 months. The national minimum wage is €169.76 per week
United Kingdom: (hourly rate x mean basic paid hours per week for full-time employees in all sectors x 52.18 weeks) / 12
months. The national minimum wage is £7.20 per hour
United States: (hourly rate x 40 hours x 52 weeks) / 12 months. The national minimum wage is $7.25 per hour
In addition, when the minimum wage is paid for more than 12 months per year (as in Greece, Spain and Portugal, where it is
paid for 14 months a year), data have been adjusted to take these payments into account.
Additional information, including country-specific information, is available on the Eurostat website here.
Data on national minimum wages are submitted to Eurostat in national currency. For the non-euro area countries, minimum
wages in national currencies are converted into euro by applying the monthly exchange rate as recorded at the end of the
previous month (for example, the rate at the end of December 2016 was used for calculating minimum wages in euro as of 1
January 2017). It should be noted that for those EU Member States outside of the euro area that have minimum wages
(Bulgaria, the Czech Republic, Croatia, Hungary, Poland, Romania and the United Kingdom), as well as for the United States,
the levels and developments of minimum wages expressed in euro may differ from those expressed in national currency, due to
exchange rate effects.
To remove the effect of differences in price levels between the countries, special conversion rates called purchasing power
parities (PPPs) are used. PPPs for household final consumption expenditure in each country are used to convert the monthly
minimum wages expressed in euro or national currencies to an artificial common unit called the purchasing power standard
(PPS).
Median earnings refer to the level of earnings which divides the employees into two equal groups: half earn less than the
median and half earn more. Data refer to the gross monthly earnings covering the wages and salaries earned by full-time and
part-time employees in the reference month (general October 2014) before any tax and social security contributions are
deduced. Wages and salaries include overtime pay, shift premiums, allowances, bonuses, commission, etc. The gross monthly
earnings of part-time employees have been converted into full-time units before being included in the average with the same
weight as full time employees. Excluding part-time employees from the calculation of median gross monthly earnings impacts
minimum wage/ median earnings. In particular, it would impact the ratio downwards by more than 5 percentage points for the
Netherlands (49% instead of 56%), Germany (47% instead of 53%) and the United Kingdom (44% instead of 49%).
The 2014 annual averages of the exchange rate were used in converting national (non-euro) currencies into euro. Median
earnings have been derived from Structure of Earnings Survey data (SES 2014) and calculated for all enterprises with more
than 10 employees except those belonging to NACE rev.2 section O (Public administration and defence; compulsory social
security). Apprentices are excluded.
For more information
Eurostat website section dedicated to earnings statistics.
Eurostat database on earnings.
Eurostat metadata on minimum wages.
Eurostat news release 246/2016 of 8 December 2016 on low-wage earners.
Eurostat news release of 248/2016 12 December 2016 on earnings distribution.
Eurostat Statistics Explained article on minimum wage statistics.
Issued by: Eurostat Press Office
Vincent BOURGEAIS
Tel: +352-4301-33 444
eurostat-pressoffice@ec.europa.eu
Production of data:
Ines KOLAKOVIC
Tel: +352-4301- 32 179
estat-earncost@ec.europa.eu
ec.europa.eu/eurostat/ @EU_Eurostat
Media requests: Eurostat media support / Tel: +352-4301-33 408 / eurostat-mediasupport@ec.europa.eu
4. Minimum wages in the EU
(in € per month)
1
st
January 2008 1
st
January 2014 1
st
January 2017 Change 2017/2008
Proportion of the
median earnings
(2014)
Belgium 1 310 1 502 1 532 +17% 52%
Bulgaria 112 174 235 +109% 57%
Czech Republic 300 310 407 +36% 39%
Denmark - - - - -
Germany
**
- 1 440*** 1 498 - 53%
Estonia 278 355 470 +69% 40%
Ireland
**
1 462 1 462 1 563 +7% 45%
Greece 794 684 684 -14% :
Spain 700 753 826 +18% 45%
France
**
1 280 1 445 1 480 +16% 62%
Croatia 380* 396 433 +14% :
Italy - - - - -
Cyprus - - - - -
Latvia 230 320 380 +65% 52%
Lithuania 232 290 380 +64% 52%
Luxembourg 1 570 1 921 1 999 +27% 56%
Hungary 272 342 412 +51% 54%
Malta
**
617 718 736 +19% 48%
Netherlands 1 335 1 486 1 552 +16% 56%
Austria - - - - -
Poland 313 404 453 +45% 52%
Portugal 497 566 650 +31% 64%
Romania 139 190 275 +99% 50%
Slovenia 539 789 805 +49% 62%
Slovakia 241 352 435 +80% 46%
Finland - - - - -
Sweden - - - - -
United Kingdom
**
1 242 1 251 1 397 +13% 49%
United States
**
689 911 1 192 +73% :
: Data not available - Not applicable * 1st
July 2008 ** See country notes *** 1st
January 2015
The source dataset can be found here.
Minimum wages per month in national currency for non-euro area countries
1
st
January 2008 1
st
January 2014 1
st
January 2017 Change 2017/2008
Bulgaria BGN 220 340 460 +109%
Czech Republic CZK 8 000 8 500 11 000 +38%
Croatia HRK 2 747* 3 018 3 276 +19%
Hungary HUF 69 000 101 500 127 500 +85%
Poland PLN 1 126 1 680 2 000 +78%
Romania RON 500 850 1 250 +150%
United Kingdom
**
GBP 911 1 043 1 196 +31%
United States
**
USD 1 014 1 257 1 257 +24%
* 1st
July 2008 ** See country notes
The source dataset can be found here.
5. Minimum wages per month in purchasing power standards* in the EU
1
st
January 2008 1
st
January 2014 1
st
January 2017
Belgium 1 211 1 425 1 453
Bulgaria 224 458 501
Czech Republic 444 579 644
Denmark - - -
Germany
**
- 1 436 1 493
Estonia 377 590 645
Ireland
**
1 156 1 266 1 280
Greece 877 805 805
Spain 740 843 910
France
**
1 173 1 401 1 415
Croatia 520*** 632 663
Italy - - -
Cyprus - - -
Latvia 301 538 553
Lithuania 360 575 625
Luxembourg 1 389 1 596 1 659
Hungary 400 630 723
Malta
**
797 908 917
Netherlands 1 304 1 408 1 433
Austria - - -
Poland 476 815 881
Portugal 590 754 793
Romania 230 463 551
Slovenia 665 994 1 012
Slovakia 375 612 658
Finland - - -
Sweden - - -
United Kingdom
**
1 012 1 147 1 236
United States
**
860 1 033 1 033
* PPS for 2014 are estimated.
** See country notes
*** 1st
July 2008
- Not applicable
The source dataset can be found here.