1. American International Journal of Business Management (AIJBM)
ISSN- 2379-106X, www.aijbm.com Volume 5, Issue 01 (January-2022), PP 147-154
*Corresponding Author: Nurjanah1
www.aijbm.com 147 | Page
Financial Plan Analysis for Business Plan Processor and Application
of Yonly Glass
Nurjanah1
, Tantri Yanuar Rahmat Syah2
, Semerdanta Pusaka3
, Ketut Sunaryanto4
.
1
FacultyofEconomicsand Business, Esa Unggul University – Jakarta.
2
FacultyofEconomicsand Business, Esa Unggul University – Jakarta.
3
FacultyofEconomicsand Business, Esa Unggul University – Jakarta.
4
FacultyofEconomicsand Business, Esa Unggul University – Jakarta.
Abstract: At the beginning of the emergence of Covid has an impact on the economic slowdown in Indonesia,
one of which is the industrial sector that is affected but along with the increase of this sector, the supporting
business center of one of them is the sheet glass sector also wriggling. This makes Yonly Glass enliven this
business, so the company calculates the project for the next five years. The study used inductive qualitative
methods in which all sample data and supporting data and measurement results were used to obtain financial
planning results. The results of this study show that the income statement increases every year. The balance
sheet report shows a significant increase in assets and equity in the next five years. These results also explain
that this business provides an idea that the glass processor and application business is still profitable in
pandemics and crises, so this Financial Plan Strategy is appropriate and suitable for Yonly Glass.
Keywords: Financial plan, Balance sheet, Profit and loss, Capital
I. INTRODUCTION
This slowdown will increase rivalry in the quest for market share in practically all industries at the start of
covid's debut in 2020, which resulted in a slowdown in the development of the construction and building industry,
notably supporting sectors such as sheet glass. Indonesia's building development chances are growing in 2021,
representing the country's considerable economic growth plan, which needs the assistance of suitable glass
processing and installation firms. However, in 2021, Fitch Ratings (2020)expects there will be a growth spurt, given
that some projects are delayed this year. But it expects growth in 2021, assuming that Covid-19 has subsided. It will
indirectly boost national economic growth, especially with the potential population of Indonesia in 201,9, around
268 million people will affect the construction market(BPS, 2020). The increasing growth of the industry and the
existence of new development projects will trigger the intense competition experienced by Yonly Glass. Based on
BCI ASIA (2015),the value of building construction in 2016 was 153.08 trillion, decreased in 2017, which was
150.36 trillion, decreased again in 201, eight which was 140.51 trillion. After experiencing a decrease three
consecutive years from 20,16-2018, the value of building construction increased by 4.9%, 147.77 trillion, and in
2020, again experienced an increase of 2.1%, which is 150.7 trillion. Then the projection in 2021 can increase by
6.7, % which is 160.8 trillion.
Based on this data, it is seen that this business has great potential, so it is exciting folly glass to participate
in this business. Yonly Glass is a company engaged in the glass industry with activities to process sheet glass
according to the design of the contractor's play as and installation (applicator) of glass in its building projects. PT.
Yonly Glass is present to provide convenience in serving the needs of glass in the massive demand for high-rise
building construction, in this case, the structure of Apartments, Housing, Hospitals, and office buildings throughout
Indonesia. In addition, it can also give consumers a choice in determining the needs and services and tariffs that are
following their needs and affordable (Lilianira et al., 2020).Yonly glass is interested in entering this business
because similar sheet glass companies have not yet implemented a merger strategy between processing and
installing glass. So, costs will be cheaper than similar companies whose businesses are still separate between glass
processing and installation services with the same low price and quality guarantee as other companies will not be a
significant threat to the company. With this PT Yonly Glass can have a superior and competitive price. We use cost
leadership strategies to address competition
To increase efforts, proper financial analysis and plan are needed and following the company's needs.
Careful planning will make the company survive for an extended period and in intense competition. In this study,
Yonly Glass made financial planning that is used as a measuring tool in determining the feasibility of this investment
and the feasibility of this business going forward. The planning that will be used is profit and loss, balance sheet, and
2. Financial Plan Analysis for Business Plan Processor and Application of Yonly Glass
*Corresponding Author: Nurjanah1
www.aijbm.com 148 | Page
capital needs of the company. Researchers tried to create a study entitled "Financial Plan Analysis for Business
Plan Yonly Glass Processors and Applications" with this financial analysis plan. This research aims to provide
an overview of the financial project carried out by Yonly Glass with measurements that have been determined in its
financial report. In addition, the next goal is to provide an economic analysis of the company that is reviewed
according to investment expenditures made by the company (Riskiya et al., 2020).
II. LITERATURE REVIEW
Financial Statements
According to Kasmir (2016), the financial statement is a report that shows the company's financial
condition this time or in a certain period. The purpose of financial statements that show the company's current
financial condition is the current condition. The company's current condition is the company's financial state on a
specific date (for balance sheet) and a certain period (for income statement). Financial statements describe the
company's economic posts obtained in a period. According to Munawir (2010), generally, the financial statements
generally lance sheets and profit-an, profit-and-loss and statements of changes in equity. The balance sheet
represents the number of assets, liabilities, and equity of a company on a given date. At the same time, the profit-
loss calculation shows the results that have been achieved by the company and the expenses incurred during a
specific period. And the statement of changes in equity shows the source and use or reasons that cause changes in
the company's equity.
Financial statements include part of the financial statement process. Complete financial statements usually
include balance sheets, income statements, statements of changes in equity, statements of changes in financial
position (which can be presented in various ways, for example, as cash flow statements/ statements of funds flow),
notes, and other comments and explanatory materials that are an integral part of the financial statements (PSAK 1,
2019). Meanwhile, according to Harahap (2013), financial statements describe a company's financial condition and
business results at a particular time or a certain period of time. The types of financial statements commonly known
are balance sheets, income statements or business results, statements of changes in equity, cash flow statements,
statements of financial position (PSAK 1, 2019).
According to the Indonesian Accountants Association in PSAK 1 (2019), "Users of financial statements
include current investors and potential investors. Employees, lenders, suppliers, and other business creditors,
customers, governments and institutions, and the public. They use financial statements to meet several different
information needs. Some of these needs include Investors. Risk investors and their advisors are concerned with the
inherent risks and the development outcomes of the investments they make. They need in the formation to help
determine whether to buy, hold, or sell the asset. Shareholders are also interested in information that allows them to
assess a company's ability to pay dividends. Employees. Employees and the groups representing them are interested
in information regarding the stability and profitability of the company. They are also interested in information that
allows them to assess a company's services, retirement benefits, and employment opportunities.
Lenders. Lenders are interested in financial information that allows them to know if the loan and its
interest can be paid at maturity. Suppliers and other business creditors. Suppliers and other business creditors are
interested in information that allows them to know if the amount owed will be paid at maturity. Business creditors
are concerned with information about the company's survival, especially if they are bound by a long-term agreement
with or dependent on the company. Customers. Customers are concerned with information about the company's
survival, especially if they are bound by a long-term contract with, or depending on, the company. Government.
The government and various institutions under its control are concerned with allocating resources and, therefore, are
involved with the company's activities. They also need the information to regulate the corporate activity, establish
tax policies, and as a basis for compiling national income statistics and other statistics. People. Companies affect
members of society in a variety of ways. For example, companies can make meaningful contributions to the national
economy, including the number of people employed and protection to domestic investors. Financial statements can
help the public by providing information on trends (trends) and the latest developments in the prosperity of the
company and its series of activities (PSAK 1, 2019).
Income Statement
According to Cashmere (2013), an income statement is a report that shows the amount of income or income earned
and costs incurred, and profit and loss in a given period. According to Van Horne and Wachowicz (2021), an
income statement summarizes a company's income and expenses over a given period ending in profit or loss in that
period. According to Munawir (2010), an income statement is a periodic report on a company's income, expenses,
profit, and loss during a specific period. However, there is no uniformity about the arrangement of profit-and-loss
statements for each company. The principles generally applied are as follows: The first part shows the income
3. Financial Plan Analysis for Business Plan Processor and Application of Yonly Glass
*Corresponding Author: Nurjanah1
www.aijbm.com 149 | Page
earned from the company's principal business (selling merchandise or providing services) followed by the prevalent
price of the goods sold so that gross profit is obtained. The second part shows operational expenses consisting of
sales expenses and general expenses (operating costs). The third part shows the results obtained outside the
company's principal operations, followed by costs outside the company's main business (non-operating / financial
unexpended costs). The fourth part shows incidental profit or loss (extraordinary to earn net income before income
tax finally income tax.
The income statement has two elements, namely income and expenses, which are described as follows:
first, the component of income (Income), which is interpreted as an increase in economic benefits in the form of
income or an increase in assets or a decrease in liabilities (which causes an increase in equity other than that derived
from the Furthermore, the potential to generate profits can be subclassified as Incomes, namely income arising in the
implementation of ordinary activities and known as different designations, such as sales of trade goods, service
income (fees), interest income, dividend income, royalty, and rent (Cashmere, 2016). Furthermore, Profit( gains) is
another post that meets the definition of income. It may arise implementing routine corporate activities such as posts
appearing in the transfer of current assets, revaluation of securities, and an increase in the number of long-term
investments. The second element is the expense, which is defined as a decrease in economic benefits in the form of
outflows, decreased assets or liabilities (which cause an economic decrease that does not concern the division to the
owner) of the company over a period, which includes expenses arising in the implementation of ordinary corporate
activities (which usually take the form of outflows or reduced assets such as cash supply, fixed assets), which
include for example the p Next is the Loss, which reflects other posts that meet the defines of expenses arising or do
not arise from rare company activities, such as losses due to fire disasters, floods or the release of non-current assets.
The difference between total income (revenue) and expense (expense) is called net income (profit). In the
income statement, gains and losses are usually presented separately, providing better information in economic
decision-making. On the income statement, often income and expenses are shown following the company's
activities. Based on the nature of this activity, It is possible to add income and costs into income and business
expenses from activities that are ordinary and routine and become income and are the main business/activity;
income and expenses outside the business (from regular activities but not the main activities/activities of the
company). The income statements can be presented using two forms, namely single-step form and multiple-step
form.
Balance Sheet Report
According to Jumingan (2009: 13), a balance sheet is a form of additional company capital in the form of
wealth or services owned by the company concerned. The wealth must be clearly stated, measured in units of
money. According to Kasmir (2013), a balance sheet is a report that shows the financial position on a specific date.
According to Harahap (2009:), the balance sheet or balance sheet list is also called the company's financial position
statement. The report describes the position of assets, liabilities equity at any given moment. A balance sheet is a
report that presents the economic sources of a company or its assets or liabilities or debts and the rights of the
company's owners embedded in that company or the owner's equity at any given moment. The balance sheet must be
arranged systematically to provide an overview of the financial position of the company. Therefore, in IFRS, the
balance sheet can also be called Statements of Financial Position. Because the balance sheet is a portrait or picture
of the situation at a particular moment, the balance sheet is a status report, not a flow report. According to James C.
van Horne in Cashmere (2013), a balance sheet summarizes a company's financial position on a given date that
shows total assets with total liabilities plus absolute owner's equity. To describe the company's financial situation at
a given time, the balance sheet has three elements of financial statements, namely assets, liabilities, and equity. Each
of these elements can be subclassified as follows.
Assets
Assets controlled by the company contain information about current assets, namely assets whose economic benefits
are expected to be obtained within one year or less (or normal operating cycle), such as cash, securities, supplies,
and receivables, and cost. A long-term investment is an investment that is usually done to earn a steady income or
control another company and a period of more than one year, for example, stock investment, bond investment. Fixed
assets, i.e., assets that have a physical substance, are used in the company's normal operations (not intended for sale)
and provide economic benefits for more than one year. Included in this sub-classification of assets include land,
buildings, vehicles, and machinery and equipment. Intangible assets have no physical substance and are usually in
the form of rights or privileges that provide economic benefits to the company for e year. Included in this asset sub-
classification such as patent, goodwill, royalty, copyright (copyright), tradename / trademark (trademark /
trademark), franchise and license (license). Miscellaneous assets, namely assets in any of the four sub-
classifications, such as deferred expenses, receivables to directors, deposits, employee loans.
4. Financial Plan Analysis for Business Plan Processor and Application of Yonly Glass
*Corresponding Author: Nurjanah1
www.aijbm.com 150 | Page
Obligation
The debt of a company today can be subdivided into three categories: first, current liabilities, which are obligations
that are expected to result in outflows from the company's resources (which have economic benefits) within a one-
year normal operating cycle)—trade debt, money order debt, salary and wage debt, tax debt, and other unpaid
expense or expense debt are all included in this category of obligations. The second type of liability is a long-term
obligation, which is an obligation whose completion is expected to result in outflows from the company's resources
(with economic benefits) in more than one year—bond debt, mortgage debt, and bank debit or investment credit are
examples of long-term obligations. Third is miscellaneous obligations, which cannot be categorized into one of the
sub-classifications of such duties, such as debts to the Board of Directors and debts to shareholders.
Equity
Equity is the share of the owner's rights in the company, which is the difference between existing assets and
liabilities. This equity element may be further divided into two subcategories, the first of which is equity produced
from the owners' deposits, such as stock capital. Equities are earnings that are not given to the owner as dividends
and are obtained from operational outcomes (withheld). Each of these items is represented in the balance sheet by
following specific rules. Assets are portrayed in terms of liquidity, obligations are stated in maturity, and equity is
presented in terms of eternity.
III. METHOD
This study uses qualitative research methods where the data obtained by the author through observation,
analysis of documents and, records or analysis of reports are used as a basis in the calculation of his study (Susanti et
al., 2020). In addition, the author in performing research utilizing financial report planning, which comprises income
statement and balance sheets from Yonly Glass for the future five years. This is used to display the tern advancing
reward forecasts for the financial report's performance. Gross profit, pre-tax profit, and Net Profit loss are all shown
on the income statement. As for the Balance Sheet, assets show the presence of current and fixed assets, while
Passive indicates the presence of current and long-term liabilities and equity, with the outcome balancing investment
passively.
IV. RESULT AND DISCUSSION
Financial Statement Planning
Financial planning analysis conducted by Yonly Glass is processed from data that has been received by the
finance section of related sections such as marketing, Operations, Human Resources, and from other parts. The data
is then compiled through the accounting section and then posted in the journal to produce the income and
balance sheet statements. This becomes important considering that before making an investment decision, an
analysis is needed to determine the feasibility level of the planned investment from the financial aspect. A helpful
tool to investigate eligibility to ensure the achievement of expected returns in the future (Marsiwi et al., 2019).
Projected Income Loss Statement
The profit and loss projections components include projected sales, costs, and net income or loss in a given
period. The projected net income after-tax report calculated for five consecutive years shows an improvement in
profit from the first to the fifth year, indicating an increase in revenue from only glass that increases and costs.
Experian growth ease was also used, which affects profit loss before tax and net profit loss. This is seen in the profit
loss table below.
Table 1. Profit /Loss Year 1- 5
Years Revenue Gross Profit Cost P/L before tax Net P/L
1 43,875,000,000 34,076,250,000 14,381,592,514 19,694,657,486 18,835,007,486
2 51,942,515,625 41,163,890,625 16,898,059,155 24,265,831,470 19,412,665,176
3 58,530,362,000 46,673,874,500 19,514,685,387 27,159,189,113 21,727,351,291
4 67,602,554,800 54,560,418,550 22,221,292,901 32,339,125,649 25,871,300,519
5 78,082,032,042 63,735,486,192 24,142,959,170 39,592,527,022 31,674,021,618
Based on the results of this planning, there are positive figures from this income statement so that the company can
distribute profits (dividends) to shareholders of 40% of profit after tax.
Balance Sheet Projections
Asset projections in the Yonly Glass Balance Sheet Report show an increase in current assets from year 1
to 5. Similarly, total assets also experienced a significant increase from tofu 1 to year five. The recap of Yonly
Glass's balance sheet planning over the next five years can be seen in Table 2 below.
5. Financial Plan Analysis for Business Plan Processor and Application of Yonly Glass
*Corresponding Author: Nurjanah1
www.aijbm.com 151 | Page
Table 2 Projected Assets on the Balance Sheet of PT. Yonly Glass
Years Current Assets Fixed Assets Total Assets Remark
1 22,694,981,511 50,373,504,100 73,068,485,611
2 45,815,060,181 49,040,169,400 94,855,229,581
3 59,144,039,684 47,706,834,700 106,850,874,384
4 76,901,188,877 46,373,500,000 123,274,688,877
5 98,624,657,123 45,105,125,000 143,729,782,123
Passiva's planning on Yonly Glass's balance sheet showed an increase in current liabilities from year 1 to
5. In addition, equity showed an increase from year 1 to year 5. While total liabilities and equity also experienced a
significant increase following total assets. This can be seen in Table 3 below.
Table 3 Projected Passiva on the Balance Sheet of PT. Yonly Glass
Years Current Liabilities Long-term
liabilities
Equity Total Liabilities and
equity
Remark
1 859,650,00 3,373,828,125 68,835,007,486 73,063,485,611
2 4,853,166,294 1,754,309,625 88,247,672,662 94,855,229,581
3 5,431,837,823 134,953,125 101,284,083,436 106,850,874,384
4 6,467,825,130 134,953,125 116,806,863,748 123,274,688,877
5 7,918,505,404 - 135,811,276,718 143,729,782,123
V. CONCLUSION
The financial statement planning discussion results made by Yonly Glass showed that although in pandemic
conditions, the projected next five years, there was an increase in profits in the future. Significant. This is supported
by the high demand for sheet glass for the large three industries, y hospitality, apartments, and housing. In
addition, the planning of assets in the balance sheet shows an increase in current fixed assets, for current abilities
have increased but long-term liabilities. We are experiencing a decline. Overall, the balance sheet shows increased
and passive assets that have increased as well. Furthermore, further researchers need to dd meters and calculation
ratios to impress investors in providing investment support for Yonly Glass.
REFERENCE
[1] BCIAsia. (2015). Building and Construction Insight 2015. BCI Asia All Rights Reserved,1–37.
[2] BPS. (2020). INFLATION. 2020. https://www.bps.go.id/subject/3/inflasi.html
[3] Fitch Ratings. (2020). Fitch Ratings 2021 Outlook: Turkish Banks(Issue December 2020).
https://www.fitchratings.com/research/banks/fitch-ratings-2021-outlook-turkish-banks-10-12-2020
[4] Harahap, S. S. (2013). Critical analysis of financial statements. Jakarta: PT Raja Grafindo Persada.
[5] Cashmere. (2016). Analysis of Financial Statements.King Grafindo Persada.
[6] Lilianira, F. T., Yanuar, T., Shah, R., Pusaka, S., & Ramdhani, D. (2020). The Technology Processing of "4
Care" Home Care Application Based on Artificial Intelligence. Journal of Multidisciplinary Academic.
Science, Engineering and Social Science Series, 4(1), 6–9.
[7] Marsiwi, K., Yanuar, T., Shah, R., Pusaka, S., & Indradewa, R. (2019). Investment Feasibility Analysis in
Financial Aspects of Startup Business In Lifestyle Combining Barbershop And Coffee shop Over PT. Jeeva
Work Corporation. Journal of Multidisciplinary Academic, 3(4), 97–100.
http://www.kemalapublisher.com/index.php/JoMA/article/view/398
[8] Munawir. (2010). Analysis of Financial Statements, Fourth Edition. Liberty. Yogyakarta.(Liberty. &
Yogyakarta. (eds.); Keem edition).
[9] Financial Accounting Standard Guidelines DE PSAK 1, 01 Indonesian Accounting Association 1 (2019).
https://staff.blog.ui.ac.id/martani/files/2011/04/ED-PSAK-1.pdf
[10] Riskiya, H., Shah, T. Y. R., Pusaka, S., & Ramdhani, D. (2020). Financial Implementation for Start-up
Business Home Care Applications. Journal of Multidisciplinary Academic, 4(6), 350–353.
[11] Susanti, B., Yanuar, T., & Sunaryanto, K. (2020). Lean Consumption Implementation for Acceleration
Improvement in Executive Outpatient Wait Time over Hermina Hospital Bekasi. Journal of
Multidisciplinary Academic, 4(1), 42–46.
[12] Van Horne., J.C., & Wachowicz., J.M. (2021). "Principles of financial management."
6. Financial Plan Analysis for Business Plan Processor and Application of Yonly Glass
*Corresponding Author: Nurjanah1
www.aijbm.com 152 | Page
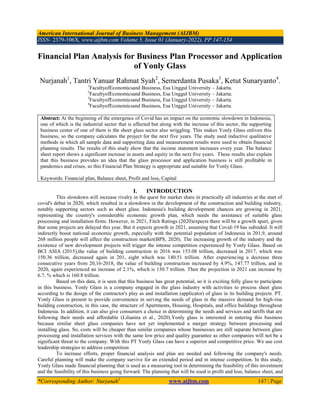
Appendix 1 Profit -Loss
Source: Writing team, 2021
Table 2. Profit /Loss Year 1- 5
Years Revenue Gross Profit Cost P/L before tax Net P/L
1 43,875,000,000 34,076,250,000 14,381,592,514 19,694,657,486 18,835,007,486
2 51,942,515,625 41,163,890,625 16,898,059,155 24,265,831,470 19,412,665,176
3 58,530,362,000 46,673,874,500 19,514,685,387 27,159,189,113 21,727,351,291
4 67,602,554,800 54,560,418,550 22,221,292,901 32,339,125,649 25,871,300,519
5 78,082,032,042 63,735,486,192 24,142,959,170 39,592,527,022 31,674,021,618
KETERANGAN TAHUN 1 TAHUN 2 TAHUN 3 TAHUN 4 TAHUN 5
PENDAPATAN
Pendapatan Prosesing Kaca Tempered (8-12mm) 12.875.000.000 15.242.390.625 17.175.587.000 19.837.789.675 22.912.965.558
Pendapatan Prosesing Kaca Laminated (8-12mm) 23.000.000.000 27.229.125.000 30.682.575.000 35.438.374.125 40.931.890.398
Pendapatan Pemasangan Kaca Tempered (8-12mm) 4.000.000.000 4.735.500.000 5.336.100.000 6.163.195.500 7.118.588.043
Pendapatan Pemasangan Kaca Laminated (8-12mm) 4.000.000.000 4.735.500.000 5.336.100.000 6.163.195.500 7.118.588.043
Pendapatan Lain-Lain - - - - -
JUMLAH PENDAPATAN USAHA 43.875.000.000 51.942.515.625 58.530.362.000 67.602.554.800 78.082.032.042
Bahan Baku Kaca (6.030.000.000) 6.633.000.000
- 7.296.300.000
- 8.025.930.000
- 8.828.643.600
-
Bahan Baku Alumunium (3.768.750.000) 4.145.625.000
- 4.560.187.500
- 5.016.206.250
- 5.517.902.250
-
9.798.750.000
- 10.778.625.000
- 11.856.487.500
- 13.042.136.250
- 14.346.545.850
-
LABA KOTOR 34.076.250.000 41.163.890.625 46.673.874.500 54.560.418.550 63.735.486.192
BEBAN USAHA
Beban Gaji 8.183.061.474 9.495.515.080 10.217.464.127 10.842.493.193 11.549.632.497
Beban Listrik 1.219.701.325 1.418.560.000 1.560.416.000 1.716.457.600 1.888.103.360
Beban Pemeliharaan 102.000.000 2.750.000 2.420.000 1.996.500 2.928.200
Beban Telepon, Internet & Air 253.200.000 287.804.000 316.584.400 348.242.840 383.067.124
Beban Kantor 968.420.500 463.212.500 517.408.435 535.454.122 555.273.370
Beban Pajak - - - - -
Beban Penyusutan Aktiva 1.333.334.700 1.333.334.700 1.333.334.700 1.333.334.700 1.268.375.000
Beban Sewa 288.000.000 316.800.000 348.480.000 383.328.000 421.660.800
Beban Rekrutmen, Pelatihan & Pengembangan 330.000.000 210.000.000 252.600.000 277.830.000 291.721.500
Beban Promosi 1.231.750.000 2.665.512.500 4.095.787.500 5.724.067.821 6.611.388.645
Beban Asuransi 215.250.000 258.300.000 258.300.000 258.300.000 258.300.000
Beban Kegagalan Pemasangan 128.750.000 277.134.375 425.840.625 595.133.565 687.388.658
Beban Ekspedisi 24.000.000 32.736.000 36.009.600 39.610.560 43.571.616
Beban Operasional Lainnya 104.124.516 136.400.000 150.040.000 165.044.000 181.548.400
JUMLAH BEBAN USAHA 14.381.592.514 16.898.059.155 19.514.685.387 22.221.292.901 24.142.959.170
LABA (RUGI) SEBELUM PAJAK - EBT 19.694.657.486 24.265.831.470 27.159.189.113 32.339.125.649 39.592.527.022
PAJAK PENGHASILAN 859.650.000 4.853.166.294 5.431.837.823 6.467.825.130 7.918.505.404
LABA (RUGI) BERSIH SETELAH PAJAK 18.835.007.486 19.412.665.176 21.727.351.291 25.871.300.519 31.674.021.618
DEVIDEN - - 8.690.940.516 10.348.520.208 12.669.608.647
LABA DITAHAN 18.835.007.486 19.412.665.176 13.036.410.774 15.522.780.311 19.004.412.971
LAPORAN LABA RUGI
PERIODE : 1 JANUARI 2021-31 DESEMBER 2025
7. Financial Plan Analysis for Business Plan Processor and Application of Yonly Glass
*Corresponding Author: Nurjanah1
www.aijbm.com 153 | Page
Appendix 2 Balance Sheet
Projected Balance Sheet of PT. Yonly Glass
KETERANGAN TAHUN 1 TAHUN 2 TAHUN 3 TAHUN 4 TAHUN 5
ASET
Aset Lancar
Kas dan Bank 22.694.981.511 45.815.060.181 48.471.839.684 64.574.797.877 84.387.481.037
Piutang - - 10.672.200.000 12.326.391.000 14.237.176.086
Sewa dan seting gedung - - - - -
Jumlah Aset Lancar 22.694.981.511 45.815.060.181 59.144.039.684 76.901.188.877 98.624.657.123
Aset Tetap
Tanah 35.000.000.000 35.000.000.000 35.000.000.000 35.000.000.000 35.000.000.000
HP Bangunan 10.500.000.000 10.500.000.000 10.500.000.000 10.500.000.000 10.500.000.000
Akm. Peny. Bangunan (525.000.000) (1.050.000.000) (1.575.000.000) (2.100.000.000) (2.625.000.000)
HP Peralatan Kantor 6.206.838.800 6.206.838.800 6.206.838.800 6.206.838.800 6.206.838.800
Akm. Peny. Peralatan Kantor (808.334.700) (1.616.669.400) (2.425.004.100) (3.233.338.800) (3.976.713.800)
HP Kendaraan - - - - -
Akum. Peny. Kendaraan - - - - -
Jumlah Aset Teta 50.373.504.100 49.040.169.400 47.706.834.700 46.373.500.000 45.105.125.000
JUMLAH ASET 73.068.485.611 94.855.229.581 106.850.874.384 123.274.688.877 143.729.782.123
KEWAJIBAN dan EKUITAS
Kewajiban Lancar - - - - -
Hutang Gaji Karyawan - - - - -
Pendapatan Diterima Dimuka - - - - -
Hutang - - - - -
Hutang Pajak 859.650.000 4.853.166.294 5.431.837.823 6.467.825.130 7.918.505.404
Jumlah KEWAJIBAN LANCAR 859.650.000 4.853.166.294 5.431.837.823 6.467.825.130 7.918.505.404
Kewajiban Jangka Panjang -
Hutang Leasing 3.373.828.125 1.754.390.625 134.953.125 -
Jumlah KEWAJIBAN JK PANJANG 3.373.828.125 1.754.390.625 134.953.125 (134.953.125) -
EKUITAS
Modal 50.000.000.000 50.000.000.000 50.000.000.000 50.000.000.000 50.000.000.000
Laba Ditahan 18.835.007.486 38.247.672.662 51.284.083.436 66.806.863.748 85.811.276.718
Jumlah EKUITAS 68.835.007.486 88.247.672.662 101.284.083.436 116.806.863.748 135.811.276.718
JUMLAH KEWAJIBAN DAN EKUITAS 73.068.485.611 94.855.229.581 106.850.874.384 123.274.688.877 143.729.782.123
PT Yonly Glass
NERACA
PERIODE : 1 JANUARI 2021 - 31 DESEMBER 2025
8. Financial Plan Analysis for Business Plan Processor and Application of Yonly Glass
*Corresponding Author: Nurjanah1
www.aijbm.com 154 | Page
Appendix 3
Projected Cash Flow Statement
Pt Yonly Glass's cash flow statement is seen in table 8.4.3, where the final balance is always surplus and
increases every year until the 5th year. This indicates the cash flow of PT Yonly Glass excellent and always
makes improvements to the financial structure every year.
Uraian TAHUN 1 TAHUN 2 TAHUN 2 TAHUN 4 TAHUN 5
SALDO AWAL
Kas dan Bank - 22.694.981.511 45.815.060.181 48.471.839.684 64.574.797.877
-
ARUS KAS DARI AKTIVITAS PENDANAAN
Modal Pendiri 30.000.000.000
Investor 20.000.000.000
KAS DITERIMA DARI AKTIVITAS INVESTASI 50.000.000.000 - - - -
ARUS KAS DARI AKTIVITAS OPERASI
Pendapatan Prosesing Kaca Tempered (8-12mm) 12.875.000.000 15.242.390.625 17.175.587.000 19.837.789.675 22.912.965.558
Pendapatan Prosesing Kaca Laminated (8-12mm) 23.000.000.000 27.229.125.000 30.682.575.000 35.438.374.125 40.931.890.398
Pendapatan Pemasangan Kaca Tempered (8-12mm)
Pendapatan Pemasangan Kaca Laminated (8-12mm)
Pendapatan Piutang 8.000.000.000 9.471.000.000 10.672.200.000 12.326.391.000
KAS DITERIMA DARI AKTIVITAS OPERASIONAL 43.875.000.000 51.942.515.625 47.858.162.000 65.948.363.800 76.171.246.956
JUMLAH KAS AWAL PERIODE DAN KAS BERJALAN 93.875.000.000 74.637.497.136 93.673.222.181 114.420.203.484 140.746.044.833
PENGELUARAN
Pembelian Tanah 35.000.000.000
Pembelian Bangunan 10.500.000.000
Hp Peralatan kantor & pabrik 2.055.138.800
Angsuran Leasing 1.484.484.375 1.619.437.500 1.619.437.500 134.953.125
Biaya Bahan Baku Kaca 6.030.000.000 6.633.000.000 7.296.300.000 8.025.930.000 8.828.643.600
Biaya Bahan Baku Aluminium 4' 3.768.750.000 4.145.625.000 4.560.187.500 5.016.206.250 5.517.902.250
Beban Gaji 8.183.061.474 9.495.515.080 10.217.464.127 10.842.493.193 11.549.632.497
Beban Listrik 1.219.701.325 1.418.560.000 1.560.416.000 1.716.457.600 1.888.103.360
Beban Pemeliharaan 102.000.000 2.750.000 2.420.000 1.996.500 2.928.200
Beban Telepon, Internet & Air 253.200.000 287.804.000 316.584.400 348.242.840 383.067.124
Beban Kantor 261.808.000 463.212.500 517.408.435 535.454.122 555.273.370
Beban Pajak
Beban Sewa 288.000.000 316.800.000 348.480.000 383.328.000 421.660.800
Beban Rekrutmen, Pelatihan & Pengembangan 330.000.000 210.000.000 252.600.000 277.830.000 291.721.500
Beban Promosi 1.231.750.000 2.665.512.500 4.095.787.500 5.724.067.821 6.611.388.645
Beban Asuransi 215.250.000 258.300.000 258.300.000 258.300.000 258.300.000
Beban Kegagalan Pemasangan 128.750.000 277.134.375 425.840.625 595.133.565 687.388.658
Beban Ekspedisi 24.000.000 32.736.000 36.009.600 39.610.560 43.571.616
Beban Operasional Lainnya 104.124.516 136.400.000 150.040.000 165.044.000 181.548.400
Pajak Penghasilan 859.650.000 4.853.166.294 5.431.837.823 6.467.825.130
Deviden 8.690.940.516 10.348.520.208 12.669.608.647
JUMLAH PENGELUARAN KAS 71.180.018.490 28.822.436.955 45.201.382.497 49.845.405.606 56.358.563.797
SALDO KAS 22.694.981.510 45.815.060.181 48.471.839.683 64.574.797.877 84.387.481.037
PT Yonly Glass
LAPORAN ARUS KAS
PERIODE 1 JANUARI 2021- 31 DESEMBER 2021