Download as PDF, PPTX

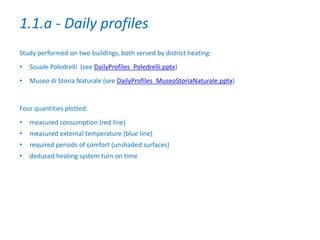
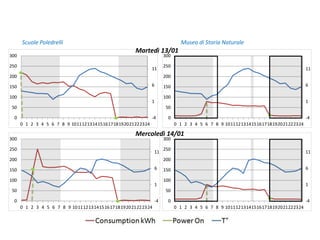

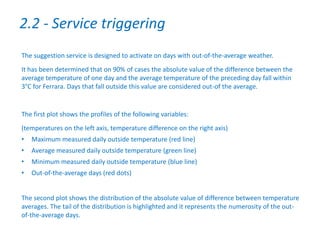
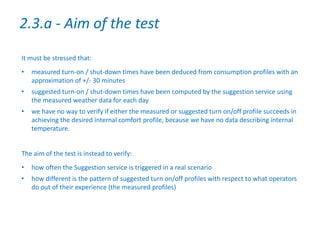
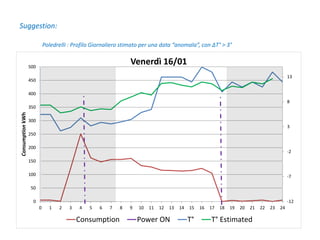
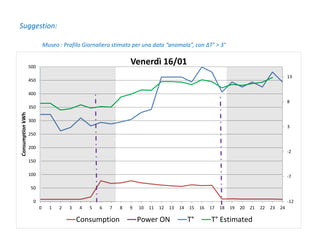
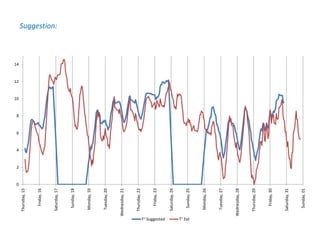
![Suggestion:
Poledrelli :
-15
-10
-5
0
5
10
15
0
2
4
6
8
10
12
14/01/2015
16/01/2015
18/01/2015
20/01/2015
22/01/2015
24/01/2015
26/01/2015
28/01/2015
30/01/2015
01/02/2015
houroftheday
Accensione
Estimated on
off
Measured on
off
T min
T max
-7
-2
3
8
13
12
13
14
15
16
17
18
19
20
21
ExternalTemperature[°C]
Spegnimento
-15
-10
-5
0
5
10
15
5
6
7
8
9
10
11
12
14/01/2015
16/01/2015
18/01/2015
20/01/2015
22/01/2015
24/01/2015
26/01/2015
28/01/2015
30/01/2015
01/02/2015
ExternalTemperature[°C]
-7
-2
3
8
13
12
13
14
15
16
17
18
19
20
21
ExternalTemperature[°C]
houroftheday
Museo :](https://image.slidesharecdn.com/s24-validationactivitieforscenario2caseferrara-160210151105/85/S-2-4-Validation-Activities-for-Scenario-2-case-Ferrara-17-320.jpg)


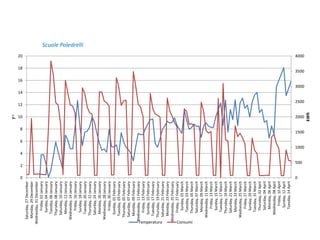
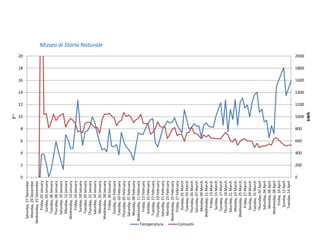
The document analyzes historical consumption and weather data from two buildings heated by district heating in Ferrara, Italy. It examines daily and seasonal profiles of consumption, temperature, and heating system usage. It also tests a heating system suggestion service that predicts optimal heating turn-on/off times using weather forecasts, evaluating its performance on past data from the two buildings. The analysis found inverse relationships between consumption and temperature as expected, and that the suggestion service accurately predicted turn-on/off times for most out-of-average temperature days.


![Getting Started with Apache Spark: Big Data Made Simple [Free Meetup]](https://cdn.slidesharecdn.com/ss_thumbnails/apachesparkgettingstarted-260203175547-8361bcc3-thumbnail.jpg?width=640&height=640&fit=bounds)