Download to read offline


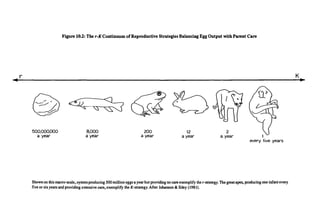
![P 30 Race, Evolution, and Behavior
seven. Intelligence, 25, 7-20.
Rushton, J. P. (1997b). Race, intelligence, and the brain: The errors and
omissions of the ‘revised’ edition of S. J. Gould’s The Mismeasure of Man
(1996). Personality and Individual Differences, 23, 169-180.
Rushton, J. P. (1998). The “Jensen Effect” and the “Spearman-Jensen
Hypothesis” of Black-White IQ differences. Intelligence, 26, 217-225.
Rushton, J. P. (1999a, April 29). Brain Size and Cognitive Ability: A Review
With New Evidence. Presented at the Annual Meeting of the American
Association of Physical Anthropologists, Columbus, OH.
Rushton, J. P. (1999b). Darwin’s really dangerous idea - the primacy of
variation. In J. M. G. van der Dennen, D. Smillie, and D. R. Wilson (Eds.),
The Darwinian Heritage and Sociobiology (pp. 210-229). Westport, CT:
Praeger.
Rushton, J. P. (1999c). [Review of Jared Diamond’s Guns, Germs, and Steel:
The Fates of Human Societies. New York: Norton]. Population and
Environment, 21, 99-107.
Rushton, J. P. (1999d). Secular gains in IQ not related to the g factor and
inbreeding depression — unlike Black-White differences: A reply to Flynn.
Personality and Individual Differences, 26, 381-389.
Rushton, J. P. (in press). Flynn effects not genetic and unrelated to race
differences. American Psychologist.
Rushton, J. P., & Ankney, C.D. (1996). Brain size and cognitive ability:
Correlations with age, sex, social class and race. Psychonomic Bulletin and
Review, 3, 21-36.
Rushton, J. P., & Ankney, C.D. (in press). Size matters: A review of racial
differences in cranial capacity and intelligence that refute Kamin and Omari.
Personality and Individual Differences.
Rushton, J. P., & Skuy, M. (in press). Performance on Raven’s Matrices by
African and White university students in South Africa. Intelligence.
Sarich, V. M. (1995). In defense of The Bell Curve. Skeptic, 3(3), 84-93.
Schoenemann, P. T. (1997). An MRI Study ofThe Relationship Between Human
Neuroanatomy andBehavioralAbility. Unpublished dissertation, Department
of Anthropology, University of California, Berkeley.
Skuy, M., Gewer, A., & Rushton, J. P. (2000). An Intervention Study of
University Student's Performance on Raven's Progressive Matrices in South
Africa. Unpublished manuscript, Division of Specialized Education,
University of the Witwatersrand, Johannesburg 2050, South Africa.
Skuy, M., Schutte, E., Fridjhon, P., & O’Carroll, S. (2000). Suitability of
Published Neuropsychological Test Norms for Urban African Secondary
School Students in South Africa. Unpublished manuscript, Division of
Specialized Education, University ofthe Witwatersrand, Johannesburg 2050,
South Africa.](https://image.slidesharecdn.com/race-evolution-and-behavior-ocr-230107100736-b0704676/85/Rushton-Race-Evolution-and-Behavior-29-320.jpg)


![Revamping Social Science 7
(Stringer & Andrews, 1988). Because Bonner (1980) had shown that, in gen
eral, animals that emerged later in earth history had larger brains and greater
culture than those that had emerged earlier, I extrapolated to the human suc
cession (Rushton, 1992b). Because groups migrating out of Africa into the
colder climate of Eurasia encountered more challenging environments, in
cluding the last ice age, which ended just 12,000 years ago, they were more
stringently selected for intelligence, forward planning, sexual and personal
restraint, and a /C-parenting strategy. The Siberian cold experienced by Orien
tal populations was the most severe and exerted the greatest selection.
Few social scientists, however, were willing to examine the evidence or to
engage in scientific debate. Charles Leslie, an advisory editor of Social Sci
ence and Medicine exemplified the opposition. Outraged that the journal had
published my work on how racial variation in sexuality contributed to the
global epidemiology of AIDS, Leslie (1990: 896) used his opening address at
the Eleventh International Conference on the Social Sciences and Medicine to
condemn the editorial decision to publish me. The justification for his de
nouncement is illuminating of the state of much social science research.
[M]ost of the influential work in the social sciences is ideological, and most of our
criticisms of each other are ideologically grounded. Non social scientists generally
recognize the fact that the social sciences are mostly ideological, and that they
have produced in this century a very small amount of scientific knowledge com
pared to the great bulk of their publications. Our claim to being scientific is one of
the main intellectual scandals of the academic world, though most of us live com
fortably with our sham e.... By and large, we believe in, and our social science is
meant to promote, pluralism and democracy.
This view of social science was also exemplified by Caporael and Brewer
(1991:1) who edited a special volume of the Journal o fSocial Issues, a publi
cation of the American Psychological Association, to “recapture” evolution
ary theory from people like me for those more “socially responsible.”Asserted
the editors, “Biological explanations of human social behavior tend to be ideo
logically and politically reactive”. One contributor (Fairchild, 1991:112) went
further:
If ideology is inextricably tied to the generation of knowledge, then all social sci
ence writings—including this one—involve certain ideological biases or political
agendas__ These biases are typically unstated. The author’s ideological biases
are as follows: (a) The idea of inherited “racial** differences is false; instead, “race**
is a proxy for a host of longstanding historical and environmental variables, (b)
Social science has the mandate of applying its theories and methods to alleviate
human suffering and inequality.
The evolutionary psychology of race differences has become the most po
litically incorrect topic in the world today. On no other issue are the outmoded
paradigms and obsolete models of the social science orthodoxy so clearly re](https://image.slidesharecdn.com/race-evolution-and-behavior-ocr-230107100736-b0704676/85/Rushton-Race-Evolution-and-Behavior-48-320.jpg)
![12 Race, Evolution, and Behavior
imagery and invented the word association test, creating stimulus words and
gathering statistical information on their unconscious associations. These were
published in Brain (1879), and Freud can almost certainly be included among
the readers of this issue, although he never referred to Galton’s paper nor
credited Galton with priority in suggesting the existence of unconscious men
tal processes (Forrest, 1974).
The longest-standing contributions of Galton are statistical. He was among
the first to apply the normal distribution, deviation scores, and percentiles to
psychological characteristics (1869). He invented the concepts of regression
and correlation (1888a, 1889). He was influential in founding the journal
Biometrika (1901), which, by promulgating statistical techniques for the study
of biological variation, including psychological characteristics, helped begin
the psychometric tradition. In his anthropometric laboratory, Galton (1883,
1889) pioneered many measurement techniques including those of head size.
During the 1880s and 1890s more than 17,000 individuals of all ages from
diverse walks of life were tested. For a small fee visitors could have various
measurements taken and recorded.
Galton (1888b) was the first to report a quantitative relationship between
cranial capacity and mental ability in humans. Galton’s subjects were 1,095
Cambridge undergraduates divided into those who had achieved first class
honors degrees and those who had not. Galton computed head volume by
multiplying head length by breadth by height and plotting the results against
age (19 to 25 years) and class of degree (A, B, C). He reported that (1) cranial
capacity continued to grow after the age of 19, and (2) men who obtained
high honors degrees had a brain size from 2 to 5 percent greater than those
who did not.
Years later, when Galton’s data were reworked using correlation coeffi
cients, the relation between head size and college grades was found to lie
between 0.06 and 0.11 (Pearson, 1906). Pearson (1924: 94) reported Galton’s
response: “He was very unhappy about the low correlations I found between
intelligence and head size, and would cite against me those ‘front benches*
[the people on the front benches at Royal Society meetings who Galton per
ceived as having large heads]; it was one of the few instances I noticed when
impressions seemed to have more weight with him than measurements.” As
reviewed in chapter 2, volumetric measures of brain size from magnetic
resonance imaging give the substantially higher correlations Galton had
predicted.
When Galton died in 1911, his will endowed Karl Pearson with a Chair of
Eugenics (later Genetics) at the University of London. Pearson, later Galton’s
biographer (1914-1930), invented the product-moment correlation and the
chi-square goodness-of-fit statistic, and helped inaugurate the great biometric
trajectory that included R. A. Fisher (inventor of the analysis of variance) and
Sewall Wright (inventor of path analysis), both of whom are best known, along](https://image.slidesharecdn.com/race-evolution-and-behavior-ocr-230107100736-b0704676/85/Rushton-Race-Evolution-and-Behavior-53-320.jpg)


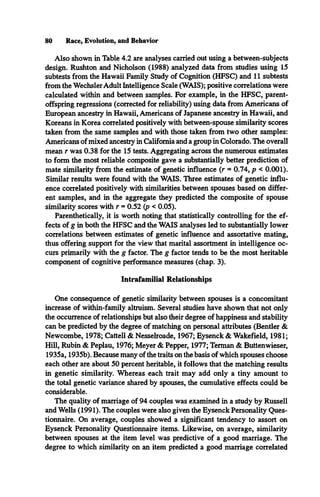
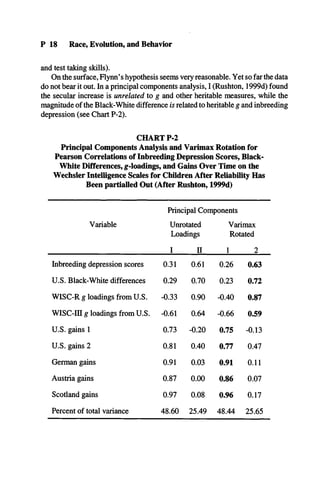
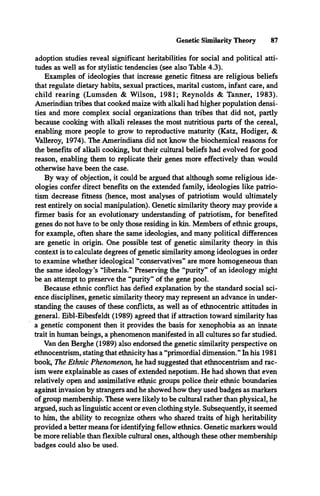
![Genetic Similarity Theory 81
weakly but significantly (p < 0.05) with the heritability of the item, as esti
mated independently by Neale, Rushton, & Fulker (1986). Thus, some sup
port was found for the hypothesis that quality of marriage depends on genetic
similarity.
A related prediction can be made about parental care of offspring that dif
fer in similarity. Sibling differences within families have often been over
looked as a topic of research. Positive assortative mating for genetically based
traits may make some children genetically more similar to one parent or sib
ling than to another. For example, if a father gives his child 50 percent of his
genes, 10 percent of them shared with the mother, and the mother gives the
child 50 percent of her genes, 20 percent shared with the father, then the child
will be 60 percent similar to the mother and 70 percent similar to the father.
Genetic similarity theory predicts that parents and siblings will favor those
who are most similar.
Littlefield and Rushton (1986) tested this hypothesis in a study of bereave
ment following the death of a child. It was predicted that the more similar the
parent perceived the child to be, the greater would be that parent’s grief expe
rience. (Perceived similarity with offspring is correlated with genetic similar
ity measured by blood tests [Pakstis et al., 1972].) Respondents picked which
side of the family the child “took after** more, their own or their spouse’s.
Spouses agreed 74 percent on this question. Both mothers and fathers grieved
more intensely for children perceived as resembling their side of the family.
Other evidence of within-family preferences comes from a review by Segal
(1993) of feelings of closeness, cooperation, and altruism in twin pairs. Com
pared with fraternal twins, identical twins worked harder for their co-twins on
tasks, maintained greater physical proximity, expressed more affection, and
suffered greater loss following bereavement.
A Genetic Basis for Friendship
Friendships also appear to be formed on the basis of similarity. This as
sumption holds for similarity as perceived by the friends, and for a variety of
objectively measured characteristics, including activities, attitudes, needs,
personality, and, also, anthropometric variables. Moreover, in the experimen
tal literature on who likes whom, and why, one of the most influential vari
ables is perceived similarity. Apparent-similarity of personality, attitudes, or
any of a wide range of beliefs has been found to generate liking in subjects of
varying ages and from many different cultures.
According to genetic similarity theory, there is a genetic basis to friendship
and friendship is one of the mechanisms that leads to altruism. Many social
psychological studies show that altruism increases with the benefactor’s ac
tual or perceived similarity to the beneficiary. For example, Stotland (1969)
had subjects observe a person who appeared to be receiving electric shocks.](https://image.slidesharecdn.com/race-evolution-and-behavior-ocr-230107100736-b0704676/85/Rushton-Race-Evolution-and-Behavior-122-320.jpg)
![82 Race, Evolution, and Behavior
When Stotland manipulated the subjects’ beliefs about their similarity to that
person, perceived similarity was correlated with reported empathy as well as
with physiological skin conductance measures of emotional responsiveness.
Krebs (1975) has found that apparent similarity not only increases physiological
correlates of emotion such as skin conductance, vasoconstriction, and heart
rate, but also the willingness to reward the victim. In young children, the fre
quency of social interactions between friends corresponds closely to the fre
quency of acts of altruism between them (Strayer, Wareing, & Rushton, 1979).
Data show that the tendency to choose similar individuals as friends is
genetically influenced. In a study of delinquency among 530 adolescent twins
by Rowe and Osgood (1984), path analysis revealed not only that antisocial
behavior was about 50 percent heritable, but that the correlation of 0.56 be
tween the delinquency of an individual and the delinquency of his friends was
mediated genetically, that is, that adolescents genetically disposed to delin
quency were also genetically inclined to seek each other out for friendship. In
a study of 396 adolescent and young adult siblings from both adoptive and
nonadoptive homes, Daniels and Plomin (1985) found that genetic influences
were implicated in choice of friends: Biological siblings were more similar to
each other in the types of friends they had than were adoptive siblings.
Blood Tests among Friends
I (Rushton, 1989d) used blood tests to determine whether friends are more
similar to each other using methods parallel to those used in the study of het
erosexual partners. Seventy-six long-term, nonrelated, nonhomosexual male
Caucasian friendship pairs ranging in age from 18 to 57 years were recruited
by advertisements from the general community. A control group was formed
by randomly pairing individuals from the sample. At the testing session, a 12-
to 14-milliliter blood sample was drawn from each person.
The best friends were 54 percent similar to each other using 10 loci from 7
polymorphic blood systems—ABO, Rhesus (Rh), MNSs, P, Duffy (Fy), Kidd
(Jk), and HLA. An equal number of randomly chosen pairs were only 48 per
cent similar (z[150] = 3.13, p < 0.05). Stratification effects were unlikely be
cause within-pair differences in age, education, and occupation did not correlate
with the blood similarity scores (mean r = -0.05).
Heritability and Friendship Similarity
I also examined similarity on several questionnaire items chosen because
estimates had been calculated of the degree of genetic influence on the vari
ous components. For example, 36 heritabilities were available with respect to
50 social attitude items (see Table 4.3) from data on 3,810 Australian twin
pairs (Martin et al., 1986). For 90 items from the Eysenck Personality Ques
tionnaire, two independent sets of heritability estimates were available for a](https://image.slidesharecdn.com/race-evolution-and-behavior-ocr-230107100736-b0704676/85/Rushton-Race-Evolution-and-Behavior-123-320.jpg)
![Genetic Similarity Theory 85
bility were accessed more readily as measured by response time, changed less
readily when attempts were made at social influence, and predicted better in
the attitude-similarity attraction relationship. Thus, Tesser (1993) found that
the more heritable attitudes correlated most with attraction to a stranger imag
ined as a potential friend, a romantic partner, and as a spouse.
Ethnocentrism
The implications of the finding that people moderate their behavior as a
function of genetic similarity are far-reaching. They suggest a biological basis
for ethnocentrism. Despite enormous variance within populations, it can be
expected that two individuals within an ethnic group will, on average, be more
similar to each other genetically than two individuals from different ethnic
groups. According to genetic similarity theory, people can be expected to fa
vor their own group over others.
Ethnic conflict and rivalry, of course, is one of the great themes of histori
cal and contemporary society (Horowitz, 1985; Shaw & Wong, 1989; van den
Berghe, 1981). Local ethnic favoritism is also displayed by group members
who prefer to congregate in the same area and to associate with each other in
clubs and organizations. Understanding modem Africa, for example, is im
possible without understanding tribalism there (Lamb, 1987). Many studies
have found that people are more likely to help members of their own race or
country than they are to help members of other races or foreigners, and that
antagonism between classes and nations may be greater when a racial element
is involved.
Traditionally, political scientists and historians have seldom considered
intergroup conflict from an evolutionary standpoint. That fear and mistrust of
strangers may have biological origins, however, is supported by evidence that
animals show fear of and hostility toward strangers, even when no injury has
ever been received. Direct analogies have been drawn between the way mon
keys and apes resent and repel intruding strangers of the same species and the
way children attack another child who is perceived as being an outsider (Gruter
& Masters, 1986; Hebb & Thompson, 1968). Many influential social psy
chologists have pondered whether the transmission of xenophobia could be
partly genetic. W. J. McGuire (1969:265) wrote:
[I]t appears possible for specific attitudes of hostility to be transmitted genetically
in such a way that hostility is directed towards strangers of one’s own species to a
greater extent than towards familiars of one’s own species or towards members of
other species. It would not be impossible for xenophobia to be a partially innate
attitude in the human.
Theorists from Darwin and Spencer to Allport and Freud and now Alexander,
Campbell, Eibl-Eibesfeldt, and E. O. Wilson have considered in-group/out-](https://image.slidesharecdn.com/race-evolution-and-behavior-ocr-230107100736-b0704676/85/Rushton-Race-Evolution-and-Behavior-126-320.jpg)


![114 Race, Evolution, and Behavior
time after death, temperature after death, anatomical level of severance [of
brain from spinal cord], presence or absence of cerebrospinal fluid, of meninges,
and of blood vessels” (pp. 3 and 16/ Tobias pointed out that each of these
variables alone could increase or decrease brain size by 10 to 20 percent, an
amount equivalent or greater than any purported race difference. He equally
opposed conclusions of race differences in structural variables such as corti
cal thickness, size of frontal lobe, or complexity of the brain’s convolutions.
Because I was curious to know what the data would show, despite method
ological weaknesses, and because I believed that the principle of aggregation
(chap. 2) often cancels measurement error, I calculated the mid-points of the
range of scores provided by Tobias (1970: 6, Table 2) and found that Mongol
oids averaged 1,368 grams, Caucasoids 1,378 grams, and Negroids 1,316 grams
(Rushton, 1988b). I also averaged a related measure, the “millions of excess
nerve cells” estimated by Tobias for 8 subgroups and nationalities (1970: 9,
Table 3). These were the number of neurons available for general adaptive
purposes over and above that necessary for maintaining bodily functioning
and were derivable from equations based on brain/body weight ratios (Jerison,
1963,1973). Tobias was skeptical of the value of this “exercise” and provided
few details. Nonetheless, I found that in millions of excess neurons, Mongol
oids = 8,990, Caucasoids = 8,650, and Negroids = 8,550 (Rushton, 1988c).
Subsequent to Tobias’s (1970) review, a major autopsy study was carried
out by Ho et al. (1980a, 1980b) who provided original brain weight data for
1,261 adult subjects aged 25 to 80 from Cleveland, Ohio. Ho et al. excluded
those brains obviously damaged and avoided most of the problems cited by
Tobias. Sex-combined differences were found between 811 American whites
(1,323 g; SD = 146) and 450 American blacks (1,223 g; SD = 144), a differ
ence that, according to Ho et al., remained significant after controlling for
age, stature, body weight, and total body surface area.
In the introduction to their article, Ho et al. (1980a) briefly reviewed addi
tional literature from which I calculated that Mongoloids averaged 1,334 grams,
Caucasoids 1,307 grams, and Negroids 1,289 grams. Averaging the three sets
of estimates (Tobias’s review, Ho et al.’s review, and Ho et al.’s data), I found
a sex-combined brain weight for Mongoloids of 1,351 grams, Caucasoids 1,336
grams, and Negroids 1,286 grams (Rushton, 1988b). Further, Ho et al.’s re
view suggested that, whereas the Caucasoid brain weight began to decline at
age 25, the Mongoloid brain weight may not do so until age 35.
Endocranial Volume
Many more studies have estimated brain size from cranial capacity, for, as
J. R. Baker (1974: 429) remarked, “Skulls are many, freshly removed brains
are few.” This literature too has undergone serious critiques, for example, by
Gould, first published in Science (1978), and then his book, The Mismeasure](https://image.slidesharecdn.com/race-evolution-and-behavior-ocr-230107100736-b0704676/85/Rushton-Race-Evolution-and-Behavior-155-320.jpg)
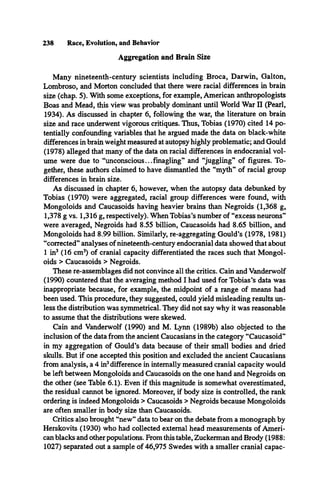
![Race, Brain Size, and Intelligence 119
TABLE 6.2
Cranial Capacities Calculated from Head Lengths and Widths Provided
by Herskovits (1930) for Various Male Samples and Classified by
Race or Geographical Region
Race/region and grou p
Sa m p le
s iz e
L e n g th
(m m )
W id th
(m m)
C r a n ia l
c a p a c ity
(cm 3)
Mongoloids/Asian
Pure Sioux 540 194.90 155.10 1,453
Half-blood Sioux 77 194.40 154.30 1,441
Montagnais-Naskapi 50 194.00 157.10 1,470
Marquesans 83 193.20 153.20 1,420
Hawaiians 86 191.25 158.93 1,472
Mean 193.55 155.73 1,451
Caucasoids/European
Old Americans 727 197.28 153.76 1,454
Foreign-bom Scotch 263 196.70 153.80 1,451
Oxford students 959 196.05 152.84 1,435
Aberdeen students 493 194.80 153.40 1,433
Swedes 46,975 193.84 150.40 1,393
Cambridge students 1,000 193.51 153.96 1,431
Cairo natives 802 190.52 144.45 1,302
Foreign-bom Bohemians 450 189.80 159.10 1,465
American-born Bohemians 60 188.00 156.50 1,423
Mean 193.39 153.13 1,421
Negroids/African
American Negroes 961 196.52 151.38 1,422
Masai 91 194.67 142.49 1,308
Lotuko 34 192.90 141.30 1,283
Kajiji 55 192.31 144.56 1,316
Somali 27 191.81 143.19 1,297
Ekoi 19 191.05 143.16 1,291
Vai 40 188.85 142.45 1,268
Akikuyu 384 188.72 143.25 1,276
Kagoro 72 188.19 142.43 1,263
Akamba 128 187.80 143.63 1,275
Ashanti 48 187.33 145.01 1,287
Acholi 30 187.30 141.80 1,250
Mean 190.62 143.72 1,295
Note. From Rushton (1993, p. 230, Table 1). Copyright 1993 by Pergamon Press. Reprinted with
permission. Cranial capacity (cm3
) - [6.752 x (L - 11mm)] + [11.421 x (W - 11mm)] - 1434.06.
Formula is from Lee and Pearson (1901).
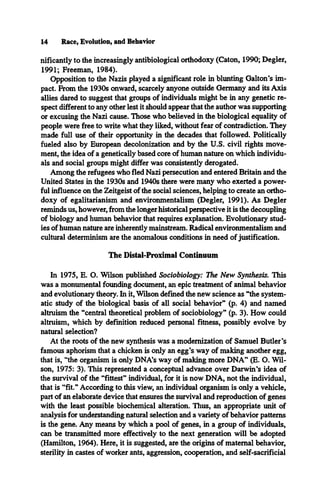
Using equation 3 ,1 calculated cranial capacities for each sample and then
took averages. I found that 5 “Mongoloid” samples (in this case, mostly North
American Indians) averaged 1,451 cm3{SD = 22), 9 Caucasoid samples aver
aged 1,421 cm3{SD = 49), and 12 Negroid samples averaged 1,295 cm3{SD =
44). Treating each sample mean as an independent entry, a one-way ANOVA
revealed that the races differed significantly in brain size with a highly sig-](https://image.slidesharecdn.com/race-evolution-and-behavior-ocr-230107100736-b0704676/85/Rushton-Race-Evolution-and-Behavior-160-320.jpg)
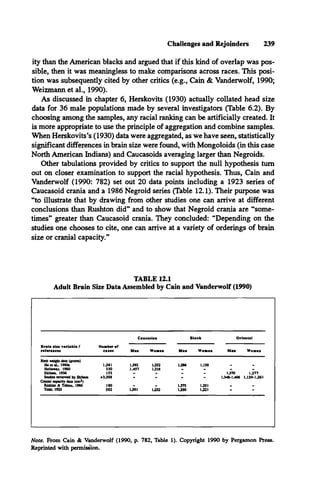
![TABLE 6.3
Anthropometric Variables for Male Military Samples from NASA (1978)
Race/NASA identification
number, and group
Sample
size
Head
length
(mm)
Head
breadth
(mm)
Head
height
(mm)
Stature
(cm)
Weight
(gms)
Surface
area
(m2)
Cranial
capacity
(cm3)
Encephal
ization
quotient
Orientals
84. Thai military, 1963 2,950 179.0 152.0 128.0 163.40 56,300 1.60 1,340 7.33
85. Vietnam military, 1964 2,129 181.9 149.0 123.3 160.43 51,100 1.52 1,299 7.58
86. South Korean Air Force, 1961 264 184.1 154.9 130.4 168.66 62,840 1.72 1,408 7.16
87. South Korean military, 1965 3,747 179.0 153.0 125.0 165.20 59,400 1.65 1.323 6.98
Mean 181.0 752.2 126.7 164.42 57,410 1.62 1,343 7.26
SD 2J 2.5 3.2 3.38 4,983 .08 47 .26
Caucasoids
18. U.S. Air Force fliers, 1950 4,063 197.0 154.1 129.7 175.56 74,100 1.90 1,471 6.69
19. U.S. Air Force, 1965 3,827 196.2 153.1 131.8 175.28 70,980 1.86 1,477 6.92
24. U.S. Navy fliers, 1965 1,549 198.3 155.6 131.1 177.64 77,760 1.95 1,502 6.62
25. U.S. Air Force, 1967 2,420 198.7 156.0 134.5 177.34 78,740 1.96 1,539 6.72
30. U.S. Army, 1966 6,682 194.7 152.7 132.3 174.52 72,160 1.87 1,470 6.81
31. U.S. Navy, 1966 4,095 194.2 152.3 135.4 175.33 71,560 1.87 1,491 6.95
32. U.S. Navy divers. 1972 100 197.5 154.0 142.6 176.22 81,520 1.98 1,589 6.78
33. U.S. Marines, 1966 2,008 194.3 152.8 133.8 174.56 72,650 1.87 1,482 6.83
34. U.S. Army aviators, 1959 500 197.3 155.4 126.7 176.52 71,100 1.87 1,455 6.81
36. U.S. Army aviators, 1970 1,482 197.0 152.6 132.9 174.56 77,630 1.93 1,488 6.56
48. NATO military. 1961 3,356 189.7 155.5 131.8 170.22 67,660 1.79 1,457 7.05
59. German Air Force, 1975 1,465 191.6 156.8 129.2 176.66 74,730 1.91 1,455 6.58
65. British soldiers, 1972 500 197.8 155.1 127.3 174.05 73,190 1.88 1,461 6.70
66. British Air Force, 1971 2,000 199.0 157.8 130.3 177.44 75,040 1.92 1,516 6.84
68. Canadian Air Force, 1961 314 193.5 152.9 131.5 177.44 76,410 1.94 1,458 6.50
69. Canadian Air Force, 1961 290 193.8 152.9 129.7 176.68 75,550 1.92 1,444 6.49
70. New Zealand Air Force, 1973 238 197.1 152.1 132.5 176.95 75,280 1.92 1,481 6.67
75. Latin American Forces, 1972 1,985 186.0 152.0 122.0 167.00 65,900 1.74 1,329 6.54
77. French young men, 1967 2,000 195.0 154.5 125.1 171.99 63,850 1.75 1,421 7.14
90. Iranian military, 1969 9.414 187.4 148.6 127.1 166.85 61,630 1.69 1,356 6.98
Mean 195.3 153.9 130.9 / 74.66 72,872 1.88 1,470 6.76
SD 3.7 2.1 4.4 3.21 5,114 .09 58 .20
Note. From Rushton (1991b, pp. 356-357, Table 1). Copyright 1991 by Ablex Publishing Corporation. Reprinted with permission.
Surface area (m2) = [wt (kgms)0425x ht (cm)0-7
2
5x 0.007184].
Cranial capacity (cm3
) = 0.000337 (Head length - 11 mm) (Head Breadth - 11 mm) + 406.01.
Encephalization quotient = Observed cranial capacity (cm3
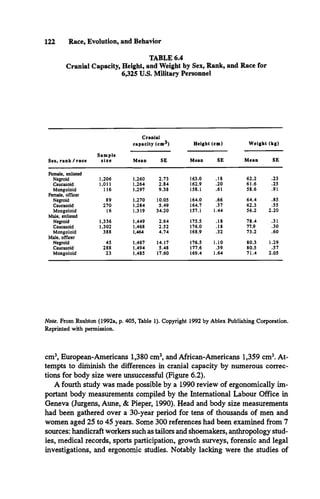
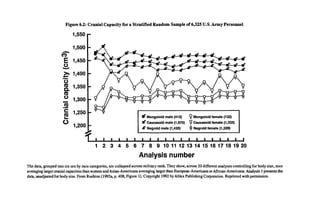
)/Expected cranial capacity, i.e., (0.12) (Body weight in gms)067.](https://image.slidesharecdn.com/race-evolution-and-behavior-ocr-230107100736-b0704676/85/Rushton-Race-Evolution-and-Behavior-162-320.jpg)
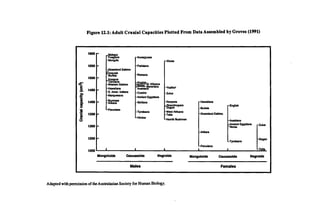
![TABLE 6.5
Cranial Capacities of World Populations of 25 to 45-Year-Olds
124 Race, Evolution, and Behavior
R eg io n , n u m b e r o f referen ces,
and source countries
M e n W om en
S tature
(m m )
Head
le n g th
(m m )
Head
breadth
(m m )
C ra n ia l
c a p a c ity
(c m 3 )
S tature
(m m )
Head
le n g th
(m m )
Head
breadth
(m m )
C ra n ia l
c a p a c ity
(c m 3 )
1. North America (34 refs, from
Canada and U.S.A.)
1,790 195 155 1,453 1,650 180 145 1,191
2. Latin America (2 0 refs, from
Indian populations in Bolivia,
Peru, etc.)
1,620 185 ISO 1,328 1.480 175 145 1,152
3 . Latin America (IS refs, from
European-Negroid populations
in Chile, the Caribbean Island
States, etc.)
1.750 190 155 1.419 1,620 175 150 1,206
4 . Nonhem Europe (28 refs, from
Denmark, Sweden, etc.)
1,810 195 155 1,453 1,690 180 150 1,246
5 . Central Europe (42 refs, from
Austria. Switzerland, etc.)
1.770 190 155 1.419 1,660 180 145 1,191
6. Eastern Europe (14 refs, from
Poland and Soviet Union)
1,750 190 155 1.419 1,630 180 150 1,246
7. South-eastern Europe (40 refs,
from Bulgaria. Romania, etc.)
1.730 190 155 1.419 1,620 175 150 1.206
8. France (20 refs.) 1.770 195 155 1.453 1,630 180 140 1,137
9. Iberian Peninsula (6 refs, from
Spain and Portugal)
1.710 185 155 1.385 1,600 180 150 1.246
10. North Africa (10 refs, from
Algeria, Ethiopia, Sudan, etc.)
1,690 190 145 1,305 1,610 185 140 1,177
11. West Africa (10 refs, from
Congo. Ghana, Nigeria, etc.)
1,670 195 145 1,339 1,530 180 135 1,083
12. South-eastern Africa (16 refs,
from Angola, Kenya, etc.)
1,680 195 145 1.339 1,570 180 135 1,083
13. Near East (5 refs, from Iraq,
Lebanon, Turkey, etc.)
1,710 190 150 1,362 1,610 180 140 1,137
14. North India (23 refs, from
Bangladesh. Nepal, etc.)
1,670 190 145 1,305 1.540 180 135 1,083
15. South India (3 refs, from India
and Sri Lanka)
1.620 180 145 1.237 1,500 175 130 989
16. North Asia (5 refs, from China,
Mongolia, etc.)
1,690 190 150 1.362 1,590 180 145 1,191
17. South China (9 refs, from
Macao, Taiwan, etc.)
1,660 190 ISO 1,362 1,520 180 145 1,191
18. South-East Asia (11 refs, from
Brunei, Indonesia, Malaysia,
Philippines, etc.)
1.630 185 145 1.271 1,530 175 13S 1.043
19. Australia (6 refs, from
European population in
Australia and New Zealand)
1,770 192 155 1.433 1,670 180 145 1,191
20. Japan (26 refs, from Japan
and Korea)
1,720 190 155 1.419 1,590 180 145 1,191
Note. From Rushton (1994, Table 1).
Cranial capacity for men (cm3
) ° [6.752 x (Head length - 11 mm) + 11.421 x (Head breadth - 11
mm)] - 1434.06.
Cranial capacity for women (cm3
) » [7.884 x (Head length - 11 mm) + 10.842 x (Head breadth -
11 mm) - 1593.96. Formulas are from Lee and Pearson (1901).
military personnel examined above, thus making these new data independent
of previous sets.
Jurgens et al. (1990) grouped their data into 20 world regions. Summarized
in Table 6.5 are the 50th percentile measures of stature, head length, and head
breadth, separately for men and women as well as the number of references
cited to arrive at the summarized figures. From these I derived cranial capaci
ties using equations (4) and (5) above (Rushton, 1994).](https://image.slidesharecdn.com/race-evolution-and-behavior-ocr-230107100736-b0704676/85/Rushton-Race-Evolution-and-Behavior-165-320.jpg)
![126 Race, Evolution, and Behavior
tile points smaller. With IQ measured at 4 and at 7 years of age, white children
show a 34 percentile point advantage (1 standard deviation).
Adolescents have also been examined. R. Lynn (1993) used Lee and
Pearson’s (1901) equations (1) and (2) to calculate cranial capacities from
external head measurements on 36 samples of 7- to 15-year-olds gathered by
the Philadelphia Growth Center (Krogman, 1970). The core sample consisted
of 169 white males, 224 black males, 135 white females, and 220 black fe
males. The boys and girls had all been screened for serious illnesses or dental
problems and were middle-class from “a solid, stable responsible cross sec
tion of the population” (Krogman, 1970: 4). After adjusting for the effects of
age, stature, and sex, white children averaged 1,250 cm3 and black children
averaged 1,236 cm3.
Summary of Brain Size Data
Table 6.6 summarizes the results from 44 studies of race differences in
adult brain size from the 3 different methods discussed: wet brain weights
from autopsies (grams), endocranial volume (cm3), and external head mea
surements (cm3). The brain size in grams can be converted to cranial capacity
in cubic centimeters and vice versa. J. R. Baker (1974: 429) provided an equa
tion for changing cm3to grams:
Brain weight [g] = 1.065 cm3- 195 (5)
To convert brain weight into cranial capacity, a specific gravity of 1.036
has often been assumed. Thus:
Cranial capacity (cm3) = 1.036 g (6)
These equations do not result in the same product. Equation (6) has been
used in modem studies (e.g., Hofman, 1991) and will be used here to convert
the autopsy data in Table 6.6 from grams to cm3.
There are four sets of data itemized and then averaged in Table 6.6. Section A
sets out the results of autopsy studies. There were 38 of these, including 16reports
of data from Korea and Japan, 18 from Caucasoids in Europe and the United
States, and 8from Negroids inAfrica and the United States. The results are shown
for men and women separately where possible. For some studies, key reviews
were used because the originals were unpublished, in a foreign language, or other
wise difficult to obtain. In the studies cited by Dekaban and Sadowsky (1978) I
calculated the mean as the midpoint of a range. Double entries have been elimi
nated whenever found. After the 38th autopsy study, summary statistics are pro
vided for each racial group showing the number of studies, the range, the mean,
and the median. The sex-combined averages are calculated by adding the mean
and median figures for men and women and dividing by two. Following this, the
mean is transformed into cm3using equation (6).](https://image.slidesharecdn.com/race-evolution-and-behavior-ocr-230107100736-b0704676/85/Rushton-Race-Evolution-and-Behavior-167-320.jpg)
![Race, Brain Size, and Intelligence 133
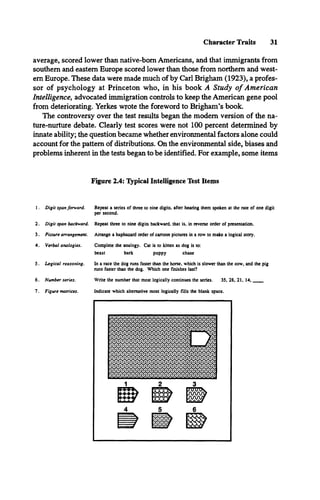
Within humans, Haug (1987: 135) has reported a correlation of r = .479 (n
= 81, p < .001) between the number of neurons in the human cerebral cortex
and brain volume in cm3, including both men and women in the sample. The
regression equating the two is given as: (# of cortical neurons [in billions] =
5.583 + 0.006 [cm3brain volume]). This means that on this estimate, Mongol
oids, who average 1,364 cm3have 13.767 billion cortical neurons (13.767 x
109). Caucasoids who average 1,347 cm3have 13.665 billion such neurons,
102 million less than Mongoloids. Negroids who average 1,267 cm3, have
13.185 billion cerebral neurons, 582 million less than Mongoloids and 480
million less than Caucasoids.
Overall the human brain has been estimated to contain up to 100 billion
(101
1
) nerve cells classifiable into about 10,000 different types (Kandel, 1991).
There may be 100,000 billion synapses. Even storing information at the low
average rate of one bit per synapse, which would require two levels of synap
tic activity (high and low), the structure as a whole would generate 101
4bits.
Contemporary supercomputers, by comparison, command a memory of about
109bits of information.
Most neural tissue goes to maintain bodily functions. Over and above this
are “excess neurons” available for general adaptive purposes (Jerison, 1973).
However crude the current estimates, hundreds of millions of cerebral cortex
neurons differentiate Mongoloids from Negroids (582 x 106based on those
just calculated; 440 x 106based on those averaged from Tobias as described
on page 114). These are probably sufficient to underlie the proportionate
achievements in intelligence and social organization. The half-billion neuron
difference between Mongoloids and Negroids are probably all “excess neu
rons” because, as mentioned, Mongoloids are often shorter in height and lighter
in weight than Negroids. The Mongoloid-Negroid difference in brain size across
so many estimation procedures is striking.
Intelligence Test Scores
Since the time of World War I, when widespread testing began, African-
descended people have scored lower than whites on assessments of intelli
gence and educational attainment (Loehlin et al., 1975). Fewer people are
aware that Orientals often score higher than whites on the same tests whether
assessed in Canada and the United States, or in their home countries (P. E.
Vernon, 1982). In an overview of mathematics education, for example, Steen
(1987) showed that within the United States, the proportion of Oriental-Ameri
can students who achieve high mathematics scores (above 650) on the Scho
lastic Aptitude Test is twice the national average while the proportion of black
students who do so is much less than one-fourth the national average.
A review of the global distribution of intelligence test scores has been pro
vided by Richard Lynn (1991c). The mean IQs for whites in the United States,](https://image.slidesharecdn.com/race-evolution-and-behavior-ocr-230107100736-b0704676/85/Rushton-Race-Evolution-and-Behavior-174-320.jpg)
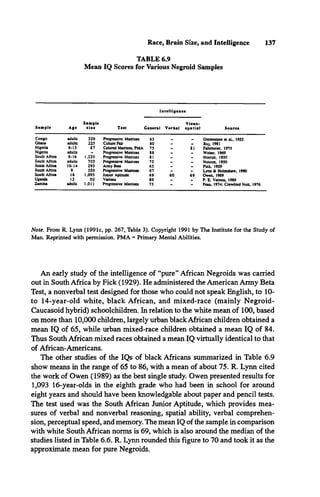
![138 Race, Evolution, and Behavior
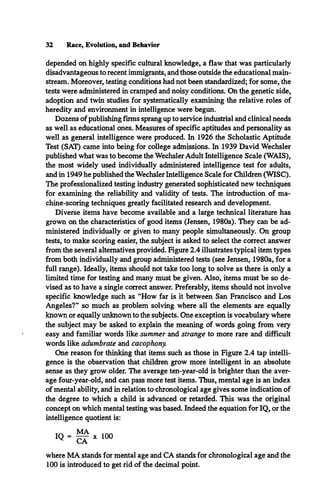
Since R. Lynn’s review, Owen (1992) has published another South Af
rican study. He gave Raven’s Standard Progressive Matrices to four groups
of high school students. The results showed clear racial mean differences
with 1,065 whites = 45.27 (SD = 6.34); 1,063 East Indians = 41.99 (SD =
8.24); 778 mixed races = 36.69 (SD = 8.89); and 1,093 pure Negroids =
27.65 (SD = 10.72). Thus, Negroids are from 1.5 to 2.7 standard devia
tions below the two Caucasoid populations and about 1 standard deviation
lower than the mixed races. The four groups showed little difference in
test reliabilities, the rank order of item difficulties, item discrimination
values, and the loadings of items on the first principal component. Owen
(1992: 149) concluded: “Consequently, from a psychometric point of view,
the [test] is not culturally biased.”
R. Lynn also summarized the results of studies of the intelligence of
Amerindians. The mean IQs have invariably been found to be somewhat be
low that of Caucasoids. The largest study is that of Coleman et al. (1966),
which obtained a mean of 94, but a number of studies have reported means in
the 70 to 90 range. The median of the 15 studies listed is 89, which Lynn took
as a reasonable approximation, indicating that the Amerindian mean IQ falls
somewhere between that of Caucasoids and Negroid-Caucasoid hybrids. The
same intermediate position is occupied by Amerindians in performance on the
Scholastic Aptitude Test (Wainer, 1988).
In addition, all the studies ofAmerindians have found that they have higher
visuospatial than verbal IQs. The studies listed are those where the Amerindians
speak English as their first language, so this pattern of results is unlikely to be
solely due to the difficulty of taking the verbal tests in an unfamiliar language.
The verbal-visuospatial disparity is also picked up in the Scholastic Aptitude
Test, where Amerindians invariably score higher on the mathematical test than
on the verbal (Wainer, 1988).
Finally, R. Lynn examined the published IQ scores for several Southeast
Asian peoples, including Polynesians, Micronesians, Melanesians, Maoris, and
Australian aborigines. Apart from the low mean of 67 for a small sample of
Australian aborigine children, all the mean IQs lie in the range of 80-95. The
one study to include measures of general, verbal, and visuospatial abilities for
New Zealand Maoris shows that this population does not share the strong
visuospatial-weak verbal ability profile of Mongoloids and Amerindians. Al
though the intelligence of this group of peoples has not been extensively re
searched, R. Lynn suggested there are sufficient studies to suggest a mean IQ
of about 90.
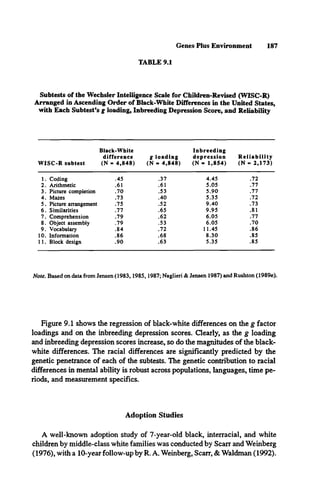
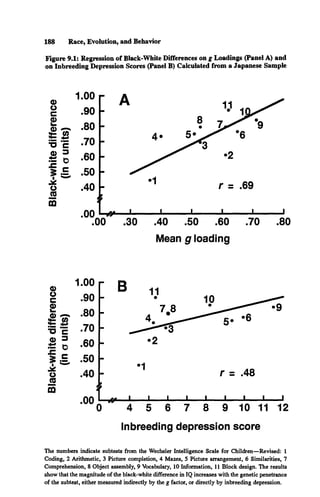
Spearman’s g
Although the black and white populations in the United States differ, on
average, by about 15 IQ points, they differ by various amounts on different](https://image.slidesharecdn.com/race-evolution-and-behavior-ocr-230107100736-b0704676/85/Rushton-Race-Evolution-and-Behavior-179-320.jpg)
![160 Race, Evolution, and Behavior
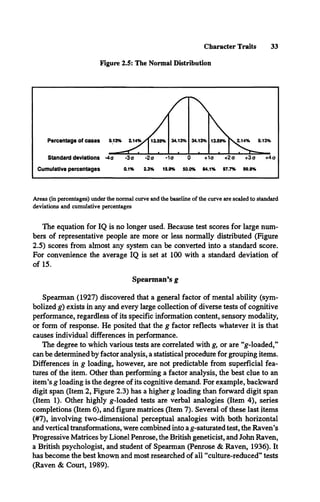
The means and standard deviations for the three racial groups broken down
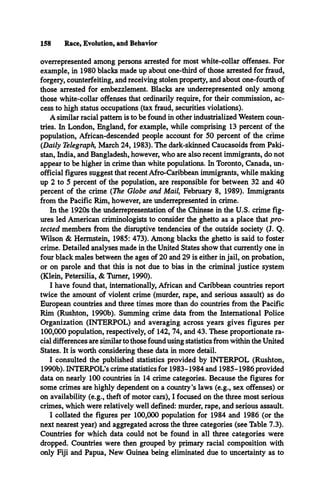
by type of crime are shown in Table 7.3. If each country is treated as an inde
pendent entry, the results of one-way ANOVAS reveal that the races differ
significantly in crime production. Using the aggregates, significant linear trends
show Mongoloids < Caucasoids < Negroids for both 1984 [F (1,69) = 5.20, p
< 0.05] and 1986 [F (1, 86) = 4.99, p < 0.05]. A nonparametric analysis of
these ratio figures shows that the exact probability of getting this particular
ranking twice in a row is 1/6 x 1/6 = 0.027.
Social Organization
A similar racial pattern is found when assessing administrative cohesion
and political organization, either contemporaneously or historically. Twenty-
five hundred years ago, China governed 50 million people via an imperial
bureaucracy with universally administered entrance exams leading to the In
ner Cabinet, an achievement that surpassed those of equivalent European civi
lizations, including that of the Roman Empire. In Africa, however, written
languages were not invented and the degree of bureaucratic organization there
fore necessarily limited.
One way of assessing a government’s administrative ability is its capacity
for conducting an accurate census. The United States conducts one of these
every ten years and there is, of course, a margin of error. The amount of error
in the U.S. census is considered small relative to African and Caribbean coun
tries whose population statistics are notoriously poor, but large compared to a
census conducted over ten days beginning July 1,1990 in the People’s Repub
lic of China. There were over 1 million census takers organized for the popu
lation of 1 billion people.
The disorganization of African and African-American societies relative to
those elsewhere in the world is increasingly the focus of concerned commen
tary. In the United States, the optimism generated by the Civil Rights move
ment of the 1950s, culminating in the Civil Rights Act of 1964 has almost
completely dissipated. The abysmal social and financial conditions of poverty
and unemployment, drugs and crime, teenage parenthood, and wretched edu
cational achievement in black urban centers provide problems of gigantic pro
portion for the future (Jaynes & Williams, 1989).
Some see the city of Detroit as a harbinger of what is to come. In the early
1960s Detroit seemed like a model American city. Industry was booming as
both blacks and whites found steady work in the automobile industry. But in
1967 the worst race riot in American history erupted. Overnight, Detroit was
violently jerked from being a prosperous, integrated industrial center to that
of a chaotic, seething ghetto. The anarchic conditions and political rhetoric
surrounding black city-states like Detroit have been recorded by the Israeli](https://image.slidesharecdn.com/race-evolution-and-behavior-ocr-230107100736-b0704676/85/Rushton-Race-Evolution-and-Behavior-201-320.jpg)

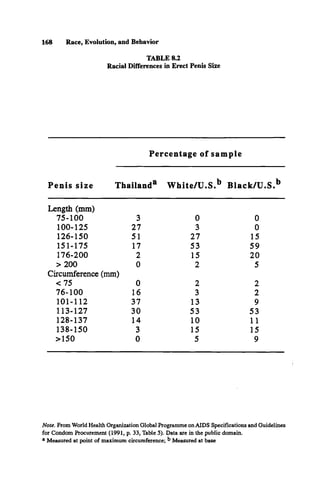
![Sexual Potency, Hormones, and AIDS 169
any of a variety of lengths, provided that the condom is sufficiently long to
accommodate at least the 95th percentile. Based on Kinsey Institute data for
African American and white males in the United States and additional data
from Thailand, the optimum lengths might be 180 mm for the Asian popula
tions, 190 mm for the Caucasian populations, and 200 mm for the African
populations (Program for Appropriate Technology in Health, 1991).
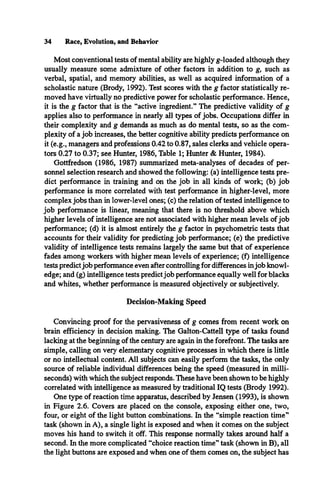
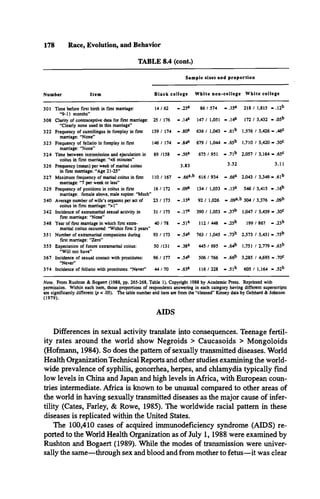
Data provided by the Kinsey Institute have confirmed the black-white dif
ference in penis size (Table 8.2, and items 70-72 of Table 8.4). Alfred Kinsey
and his colleagues instructed their respondents on how to measure their penis
along the top surface, from belly to tip. The respondents were given cards to
fill out and return in preaddressed stamped envelopes. Nobile (1982) pub
lished the first averages of these data finding the length and circumferences of
the penis for the white samples was smaller than for the black sample. (Flac
cid length = 3.86 inches [9.80 cm] vs. 4.34 inches [11.02 cm]; erect length =
6.15 inches [15.62 cm] vs. 6.44 inches [16.36 cm]; erect circumference = 4.83
inches [12.27 cm] vs. 4.96 inches [12.60 cm] respectively.)
Measures of the size of the testes, either taken from living subjects or from
those at autopsy, show that this is twofold lower in Asian men than Europeans
(9 vs. 21 g). These differences are too large to be accounted for in terms of
body size (Harvey & May, 1989; Short, 1979, 1984). According to Harvey
and May (1989) this size differential means that individual Caucasians pro
duce about twice the number of spermatozoa per day than do Chinese (185-253
x 106compared with 84 x 106). Larger scrotal circumferences have sometimes
been reported in Africans than in Europeans (Short, 1979; Ajmani, Jain, &
Saxena, 1985).
Sex Hormones
In an early study by W. Freeman (1934), racial-group differences in the
weight of the hypophysis (pituitary) were suggested, with blacks having the
heaviest (800 mg), whites being intermediate (700 mg), and Orientals having
the lightest (600 mg). The pituitary is directly involved with the release of
gonadotropins, which stimulate the testicles and ovaries in their functions (the
release of testosterone, estradiol, and progesterone on the one hand, and sperm
and eggs on the other). This would order the population differences in rate of
multiple birthing, for gonadotropin levels differentiate the races in the pre
dicted direction (Soma, Takayama, Kiyokawa, Akaeda, & Tokoro, 1975), as
well as distinguish mothers of dizygotic twins from mothers with no dizygotic
twins (Martin, Olsen, Thiele, Beaini, Handelsman, & Bhatnager, 1984).
The proposition of a Negroid-Caucasoid-Mongoloid gradient for maternal
gonadotropin was supported by R. Lynn (1990b) in a review of the medical
literature. He provided indirect evidence from racial differences in the sex](https://image.slidesharecdn.com/race-evolution-and-behavior-ocr-230107100736-b0704676/85/Rushton-Race-Evolution-and-Behavior-210-320.jpg)
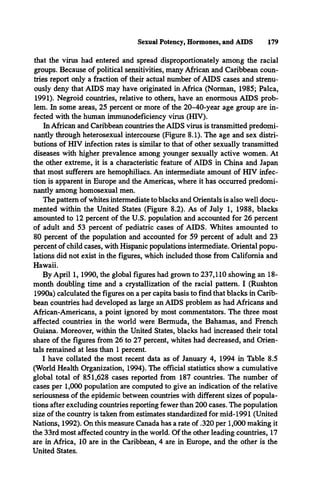
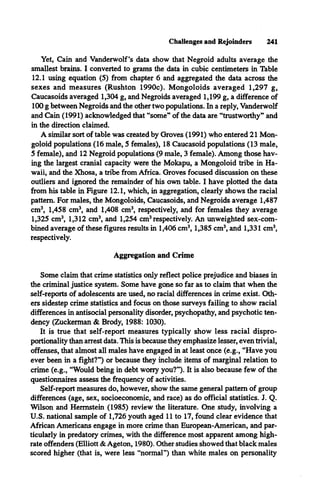
![Sexual Potency, Hormones, and AIDS 177
TABLE 8.4
Analysis of Kinsey Data on Race and Socioeconomic Status
Differences in Sexual Behavior
S am p le sizes and p ro p o rtio n
N u m b er Ite m B la c k c o lle g e W h ite n o n -c o lle g e W h ite c o lle g e
19 Genetic father's age at respondent's birth:
“26-30 and under”
189 /31 3 - .60* 677 / 1,471 - .46b 3,385 / 7,872 - .43c
20 Genetic mother's age at respondent's birth:
“26-30 and under"
275 / 348 - .79* 1,026 / 1.5^2 - .67b 5,415 / 8,082 - .67b
28 Respondent's age at genetic father's death:
“ 18 and under”
65 / 123 - .5 3 * 243 / 695 - .35b 966 / 2,300 - .42c
29 Respondent's age at genetic mother's death:
“ 19 and under”
4 9 /9 3 - . 5 3 * 175 / 472 - .37b 663 / 1,441 - .46*
30 Age respondent left parental home:
“21 years or under”
104 / 186 - .5 6 * 639 / 1,048 - .61* 1,767 / 3,606 - .49b
31 Number of siblings: “2 and under” 215 / 399 - .5 4 * 977 / 1,777 - .55* 6,423 / 9.047 - .71b
53 Age at puberty (aggregate measure):
“ 13 years and under”
292 / 400 - .7 3 * 1,238 / 1,794 - .69* 6,970 / 9,052 - .77b
69 Estimated length of erect penis:
“Less than or equal to 6.50 inches”
105 / 161 - . 6 5 * 403 / 791 - .82b 3,059 / 3,777 - .81b
70 Measured length of erect penis:
“Less than or equal to 6.25 inches"
3 0 /5 9 - .5 1 * 86 / 143 - .60*,b 1,497 / 2,376 - .63b
71 Measured length of flaccid penis:
“Less than or equal to 4.50 inches’*
4 0 /5 9 - . 6 8 * 126 / 142 - .89b 2,117 / 2.379 - .89b
72 Measured circumference of flaccid penis:
“Less than or equal to 4.00 inches”
41 / 59 - .70* 104 / 137 - .76*,b 1,825 / 2 ,3 1 0 - .79b
74 Angle of penile erection: “Penis almost
vertical or down from vertical as much
as... 8 5°”
102 / 164 - .62* 450 / 585 - .77b 3,473 / 4,396 - .79b
90 Average length of menstrua] cycle:
“28 days or less”
129 /155 - .83* 428 / 595 - .72b 1,983 / 2,916 - .68c
91 Average length of menstrual flow:
“4 days or under”
8 0 / 148 - .54* 230 / 574 - .40b 1,044 / 2,983 - .35c
99 Periodicity of female sexual response:
“No periodicity”
36 / 173 - .21*’b 153 / 767 - .20b 710 / 2,839 - .25*
100 Age hymen broken: “ 18 years or under” 67 / 126 - .53* 175 / 546 - .32b 414 / 1,594 - .26c
135 Incidence of prepubertal heterosexual
techniques: “Coitus"
116 / 400 - .29* 215 / 1,789 - .12b 814 / 9,045 - .09c
183 Reason for wony about masturbation:
“Moral (guilt, shame)"
1 3 /4 1 - .32*,b 5 6 / 206 - .27b 390 / 1,027 - .38*
199 Age of First premarital petting:
“ 15 years and under”
241 / 388 - .6 2 * 931 / 1,663 - .56b 3,929 / 8.731 - .45c
218 Age of first postpubertal coitus:
“ 17 years and under”
171 / 335 - .51* 514 / 1,286 - .40b 1,186 / 5,651 - .21c
227 Intention to have premarital coitus:
“No intention”
81 / 368 - .22* 654 / 1,487 - .44b 3,509 / 7,311 - .48c
228 Moral restraint on premarital coitus: “Much" 195 / 397 - .49* 993 / 1,655 - .60b 5,926 / 8,845 - .67c
239 Number of premarital coital companions:
“5 partners or fewer”
169 / 307 - .55* 550 / 786 - .70b 3,068 / 4,202 - .73c
268 Incidence and type of nonmarital pregnancy:
“Never”
102 / 310 - .68* 665 / 864 - .77b 3,938 / 4,633 - .85c
291 Duration of first marriage: “Under 5 years” 93 / 176 - .53* 326 / 1,053 - .31b 1,446 / 3,443 - •42c
297 Time between first marriage and first marital 5 3 /6 7 - .7 9 * 428 / 620 - .69b 1,108 / 1,705 - .65c
coitus in first marriage: “One day or less"](https://image.slidesharecdn.com/race-evolution-and-behavior-ocr-230107100736-b0704676/85/Rushton-Race-Evolution-and-Behavior-218-320.jpg)

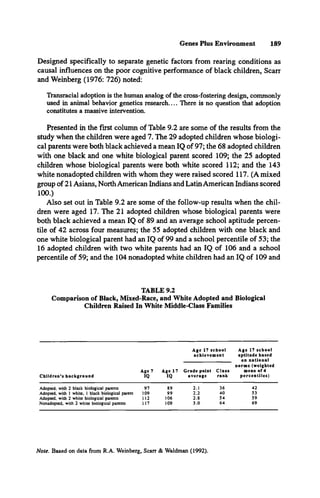
![190 Race, Evolution, and Behavior
a school percentile of 69. (The 12 adopted mixed group of Asian/Amerindian
children had an IQ of 96 with no data provided of school achievement.)
Expectancy effects, that adoptive parents* beliefs about the child’s racial
background could influence the child’s intellectual development were ruled
out, at least at age 7, by the finding that scores from 12 interracial children
believed by their adoptive parents to be black/black scored at virtually the
same level as interracial children correctly classified by their adoptive parents
(Scarr & Weinberg, 1976).
Scarr and Weinberg (1976) and R. A. Weinberg et al. (1992) did not inter
pret their results with the genetic-racial hypothesis. The poorer performance
of the all-black children was attributed to their experience of later and more
difficult placements in the adoption process and to the fact that these children
had both natural and adoptive parents with somewhat lower educational lev
els and abilities (two points lower in adoptive parents* IQ). The authors em
phasized the beneficial effects of the rearing environment, pointing out that at
both age 7 and 17 all groups of adopted children performed above their ex
pected population means. Their analyses frequently combined the two “so
cially classified black” groups with “other” black children with one parent of
unknown, Asian, Indian, or other racial background.
At age 7 this combined interracial group had an IQ of 106 and a mean
school achievement percentile across 3 measures of 56, significantly higher
than the regional black mean, although not as high as the nonadopted white
children with whom they were raised. At age 17, the combined interracial
sample had a mean IQ of 97 and a school performance at the 41st percentile,
still higher than the regional black mean, but now lower than the regional
white mean.
Although in their age 17 breakdowns, R. A. Weinberg et al. (1992: 132)
found that “[b]iological mothers* race remained the best single predictor of
adopted child’s IQ when other variables were controlled,” this was largely
attributed to “unmeasured social characteristics.” Their overall conclusion (p.
133) was that
the social environment maintains a dominant role in determining the average IQ
level of black and interracial children and that both social and genetic variables
contribute to individual variations among them.
A more straightforward interpretation of the results consistent with the other
data presented in this book, is that blacks have lower mental ability than whites
because of their African ancestry. At both age 7 and 17 the adopted children
with one black and one white biological parent had an IQ and aptitude percen
tile intermediate to the adopted children with two black or two white parents.
Because school achievement and school aptitude tests are not affected by the
potential biases that may have influenced the individual IQ testing, the con
vergence of results is striking.](https://image.slidesharecdn.com/race-evolution-and-behavior-ocr-230107100736-b0704676/85/Rushton-Race-Evolution-and-Behavior-231-320.jpg)
![Genes Plus Environment 193
[T]he question of a possible genetic basis for the race I.Q. difference will be almost
impossible to answer satisfactorily before the environmental differences between
U.S. blacks and whites have been substantially reduced...no good case can be
made for such studies on either scientific or practical grounds.
Many have reiterated Bodmer and Cavalli-Sforza’s (1970) perspective.
Thus, Weizmann, Wiener, Wiesenthal, and Ziegler (1990:4) insisted that “[o]ne
cannot generalize heritabilities... a point disputed to our knowledge only by
Rushton 1989[b].” Weizmann et al. (1990:5) went on to state that “if substan
tial changes within a population are due to environmental changes, then simi
lar explanations may also apply to differences between groups.” However, it
is a narrowly conceived argument to expect environmental relationships to
generalize and genetic ones not to. As Maynard-Smith (1978: 150) contended,
“it is a good common sense principle that if environmental factors can affect
some characteristic, it is likely that genes will do so also.”
The animal data shows a degree of genetic generalizability. Similar charac
ters tend to have similar heritabilities. Two extensive literature surveys of this
question were conducted by Roff and Mousseau (1987) for drosophila and by
Mousseau and Roff (1987) for nondrosophila. Both showed, for example, that
morphological traits are consistently more heritable than physiological vari
ables. Such findings have led an important caveat to be added to textbook
conclusions: “Whenever a value is stated for the heritability of a given char
acter it must be understood to refer to a particular population under particular
conditions__Nevertheless, within the range of sampling errors, estimates
tend to be similar in different populations” (Falconer, 1989: 164).
Regression to the Mean
In the 1970s several “indirect” approaches were proposed to test the ge
netic explanation of race differences (Loehlin et al., 1975; Scarr, 1981). One
was to examine parent-child regression effects, which are predicted to differ
for black and white samples if they are drawn from genetically different popu
lations. If the population mean for blacks is 15 IQ points lower than for whites,
then the offspring of high-IQ black parents should show more regression to
ward a lower population mean than the offspring of high-IQ white parents.
Similarly, the offspring of low-IQ black parents should show less regression
than those of low-IQ white parents.
Although not having parent-child comparisons, Jensen (1973, chapter 4)
tested the prediction with even better data, from siblings. Sibling comparisons
provide a better test than parent-offspring comparisons because siblings share
more similar environments than do parents and offspring. Jensen found that
black and white children matched for IQ have siblings who regress approxi
mately halfway to their respective population means rather than to the mean
of the combined populations.](https://image.slidesharecdn.com/race-evolution-and-behavior-ocr-230107100736-b0704676/85/Rushton-Race-Evolution-and-Behavior-234-320.jpg)

![220 Race, Evolution, and Behavior
[L]iving genes must have ancestors, whereas dead fossils may not have descen
dants. Molecular biologists know that the genes they are examining must have
been passed through lineages that survived to the present; paleontologists cannot
be sure that the fossils they examine do not lead down an evolutionary blind alley.
In an early breakthrough using molecular evidence, Sarich and Wilson
(1967) had shown that the human lineage had diverged from African apes
only 5 to 8 million years ago rather than the 25 million years ago claimed by
paleontologists. This meant that the African apes (chimpanzees and gorillas)
were genetically more closely related to human beings than they were to Asian
apes (orangutans) from whom they separated 10 to 13 million years ago. Fur
ther, humans and chimpanzees were each other’s closest relatives; chimpan
zees and humans were more similar to each other than either were to gorillas.
These conclusions on relatedness contradicted both superficial physical simi
larity and more formal anatomical analysis in which chimpanzees and gorillas
appear to be each other’s closest relative.
Sarich and Wilson’s (1967) molecular clock used blood-group systems and
proteins. Subsequent lines of evidence involved DNA hybridization, mito
chondrial (mt) DNA sequencing, and nuclear DNA sequencing. All clocks
rest on the assumption that if the rate of mutation that occurs is more or less a
constant, then by counting the number of differences between two popula
tions it is possible to estimate their time of divergence from a common ancestor.
Only 1 to 5 percent of the DNA genome is expressed as proteins. Between
95 and 99 percent consists of introns, pseudogenes, or “junk” DNA that goes
along for the ride, replicating from generation to generation without affecting
morphology at all. This superfluous DNA may not be of much use to the
organism, but is of great value for researchers. Because it is not impeded by
natural selection, mutations accumulate at an even faster rate in this “neutral”
DNA than in the coding sequences of DNA, and so provides a “fast clock” for
timing evolutionary divergences.
Using DNA hybridization, comparisons can be made of entire genomes (or
major portions of them) consisting of billions of base pairs. In the DNA double
helix, long strands wind about each other with each base pair attaching to its
complementary base in the other strand. A double strand can be “melted” by
heat into a single strand and compared with a similarly produced single strand
from another species. These “hybrid” strands melt apart at a lower tempera
ture than the originals because of the mismatches in the base pairs, like gaps
in a zip. A difference of 1 degree in temperature represents roughly a 1 per
cent difference in the sequence. Human-chimp DNA comparisons are about
20 percent more stable than human-gorilla or chimp-gorilla comparisons.
Mitochondrial DNA lies outside the nucleus of the cell and contains only
about 15,000 base pairs, contrasted with the 3 billion base pairs of the nucleus.
Mitochondrial DNA is easier to analyze than nuclear DNA, not only because
it has fewer nucleotide sites, but because it has a rate of change 5 to 10 times](https://image.slidesharecdn.com/race-evolution-and-behavior-ocr-230107100736-b0704676/85/Rushton-Race-Evolution-and-Behavior-261-320.jpg)

![236 Race, Evolution, and Behavior
breeding between formerly disparate groups. Future research using genetic
information sequences will determine more precisely genetic affiliations and
their behavioral correlates.
Constructs in science are only useful if they have explanatory power. The
three macro racial categories show much predictive and construct validity. As
has been shown, racial categories better organize disparate data than is pos
sible using only ethnicity, religion, or sociopolitical grouping. In each cat
egory of Table 1.1, Caucasoids fall between Negroids and Mongoloids. The
efficient unit of analysis, therefore, is the higher order concept of race, within
which cluster the different subdivisions, ethnic groups, and, ultimately, indi
viduals. Ignoring the concept of race not only obscures predictive order of
internationally based data, but also neglects the approach of population biolo
gists studying other species (Mayr, 1970: 186-204).
Are the Race Differences as Described?
Many critics have disputed my characterization of the pattern of racial dif
ferences. Some have charged that the data presented were misleadingly se
lected. Weizmann et al. (1991: 49) were among the most explicit:
Rushton scavenges whatever materials lay at hand, whether ecology, anthropol
ogy, psychology or paleontology. His tendentious borrowing of materials, often
themselves tainted by racism, is quite unscholarly. Libraries are full of so-called
data which can be used to support almost any point of view about the causes of
differences among people.
Similarly, Silverman (1990: 1) worried that the studies reviewed led to
conclusions that “so precisely parallel racist stereotypes that it is difficult to
dismiss the possibility of bias in the theory and/or the data.**
A complaint by M. Lynn (1989a: 3) may be nearer the truth:
[M]any of the race differences reported by Rushton and Bogaert (1987) have not
been consistently found. The authors themselves acknowledged that some studies
have failed to replicate the reported race differences in testes size, age at onset of
puberty, and biologic control of sexual interest. Other failures to replicate the re
ported race differences were not acknowledged.
My response is that critics have failed to show an opposite to predicted
ordering in brain size, intelligence, sexual restraint, law abidingness, and so
cial organizational skills. If the null hypothesis was correct, then racial differ
ences would be randomly distributed around a mean of zero with an equal
number of negative as positive instances. Although critics have discussed the
reliability of the data sources, the variability within the races, the overlap of
the distributions, the size of the samples, the magnitude of the differences,
and the change of scores over time, they have not provided contradictory data.](https://image.slidesharecdn.com/race-evolution-and-behavior-ocr-230107100736-b0704676/85/Rushton-Race-Evolution-and-Behavior-277-320.jpg)
![Challenges and Rejoinders 237
Aggregation versus Deconstruction
The principle of aggregation, a major methodological point discussed at
length in chapter 2 must now be reconsidered in the present context. The prin
ciple states that the sum of a set of measurements is more stable and unbiased
an estimator than any single measurement from the set. One reason is that
there is always error associated with measurement. When several measure
ments are combined, these errors tend to average out. Errors made in one
direction are considered to be offset by errors in another. Disregarding “outli
ers” and intragroup variance is inherent in, and is the purpose of, taking an
average.
It is necessary to belabor this obvious principle, made explicit for psycho
logical measurement in the nineteenth century, because it is so easily forgot
ten when discussing racial differences. What too often occurs is that a subset
of the data is identified, deconstructed into particulars, and special explana
tions given for the scattered fragments. These deconstructed particulars, when
re-aggregated, typically show the now familiar pattern of racial differences.
This view of the importance of aggregation has been contested. Zuckerman
and Brody (1988: 1032) concluded a critique by saying:
In sum, we find Rushton’s paper flawed in terms of its obscure logic... ignoring
of large group differences within the three major races (that are often larger than
those between the three racial groupings) and aggregating that which should not be
aggregated.
Zuckerman (1991: 985) elaborated this position: “[T]he variability within
the three ‘races’ makes the general comparisons among them meaningless,
and aggregation only serves to hide the variability.”
Others have made similar points. In the context of U.S. crime statistics,
Roberts and Gabor (1990: 299-300) stated: “Any examination of aggregate
crime statistics is going to over-estimate the true incidence of crime commit
ted by blacks relative to the amount of crime committed by whites.” Yee et al.
(1993: 1134) state that I interpret all within group variation as “error” but the
next chapter shows how untrue this is. Rather, it represents natural variation,
likely genetically based, that is common to all studied animal populations.
Finally, Weizmann, Wiener, Wiesenthal, & Ziegler (1991: 46) wrote:
Rushton’s discussion of aggregation reveals his continued misunderstanding of the
limited value of averaging multiple items, multiple instances and multiple samples.
Aggregation provides a more unbiased estimator of true population values only
where they are obscured by random error variance. It is of no use in reducing
systematic error.
The principle of aggregation is pivotal. It’s implications were discussed at
length in chapter 2 for a wide variety of nonracial domains; it is central to
other debates. Let us consider some of the examples that have been contested.](https://image.slidesharecdn.com/race-evolution-and-behavior-ocr-230107100736-b0704676/85/Rushton-Race-Evolution-and-Behavior-278-320.jpg)
![Challenges and Rejoinders 249
numbers of predators. In such conditions, mortality was relatively independent of
individual characteristics, so parents ensured their reproductive success by gener
ating a large number of offspring (that is, r-selection). By contrast, Dobzhansky
emphasized that tropical species competed most intensely with one another rather
than with the environment. The relatively benign habitat was virtually filled with
organisms, so the difference between success and failure was by producing not a
large number of offspring but rather a smaller number of well-endowed descen
dents (that is, ^-selection).
Barash, however, is incorrect. Predictability is the ecological necessity for
ÅT-selection. This can occur in either a stable environment or a predictably
variable one. What has apparently been misunderstood is that subtropical
savannahs, where humans evolved, because of sudden droughts and devastat
ing viral, bacterial, and parasitic diseases, are less predictable for long-lived
species than are temperate and especially Arctic environments. Although the
Arctic climate varies greatly over one year, it is highly predictable, but harsh,
over many years (Rushton & Ankney, 1993).
Many critics have made the classic mistake (many ecologists do also) of
confusing variable and unpredictable. Weizmann et al. (1990: 2) claimed that,
because of their longer ancestry in stable tropical climates, blacks should be
more ÅT-selected than other human groups. Miller (1993) also suggested that
the converse might be true, that arctic animals with variable winter cycles,
would be r-selected. But, of course, they are not. Long-lived arctic mammals
like polar bears, caribou, muskox, seals, and walruses are highly ÅT-selected,
as are Arctic people. The reason is that the Arctic environment is not only
highly variable, but more importantly, is highly predictable as well. (More
generally, data show that plants, lizards, and mammals become more ^-se
lected with increasing elevation and latitude [Zammuto & Millar, 1985].)
Annual food shortage in the arctic is predictable, that is, people knew that
it would be difficult to find food for 4 to 6 months every year. Thus, this
selected for ÅT-traits. If an individual had the traits necessary to plan ahead
well, the individual's genes survived. Contrast this with tropical savannahs
where disease epidemics and prolonged droughts were (and are) unpredict
able. Under such conditions an individual that produced many descendants
during favorable conditions would be most likely to have some that survived
(unpredictable) catastrophes. Alternatively, if an arctic-dwelling person put
maximal effort into mating/reproduction he or she likely wouldn't survive for
one year; their offspring certainly would not.
Additional criticisms have been made of my (Rushton, 1985a, 1988b) ver
sion of r-K theory (originally termed “differential K theory” to emphasize that
all human beings are ÅT-selected relative to other animals). Some have insisted
that r-K theory is applicable only at the level of the species or, at best, to well-
defined local populations, but is not applicable to variation within species
(Anderson, 1991; Lerner, 1992; Weizmann et al. 1990, 1991). This criticism](https://image.slidesharecdn.com/race-evolution-and-behavior-ocr-230107100736-b0704676/85/Rushton-Race-Evolution-and-Behavior-290-320.jpg)
![Challenges and Rejoinders 255
test scores over the past 50 years in 14 European and American nations, as
documented by Flynn (1984, 1987).
Eysenck (1991a: 124) applied a nutrient deficiency hypothesis to the pat
tern of race differences:
[l]t may be useful to point to ways of testing some of the consequences which
would seem to follow from my hypothesis. It would seem that Negroid children
should benefit significantly more from dietary supplementation than Caucasoid,
and Caucasoid slightly more than Mongoloid. Equally, determination of vitamin
and mineral deficiencies should find these more plentiful in Negroid than in
Caucasoid, and in Caucasoid than in Mongoloid children. African blacks should
come out worst, and benefit most. These suggestions are easily testable and find
ings should be of obvious social and scientific importance.
However, there is no evidence to show that nutrition causes an inverse
relation between brain size and gamete production. Postulating some genetic
variance seems indispensable to explain the consistency of the racial ordering
across so many attributes, including the macrophysiological variables of brain
size, egg production, and hormone level. A mixed 50 percent evolutionary
and 50 percent environmental model fits the data better than either the 100
percent environmental or the 100 percent genetic alternatives.
It is always easy to hypothesize poorly defined causal factors to explain
race differences for which there is actually no scientific evidence. Jensen (1973)
labeled these “X-factors,” that is, factors that can account for anything, but
cannot be proved or disproved. Most analyses of racial differences are super
ficial and diffuse. If understanding in this area is to advance, it is essential that
hypotheses be made with greater clarity and with the capacity for generating
differential predictions.
The mechanism of paternal provisioning has been postulated by E. M. Miller
(1993, 1994) to be a more exact specification of the evolutionary process by
which the races became differentiated. A continuum of male paternal effort is
focused on, ranging from none to maximum. Miller proposed that, in warm
climates, females can typically gather enough food to support themselves and
their children. In cold climates, however, hunting is required, and females
typically do not hunt. Thus, males in cold climates were selected to devote
more of their effort to provisioning and less to seeking matings. Thus, for
males, during the hunter-gatherer period ofhuman evolution, the optimal com
bination of mating effort and paternal investment varied with the severity of
the winters. In Africa, a strong sex drive, aggression, dominance seeking, im-
pulsivity, low anxiety, sociability, extraversion, and a morphology and muscle
enzyme suitable for fighting lead to mating success, whereas in northeastAsia,
altruism, empathy, behavioral restraint, and a long life assisted success in pro
visioning. Although Rushton and Ankney (1993) suggested that Miller’s ac
count is not different from r-K theory, Miller’s work does show the value of
highlighting particular processes.](https://image.slidesharecdn.com/race-evolution-and-behavior-ocr-230107100736-b0704676/85/Rushton-Race-Evolution-and-Behavior-296-320.jpg)


![278 Race, Evolution, and Behavior
The Bell Curve took most of the attention. It reported original analyses of
11,878 youths (3,022 of whom were African American) from the 12-year
National Longitudinal Survey of Youth (NLSY). Most 17-year-olds with high
scores on the Armed Forces Qualification Test (black as well as white) went
on to occupational success by their late twenties and early thirties whereas
many of those with low scores went on to welfare dependency. The average
IQ for “African” Americans was found to be lower than those for “Latino,”
“white,” “Asian,” and “Jewish” Americans (85, 89, 103, 106, and 115, re
spectively, pp. 273-78).
The flashpoint of discussion was whether the black/white difference was
partly genetic in origin. The Bell Curve presented a clear rendition of the
usual syllogism, that (a) IQ test scores are heritable in both black and white
populations, (b) white IQs average higher than black IQ s, therefore
probabilistically (c) the black/white IQ difference is partly heritable. This
syllogism, plus other findings like the black/white IQ difference being related
to a test’s heritability and to its loading on the general factor, or psychometric
g, led a plurality of experts in behavioral genetics and psychometrics to give
their opinion that part of the black/white IQ difference was genetic in origin
(see p. 9 of this book). Hermstein and Murray’s book represented the main
stream view of IQ researchers.
M y great admiration for The Bell Curve was overshadowed by the fact
that it did not deal thoroughly enough with the genetic basis of racial differ
ences. Equivocation was displayed even on whether “races” existed, and
the position taken seemed unnecessarily vulnerable to environmentalist at
tack. Accordingly, I sifted the evidence it presented in a special symposium
on The Bell Curve in Current Anthropology (Rushton, 1996a) and set out a
basis for why the differences could only be understood fully from a gene-
based evolutionary perspective. In an interesting afterword to the paper
back edition of The Bell Curve, Murray accepted that Hermstein and he had
played down the heritability of race differences. Citing Race, Evolution,
and Behavior, Murray drew attention to the significant and substantial rela
tionship that exists between brain size and measured intelligence, to the
differential distribution of brain size across races, and to the very low IQ
scores of Africans south of the Sahara.
The furor over The Bell Curve led the American Psychological Associa
tion (APA) to establish an 11-person task force to fill an “urgent need” for an
authoritative report “about the meaning of intelligence test scores and the
nature of intelligence” (Neisser et al., 1996:77). The report is generally even
handed, but on race it concluded: “There is certainly no [empirical] support
for a genetic interpretation” (p. 97). Because this conclusion is likely to be
cited against Race, Evolution, and Behavior, I will respond in some detail.
Among the facts omitted by the APA report are the following: (1) racial
differences in IQ and speed of decision making found within the United States](https://image.slidesharecdn.com/race-evolution-and-behavior-ocr-230107100736-b0704676/85/Rushton-Race-Evolution-and-Behavior-319-320.jpg)
![Afterword 279
are paralleled by those found internationally; (2) IQ scores relate to brain size
and, around the world, race differences in brain size parallel those in IQ; (3)
IQ subtests high in heritability predict racial differences better than do subtests
low in heritability; (4) transracial-adoption studies find that East Asian
adoptees grow to score higher on IQ tests than do white adoptees whereas
black adoptees grow to score lower than do white adoptees; (5) regression to
the mean is greater for black children of high IQ parents and siblings than it
is for white children of high IQ parents and siblings; (6) environmental influ
ences on behavior are primarily those occurring within families rather than
those occurring between families, thereby implying that factors such as rac
ism and social class do not explain racial differences; (7) other variables such
as crime, testosterone, the rate of dizygotic twinning per 1,000 births (caused
by a double ovulation), and sexual behavior show the same international ra
cial pattern as do IQ scores, with Europeans averaging intermediate to Asians
and Africans, thereby implying IQ differences are part of a broader-based life
history with roots deep in evolution.
The APA report assigned Asian Americans an average IQ of 98 based on a
review by Flynn (1991). But Lynn (1993) showed that Flynn had “overcor
rected” downwards an original review by Vernon (1982), not cited by the
APA task force, which found Asian American IQ averaged 106. Omitted, too,
was The Bell Curve's own N LSY data showing an Asian American IQ of 106.
This particular lapse was especially curious given that it was the debate over
The Bell Curve that had led the APA to set up its task force in the first place!
Although the report admitted that Asian Americans did better than Euro
pean Americans on a range of aptitude tests (e.g., ACT, SAT, G R E, M CAT),
which are known to measure reasoning ability and to correlate highly with
IQ , these were described as “content-oriented achievement tests” and linked
to the high grades Asian Americans gain in school. Higher Asian IQ scores
found in Asia were also disparaged but, again, with an acceptance of their
superior school achievement. The generally greater performance of Asians
despite equal or lower IQ was attributed to “cultural attitudes toward learn
ing,” “structural differences in the [Asian] schools,” and possibly even “spa
tial ability” and “gene-based temperamental factors” (p. 92).
The APA report did not balance the equation by mentioning the gene-
based temperament factors (discussed in chapter 7) that may play a role in
black underachievement. Instead, the report emphasized “bias” in the tests,
continuing discrimination, the alleged diminishing magnitude of black/white
IQ differences over time, and the nature of African-American culture, which
was said to alienate black children from the kind of educational processes
that work with others. One might reasonably hypothesize, however, that some
dysfunctional aspects of African-American culture, including denigration of
educational achievement (D’Souza, 1995), areproducts of, rather than causes
of, low IQ.](https://image.slidesharecdn.com/race-evolution-and-behavior-ocr-230107100736-b0704676/85/Rushton-Race-Evolution-and-Behavior-320-320.jpg)
![Sexual Behavior and AIDS
288 Race, Evolution, and Behavior
Fueled in part by concern over the lethal epidemic of sexually transmitted
disease, several major surveys of sexual behavior have confirmed the Asian/
white/black pattern described in chapter 8. One study of 356 Asian and 346
non-Asian university students at the University of British Columbia in Canada
found that Asian students were significantly more “restrained” than were
non-Asian students on measures of interpersonal sexual behavior (e.g., pet
ting, intercourse), intrapersonal sexual behavior (e.g., fantasy, masturbation),
and sexual permissiveness (e.g., lifetime number of partners, number of “one-
night stands” ). The length of residency in Canada was typically unrelated to
Asian behavior. Asian students bom in Canada were as restrained as those
who had only recently immigrated (Meston, Trapnell, & Gorzalka, 1996).
One prominent environmentalist theory of sociosexuality holds that Chi
nese people, relative to Europeans, inhabit a “collectivist” rather than an “in
dividualist” culture, thereby leading to self-restraint. Meston et al. (1996)
pointed to a problem with this theory, namely, Africans also embrace collec
tivist cultures but are less sexually restrained than are Europeans. Moreover,
the authors noted, sexual restraint in China is apparent over a 1,000-year
period of history covering several epochs so needs a more deeply rooted ex
planation. Meston et al. concluded that their results supported “ [Rushton’s]
hypothesis of 'racial’ (i.e., biological or genetic) differences among ethnic
groups in sexual expressiveness and drive” (p. 64).
Results from the A Youth At Risk Behavior Survey featured in chapter 8
continue to be published by the Centers for Disease Control and Prevention.
Large-scale surveys of sexual behavior in the United States (Laumann, Gagnon,
Michael, & Michaels, 1994) and Britain (Johnson, Wadsworth, Wellings, Feld,
& Bradshaw, 1994) have also appeared. All these tend to confirm that blacks
are sexually more active at an earlier age than whites who are sexually more
active at an earlier age than Asians.
In chapter 8 ,1 drew out the implications of racial differences in sexual
behavior for the worldwide distribution of sexually transmitted diseases such
as A ID S. The rapid worldwide rate of increase in A ID S continues (cur
rently 26 percent a year) and, in their latest report, the World Health Orga
nization (1996) showed that over one and a quarter million adult cases had
been reported from 193 countries as a result of the pandemic. Allowing for
under-diagnosis, incomplete reporting, and reporting delay, the true figure
is estimated to be about 6 million, and approximately 17 million people are
estimated to have the human immunodeficiency virus (HIV) which causes
the disease.
The World Health Organization (1996) extrapolated for each country the
per capita prevalence of HIV. The results are truly stunning. Forty-seven
countries were estimated to have 1 percent or more of their sexually active](https://image.slidesharecdn.com/race-evolution-and-behavior-ocr-230107100736-b0704676/85/Rushton-Race-Evolution-and-Behavior-329-320.jpg)


The document discusses the controversial theories of J. Philippe Rushton in his book 'Race, Evolution, and Behavior,' asserting that different human races evolved distinct reproductive strategies linked to environmental challenges, resulting in variations in traits such as intelligence and behavior. It highlights various scholarly perspectives and supports his claims with a wealth of empirical data, while also acknowledging the contentious nature of the subject and the resistance faced in academic circles. The text serves as a comprehensive examination of the relationships between race and biological factors, calling for a candid discussion about racial differences amid prevailing social taboos.


![Giao tiep phi ngon ngu ky nang xa giao-pl [compatibility mode]](https://cdn.slidesharecdn.com/ss_thumbnails/giaotiepphingonngu-kynangxagiao-plcompatibilitymode-110928212548-phpapp01-thumbnail.jpg?width=640&height=640&fit=bounds)


