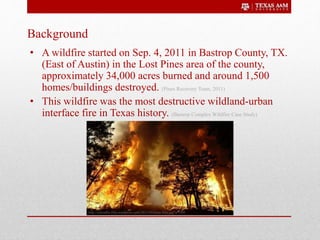
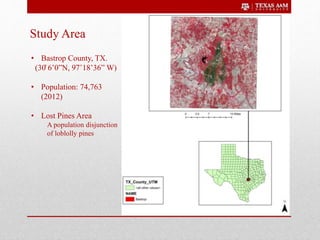
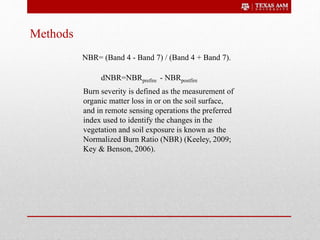
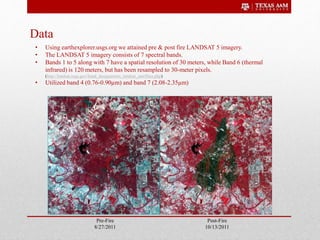
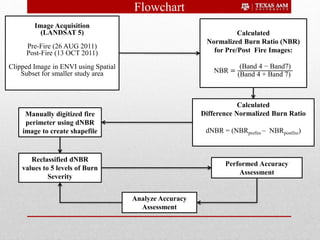
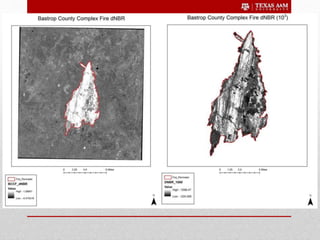
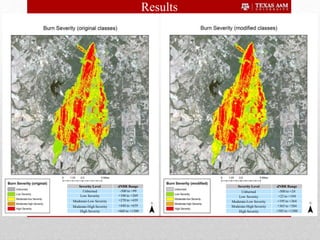
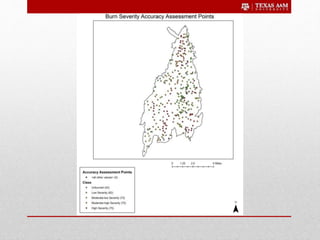
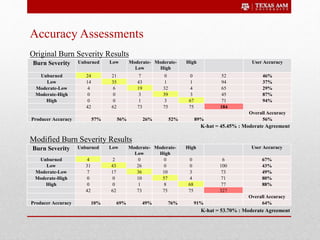
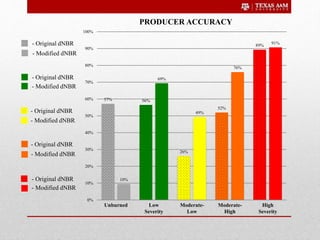
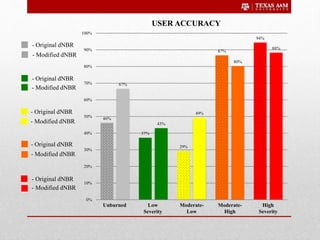
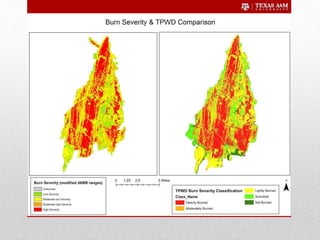
Bastrop County Complex
Fire
A Low Cost Burn Severity Estimate
Presented by:
Eric R. Maurer, Eric Putman, & Nicholas Stokes
ESSM 444 - 500
http://farm7.static.flickr.com/6069/6122579403_ce4e97e7a3.jpg
Outline
• Objectives
Assess the burn severity of the Bastrop County Complex Fire (BCCF) of 2011 by
utilizing the Normalized Burn Ratio (NBR) and difference Normalized Burn Ratio
(dNBR)
• Background/Study Area
Bastrop County Complex Fire (BCCF) of 2011
Bastrop County, TX. - Lost Pines Region
• Methods
Data
Flowchart
• Results
Burn severity maps
Review accuracy assessment
• Discussion/Conclusion
• Assess the burn severity of the Bastrop County Complex Fire (BCCF) of
2011 by utilizing the Normalized Burn Ratio (NBR) and difference
Normalized Burn Ratio (dNBR)
• Using the resultant dNBR calculations, classify the Bastrop County
Complex Fire into a range of 5 burn severity classes and delineate the
boundaries of the fire.
• Use the following methods learned in laboratory exercises:
band math, image preprocessing/statistics extraction, image classification,
and accuracy assessment.
Objectives
Background
• A wildfire started on Sep. 4, 2011 in Bastrop County, TX.
(East of Austin) in the Lost Pines area of the county,
approximately 34,000 acres burned and around 1,500
homes/buildings destroyed. (Pines Recovery Team, 2011)
• This wildfire was the most destructive wildland-urban
interface fire in Texas history. (Bastrop Complex Wildfire Case Study)
http://cravedfw.files.wordpress.com/2011/09/texas-fires.jpg?w=500
Study Area
• Bastrop County, TX.
(30̊ 6’0”N, 97˚18’36” W)
• Population: 74,763
(2012)
• Lost Pines Area
A population disjunction
of loblolly pines
Methods
Burn severity is defined as the measurement of
organic matter loss in or on the soil surface,
and in remote sensing operations the preferred
index used to identify the changes in the
vegetation and soil exposure is known as the
Normalized Burn Ratio (NBR) (Keeley, 2009;
Key & Benson, 2006).
NBR= (Band 4 - Band 7) / (Band 4 + Band 7).
dNBR=NBRprefire - NBRpostfire
Data
Post-Fire
10/13/2011
Pre-Fire
8/27/2011
• Using earthexplorer.usgs.org we attained pre & post fire LANDSAT 5 imagery.
• The LANDSAT 5 imagery consists of 7 spectral bands.
• Bands 1 to 5 along with 7 have a spatial resolution of 30 meters, while Band 6 (thermal
infrared) is 120 meters, but has been resampled to 30-meter pixels.
(http://landsat.usgs.gov/band_designations_landsat_satellites.php)
• Utilized band 4 (0.76-0.90µm) and band 7 (2.08-2.35µm)
Flowchart
Image Acquisition
(LANDSAT 5)
Pre-Fire (26 AUG 2011)
Post-Fire (13 OCT 2011)
Clipped Image in ENVI using Spatial
Subset for smaller study area
Calculated
Normalized Burn Ratio (NBR)
for Pre/Post Fire Images:
NBR =
(Band 4 − Band7)
(Band 4 + Band 7)
Calculated
Difference Normalized Burn Ratio
dNBR = (NBRprefire – NBRpostfire)
Manually digitized fire
perimeter using dNBR
image to create shapefile
Reclassified dNBR
values to 5 levels of Burn
Severity
Performed Accuracy
Assessment
Analyze Accuracy
Assessment
Severity Level dNBR Range
Unburned -500 to +99
Low Severity +100 to +269
Moderate-Low Severity +270 to +439
Moderate-High Severity +440 to +659
High Severity +660 to +1300
Severity Level dNBR Range
Unburned -500 to +24
Low Severity +25 to +194
Moderate-Low Severity +195 to +364
Moderate-High Severity +365 to +584
High Severity +585 to +1300
Results
Burn Severity Unburned Low Moderate-
Low
Moderate-
High
High User Accuracy
Unburned 24 21 7 0 0 52 46%
Low 14 35 43 1 1 94 37%
Moderate-Low 4 6 19 32 4 65 29%
Moderate-High 0 0 3 39 3 45 87%
High 0 0 1 3 67 71 94%
42 62 73 75 75 184
Overall Accuracy
Producer Accuracy 57% 56% 26% 52% 89% 56%
Burn Severity Unburned Low Moderate-
Low
Moderate-
High
High User Accuracy
Unburned 4 2 0 0 0 6 67%
Low 31 43 26 0 0 100 43%
Moderate-Low 7 17 36 10 3 73 49%
Moderate-High 0 0 10 57 4 71 80%
High 0 0 1 8 68 77 88%
42 62 73 75 75 327
Overall Accuracy
Producer Accuracy 10% 69% 49% 76% 91% 64%
Original Burn Severity Results
Modified Burn Severity Results
K-hat = 45.45% : Moderate Agreement
K-hat = 53.70% : Moderate Agreement
Accuracy Assessments
Unburned Low
Severity
Moderate-
High
Moderate-
Low
High
Severity
- Original dNBR
- Modified dNBR
- Original dNBR
- Modified dNBR
- Original dNBR
- Modified dNBR
- Original dNBR
- Modified dNBR
- Original dNBR
- Modified dNBR
57% 56%
26%
52%
89%
10%
69%
49%
76%
91%
0%
10%
20%
30%
40%
50%
60%
70%
80%
90%
100%
PRODUCER ACCURACY
46%
37%
29%
87%
94%
67%
43%
49%
80%
88%
0%
10%
20%
30%
40%
50%
60%
70%
80%
90%
100%
USER ACCURACY
Unburned Low
Severity
Moderate-
High
Moderate-
Low
High
Severity
- Original dNBR
- Modified dNBR
- Original dNBR
- Modified dNBR
- Original dNBR
- Modified dNBR
- Original dNBR
- Modified dNBR
- Original dNBR
- Modified dNBR
Discussion/Conclusion
• Assessment of the burn severity of the Bastrop County Complex Fire
(BCCF) utilizing the Normalized Burn Ratio (NBR) and Normalized
Difference Burn Ratio (dNBR) is a quick, inexpensive and accurate
alterative for estimating the burn severity of a wildfire.
• We believe our modified dNBR classes dataset to be more accurate and
useful, as it is more accurate over the entire spectrum of burn severity.
• Room For Improvement:
-possibly more accurate than statistics suggest, could modify accuracy
point placement system in the future.
Questions?

RS_Final_Project_PP

  • 1.
    Bastrop County Complex Fire ALow Cost Burn Severity Estimate Presented by: Eric R. Maurer, Eric Putman, & Nicholas Stokes ESSM 444 - 500 http://farm7.static.flickr.com/6069/6122579403_ce4e97e7a3.jpg
  • 2.
    Outline • Objectives Assess theburn severity of the Bastrop County Complex Fire (BCCF) of 2011 by utilizing the Normalized Burn Ratio (NBR) and difference Normalized Burn Ratio (dNBR) • Background/Study Area Bastrop County Complex Fire (BCCF) of 2011 Bastrop County, TX. - Lost Pines Region • Methods Data Flowchart • Results Burn severity maps Review accuracy assessment • Discussion/Conclusion
  • 3.
    • Assess theburn severity of the Bastrop County Complex Fire (BCCF) of 2011 by utilizing the Normalized Burn Ratio (NBR) and difference Normalized Burn Ratio (dNBR) • Using the resultant dNBR calculations, classify the Bastrop County Complex Fire into a range of 5 burn severity classes and delineate the boundaries of the fire. • Use the following methods learned in laboratory exercises: band math, image preprocessing/statistics extraction, image classification, and accuracy assessment. Objectives
  • 4.
    Background • A wildfirestarted on Sep. 4, 2011 in Bastrop County, TX. (East of Austin) in the Lost Pines area of the county, approximately 34,000 acres burned and around 1,500 homes/buildings destroyed. (Pines Recovery Team, 2011) • This wildfire was the most destructive wildland-urban interface fire in Texas history. (Bastrop Complex Wildfire Case Study) http://cravedfw.files.wordpress.com/2011/09/texas-fires.jpg?w=500
  • 5.
    Study Area • BastropCounty, TX. (30̊ 6’0”N, 97˚18’36” W) • Population: 74,763 (2012) • Lost Pines Area A population disjunction of loblolly pines
  • 6.
    Methods Burn severity isdefined as the measurement of organic matter loss in or on the soil surface, and in remote sensing operations the preferred index used to identify the changes in the vegetation and soil exposure is known as the Normalized Burn Ratio (NBR) (Keeley, 2009; Key & Benson, 2006). NBR= (Band 4 - Band 7) / (Band 4 + Band 7). dNBR=NBRprefire - NBRpostfire
  • 7.
    Data Post-Fire 10/13/2011 Pre-Fire 8/27/2011 • Using earthexplorer.usgs.orgwe attained pre & post fire LANDSAT 5 imagery. • The LANDSAT 5 imagery consists of 7 spectral bands. • Bands 1 to 5 along with 7 have a spatial resolution of 30 meters, while Band 6 (thermal infrared) is 120 meters, but has been resampled to 30-meter pixels. (http://landsat.usgs.gov/band_designations_landsat_satellites.php) • Utilized band 4 (0.76-0.90µm) and band 7 (2.08-2.35µm)
  • 8.
    Flowchart Image Acquisition (LANDSAT 5) Pre-Fire(26 AUG 2011) Post-Fire (13 OCT 2011) Clipped Image in ENVI using Spatial Subset for smaller study area Calculated Normalized Burn Ratio (NBR) for Pre/Post Fire Images: NBR = (Band 4 − Band7) (Band 4 + Band 7) Calculated Difference Normalized Burn Ratio dNBR = (NBRprefire – NBRpostfire) Manually digitized fire perimeter using dNBR image to create shapefile Reclassified dNBR values to 5 levels of Burn Severity Performed Accuracy Assessment Analyze Accuracy Assessment
  • 10.
    Severity Level dNBRRange Unburned -500 to +99 Low Severity +100 to +269 Moderate-Low Severity +270 to +439 Moderate-High Severity +440 to +659 High Severity +660 to +1300 Severity Level dNBR Range Unburned -500 to +24 Low Severity +25 to +194 Moderate-Low Severity +195 to +364 Moderate-High Severity +365 to +584 High Severity +585 to +1300 Results
  • 12.
    Burn Severity UnburnedLow Moderate- Low Moderate- High High User Accuracy Unburned 24 21 7 0 0 52 46% Low 14 35 43 1 1 94 37% Moderate-Low 4 6 19 32 4 65 29% Moderate-High 0 0 3 39 3 45 87% High 0 0 1 3 67 71 94% 42 62 73 75 75 184 Overall Accuracy Producer Accuracy 57% 56% 26% 52% 89% 56% Burn Severity Unburned Low Moderate- Low Moderate- High High User Accuracy Unburned 4 2 0 0 0 6 67% Low 31 43 26 0 0 100 43% Moderate-Low 7 17 36 10 3 73 49% Moderate-High 0 0 10 57 4 71 80% High 0 0 1 8 68 77 88% 42 62 73 75 75 327 Overall Accuracy Producer Accuracy 10% 69% 49% 76% 91% 64% Original Burn Severity Results Modified Burn Severity Results K-hat = 45.45% : Moderate Agreement K-hat = 53.70% : Moderate Agreement Accuracy Assessments
  • 13.
    Unburned Low Severity Moderate- High Moderate- Low High Severity - OriginaldNBR - Modified dNBR - Original dNBR - Modified dNBR - Original dNBR - Modified dNBR - Original dNBR - Modified dNBR - Original dNBR - Modified dNBR 57% 56% 26% 52% 89% 10% 69% 49% 76% 91% 0% 10% 20% 30% 40% 50% 60% 70% 80% 90% 100% PRODUCER ACCURACY
  • 14.
    46% 37% 29% 87% 94% 67% 43% 49% 80% 88% 0% 10% 20% 30% 40% 50% 60% 70% 80% 90% 100% USER ACCURACY Unburned Low Severity Moderate- High Moderate- Low High Severity -Original dNBR - Modified dNBR - Original dNBR - Modified dNBR - Original dNBR - Modified dNBR - Original dNBR - Modified dNBR - Original dNBR - Modified dNBR
  • 16.
    Discussion/Conclusion • Assessment ofthe burn severity of the Bastrop County Complex Fire (BCCF) utilizing the Normalized Burn Ratio (NBR) and Normalized Difference Burn Ratio (dNBR) is a quick, inexpensive and accurate alterative for estimating the burn severity of a wildfire. • We believe our modified dNBR classes dataset to be more accurate and useful, as it is more accurate over the entire spectrum of burn severity. • Room For Improvement: -possibly more accurate than statistics suggest, could modify accuracy point placement system in the future. Questions?