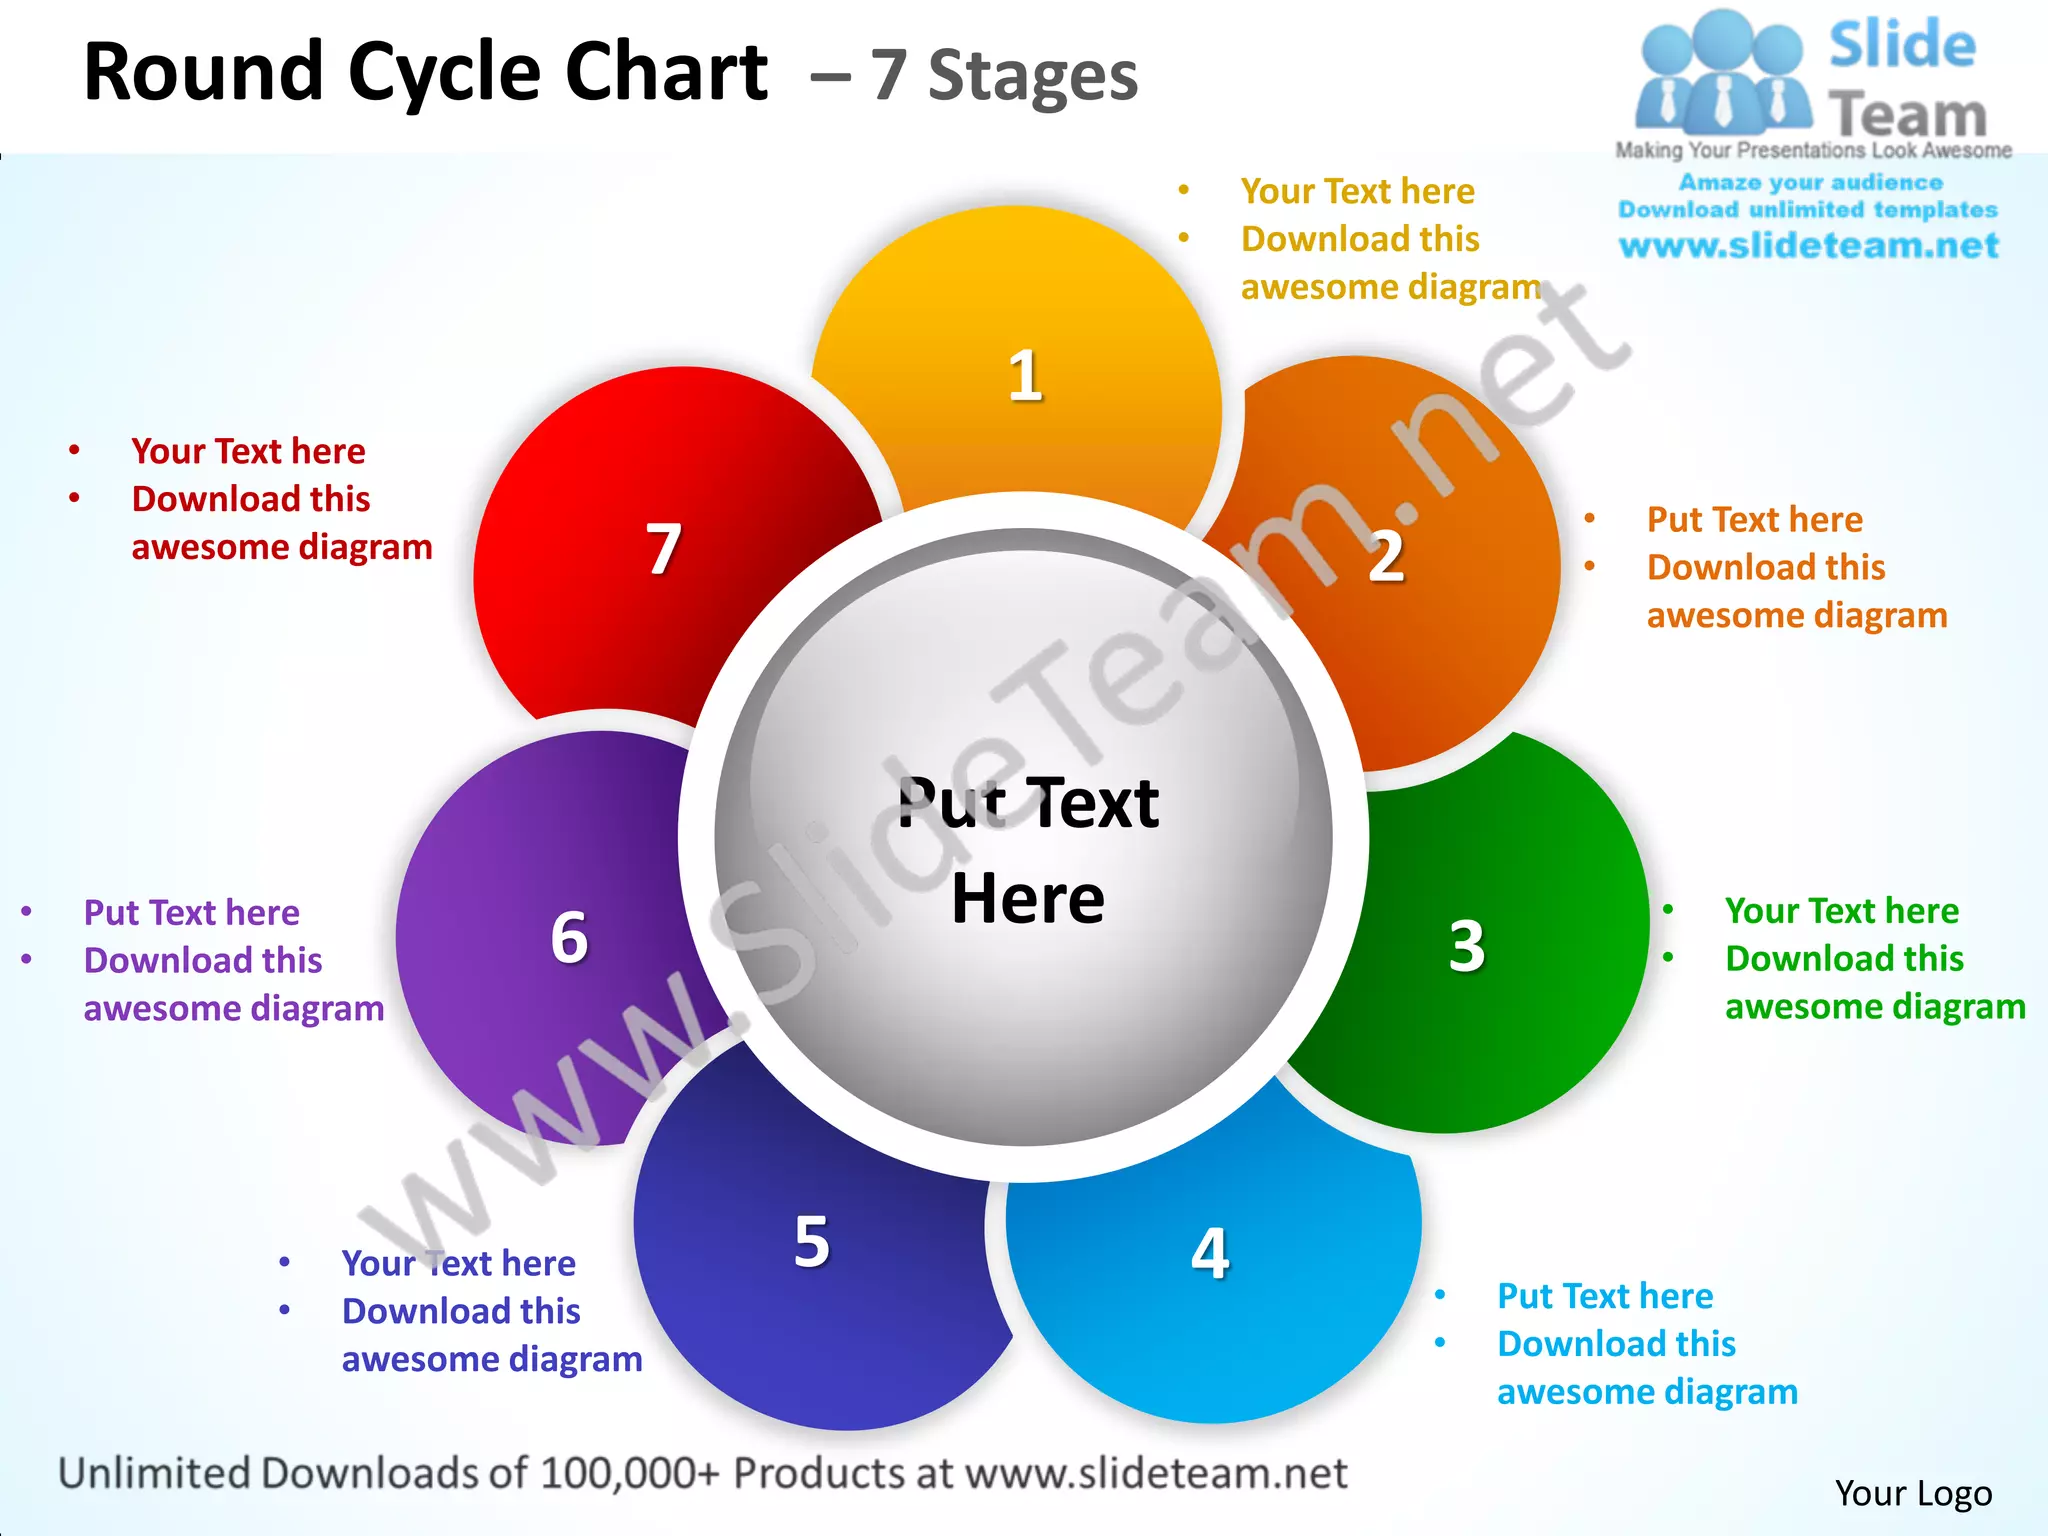
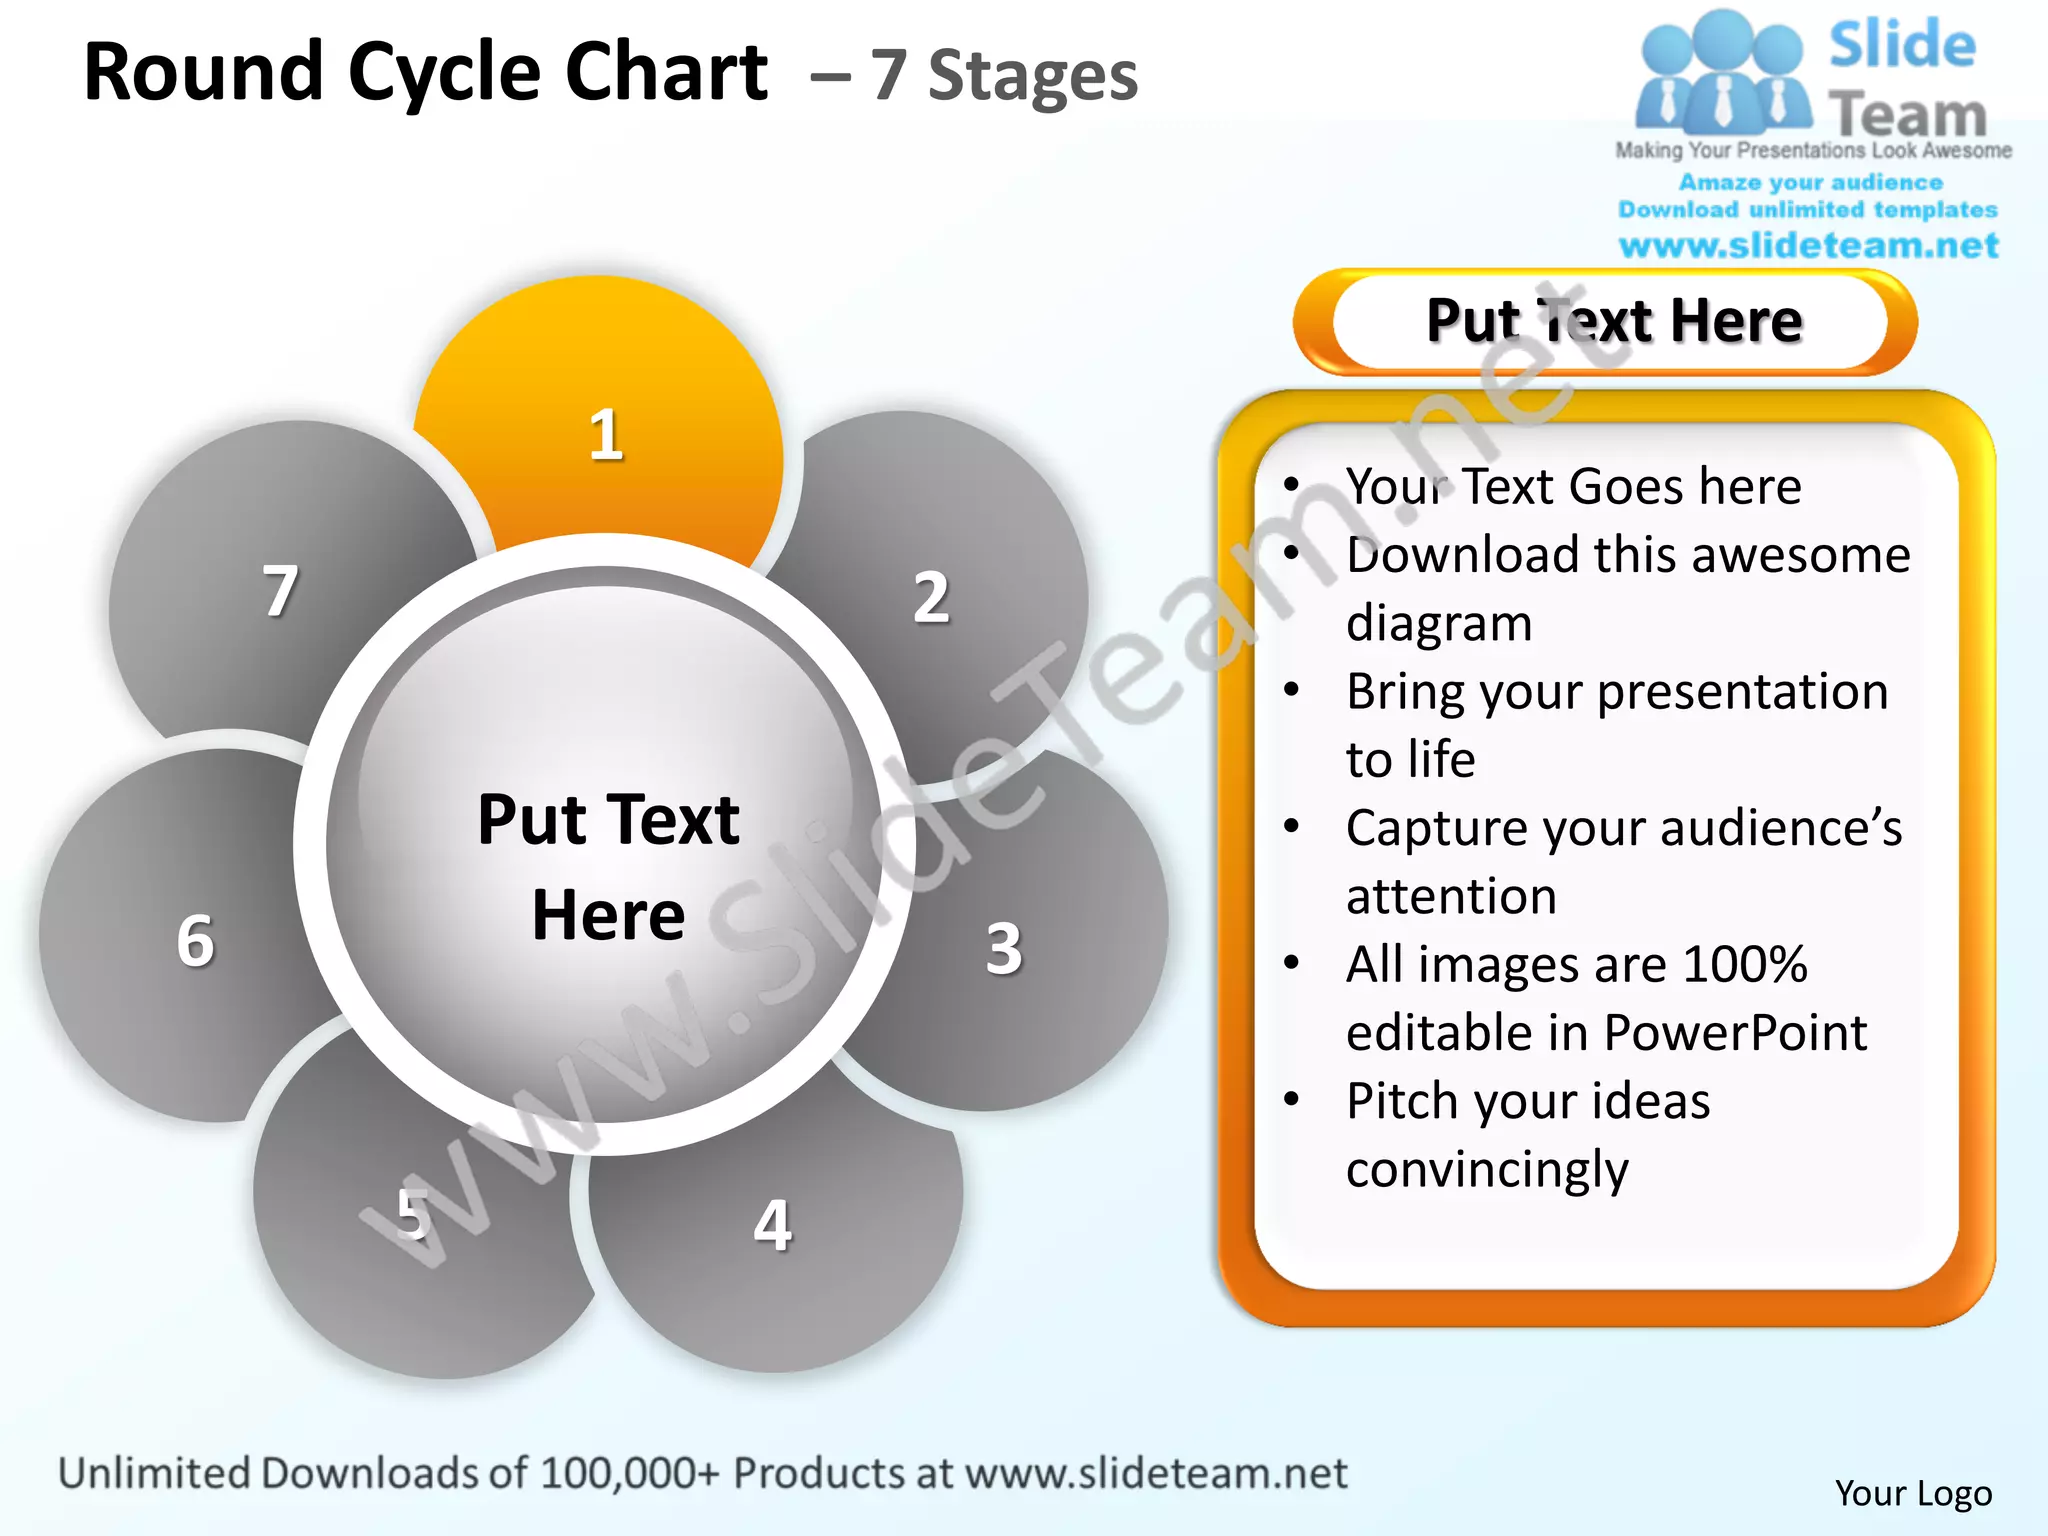
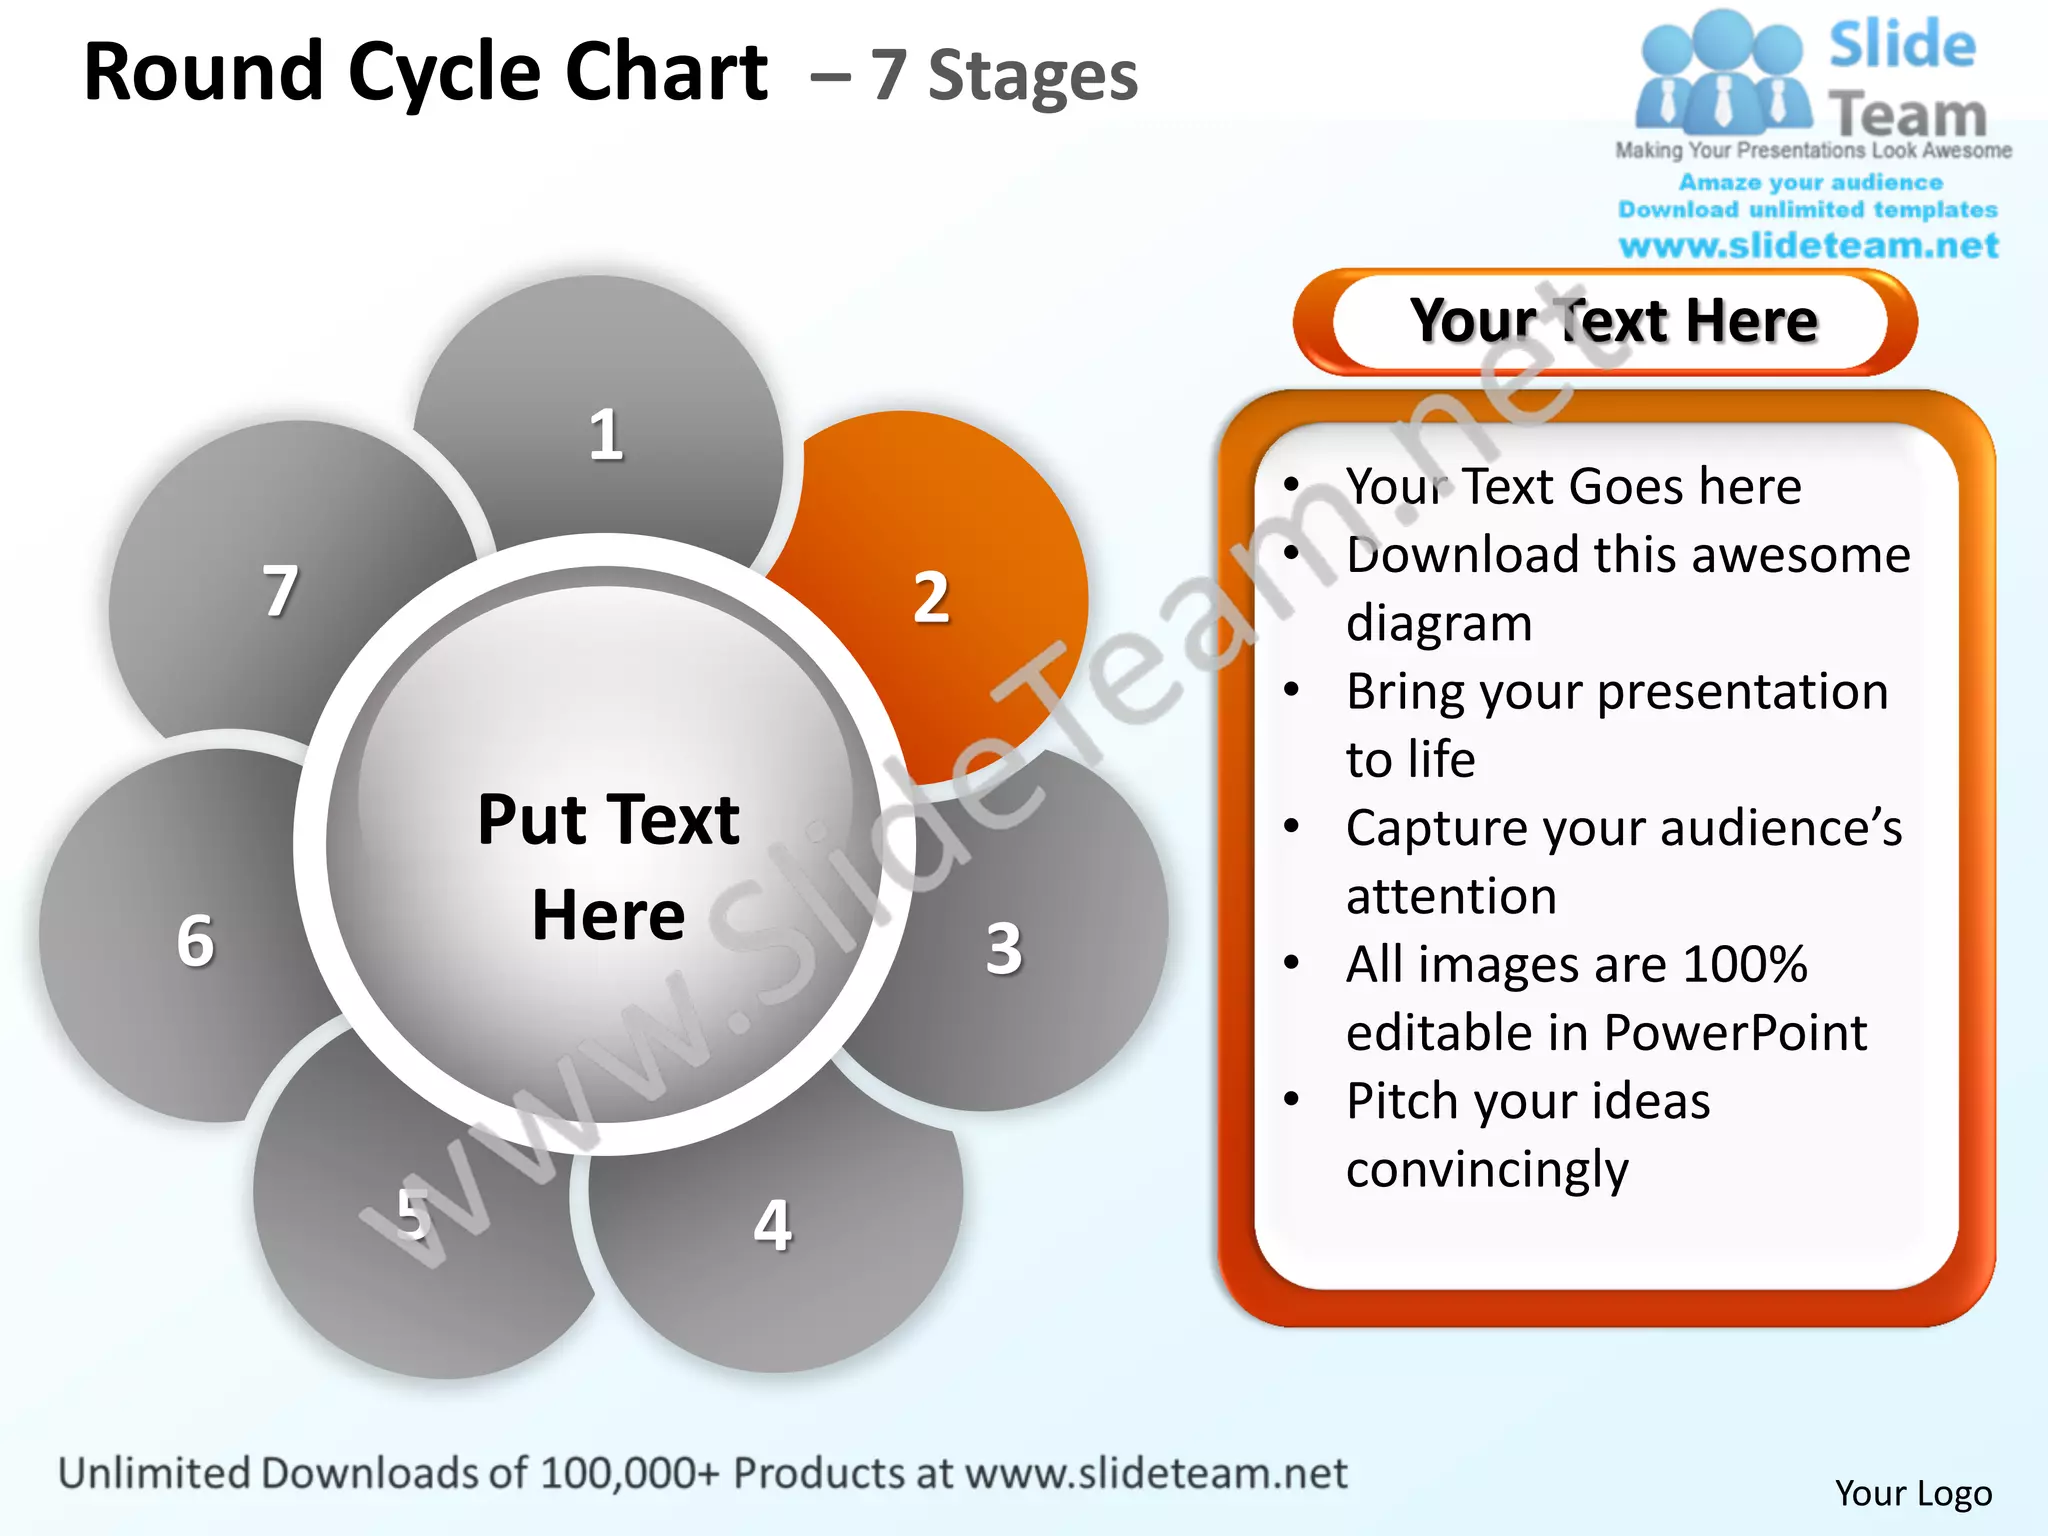
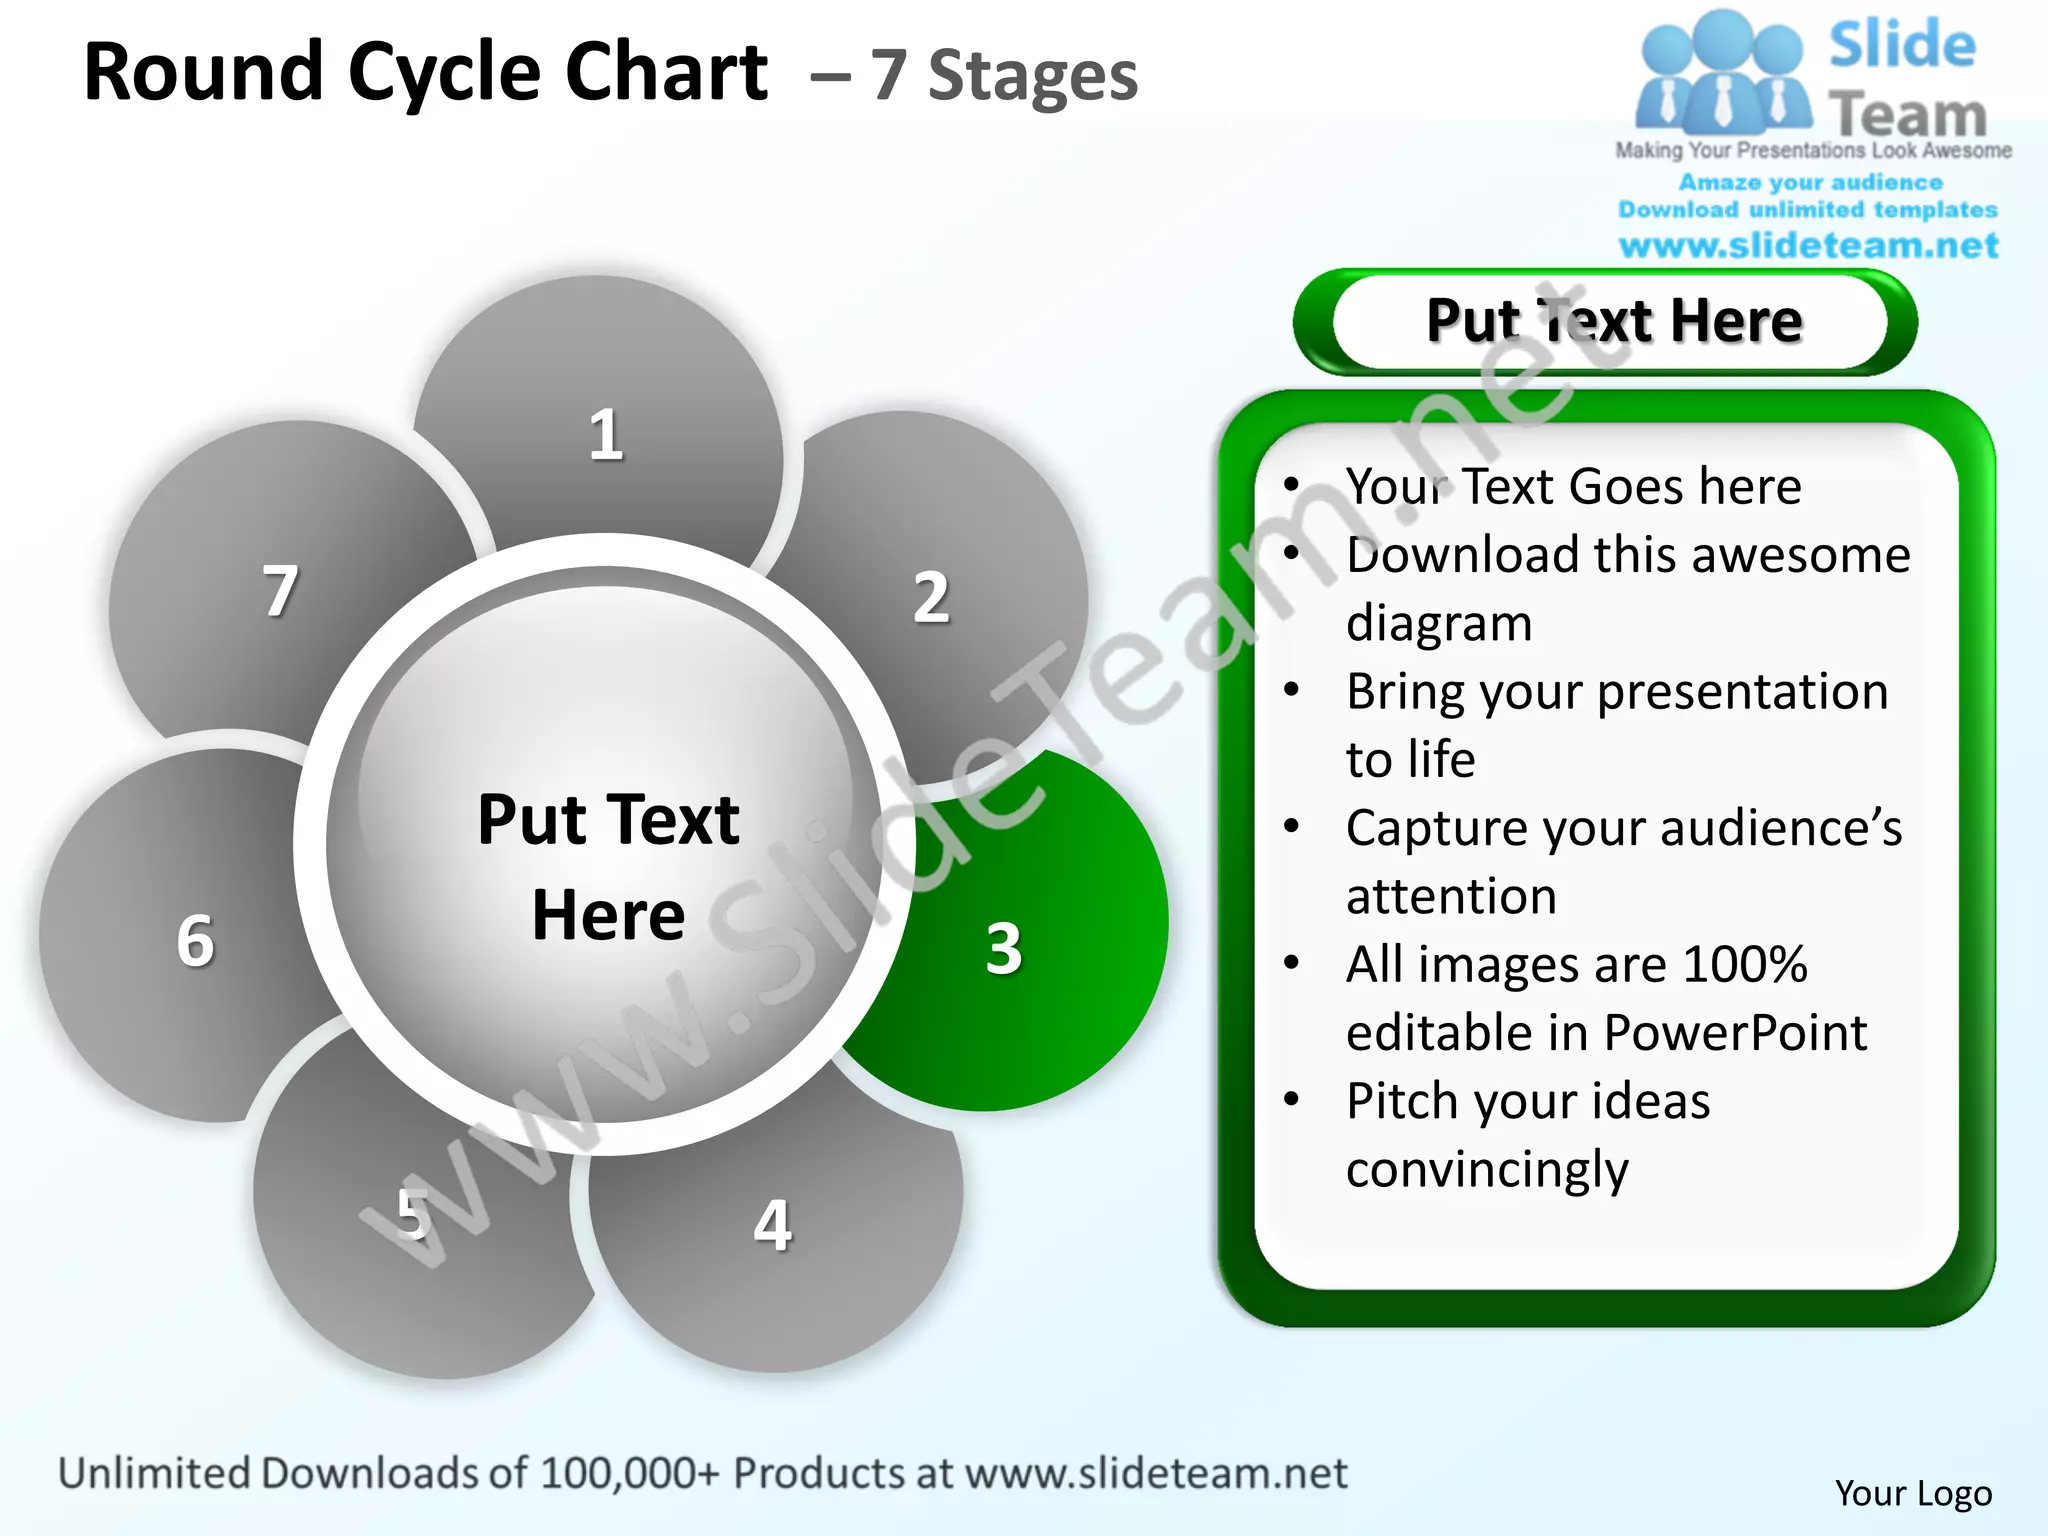
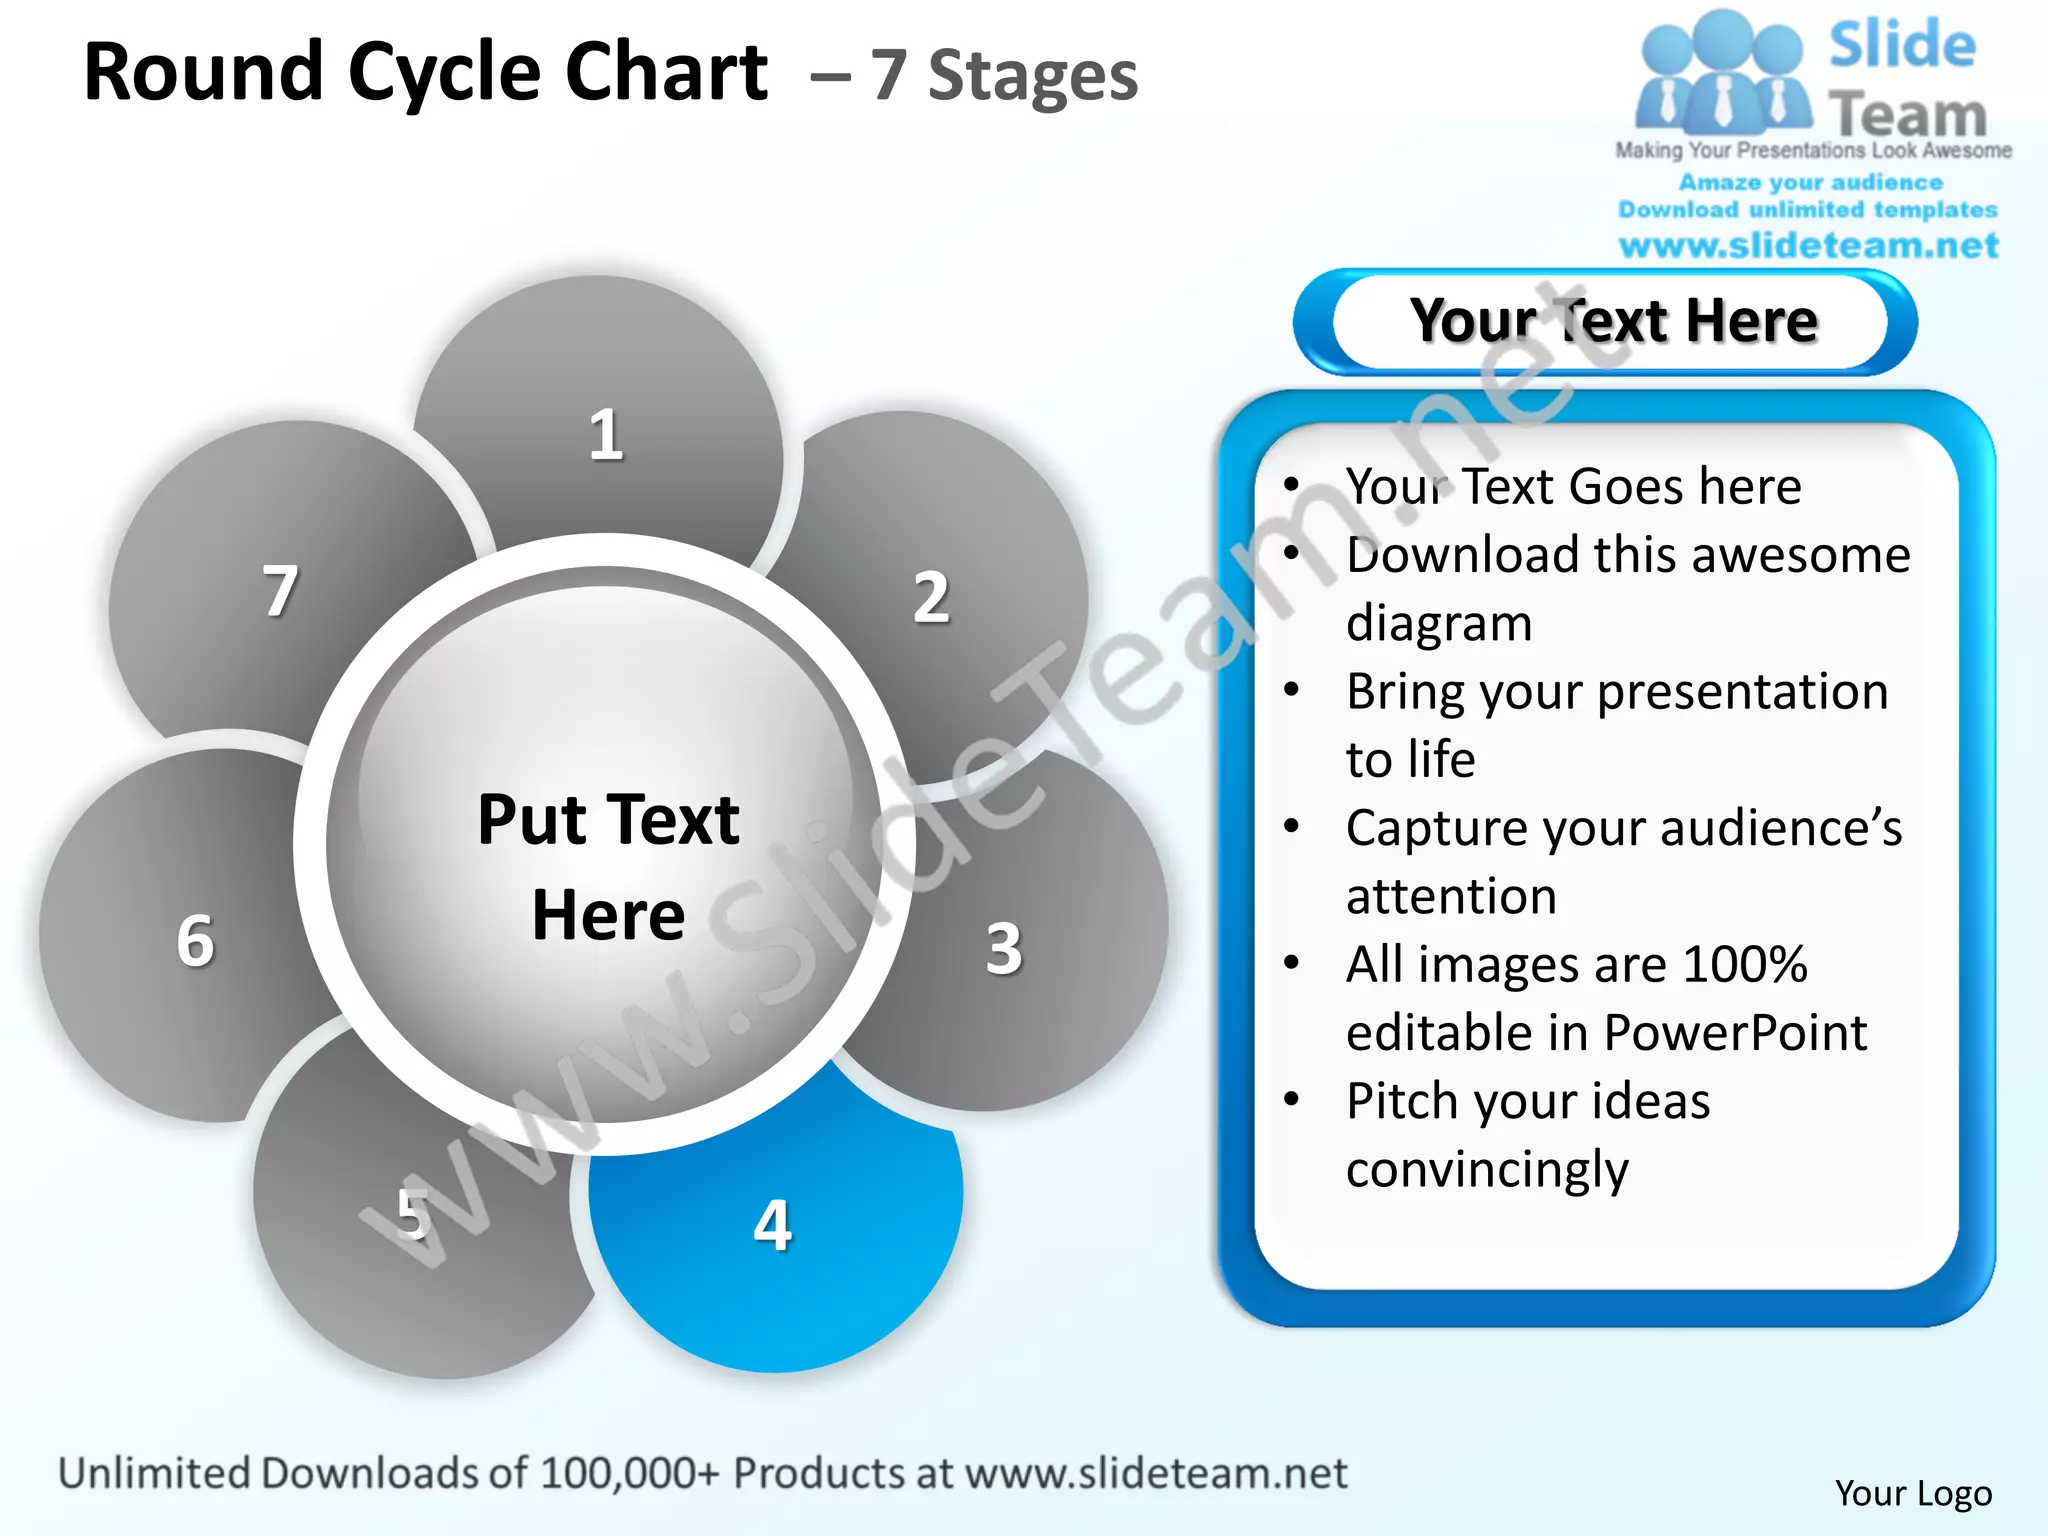
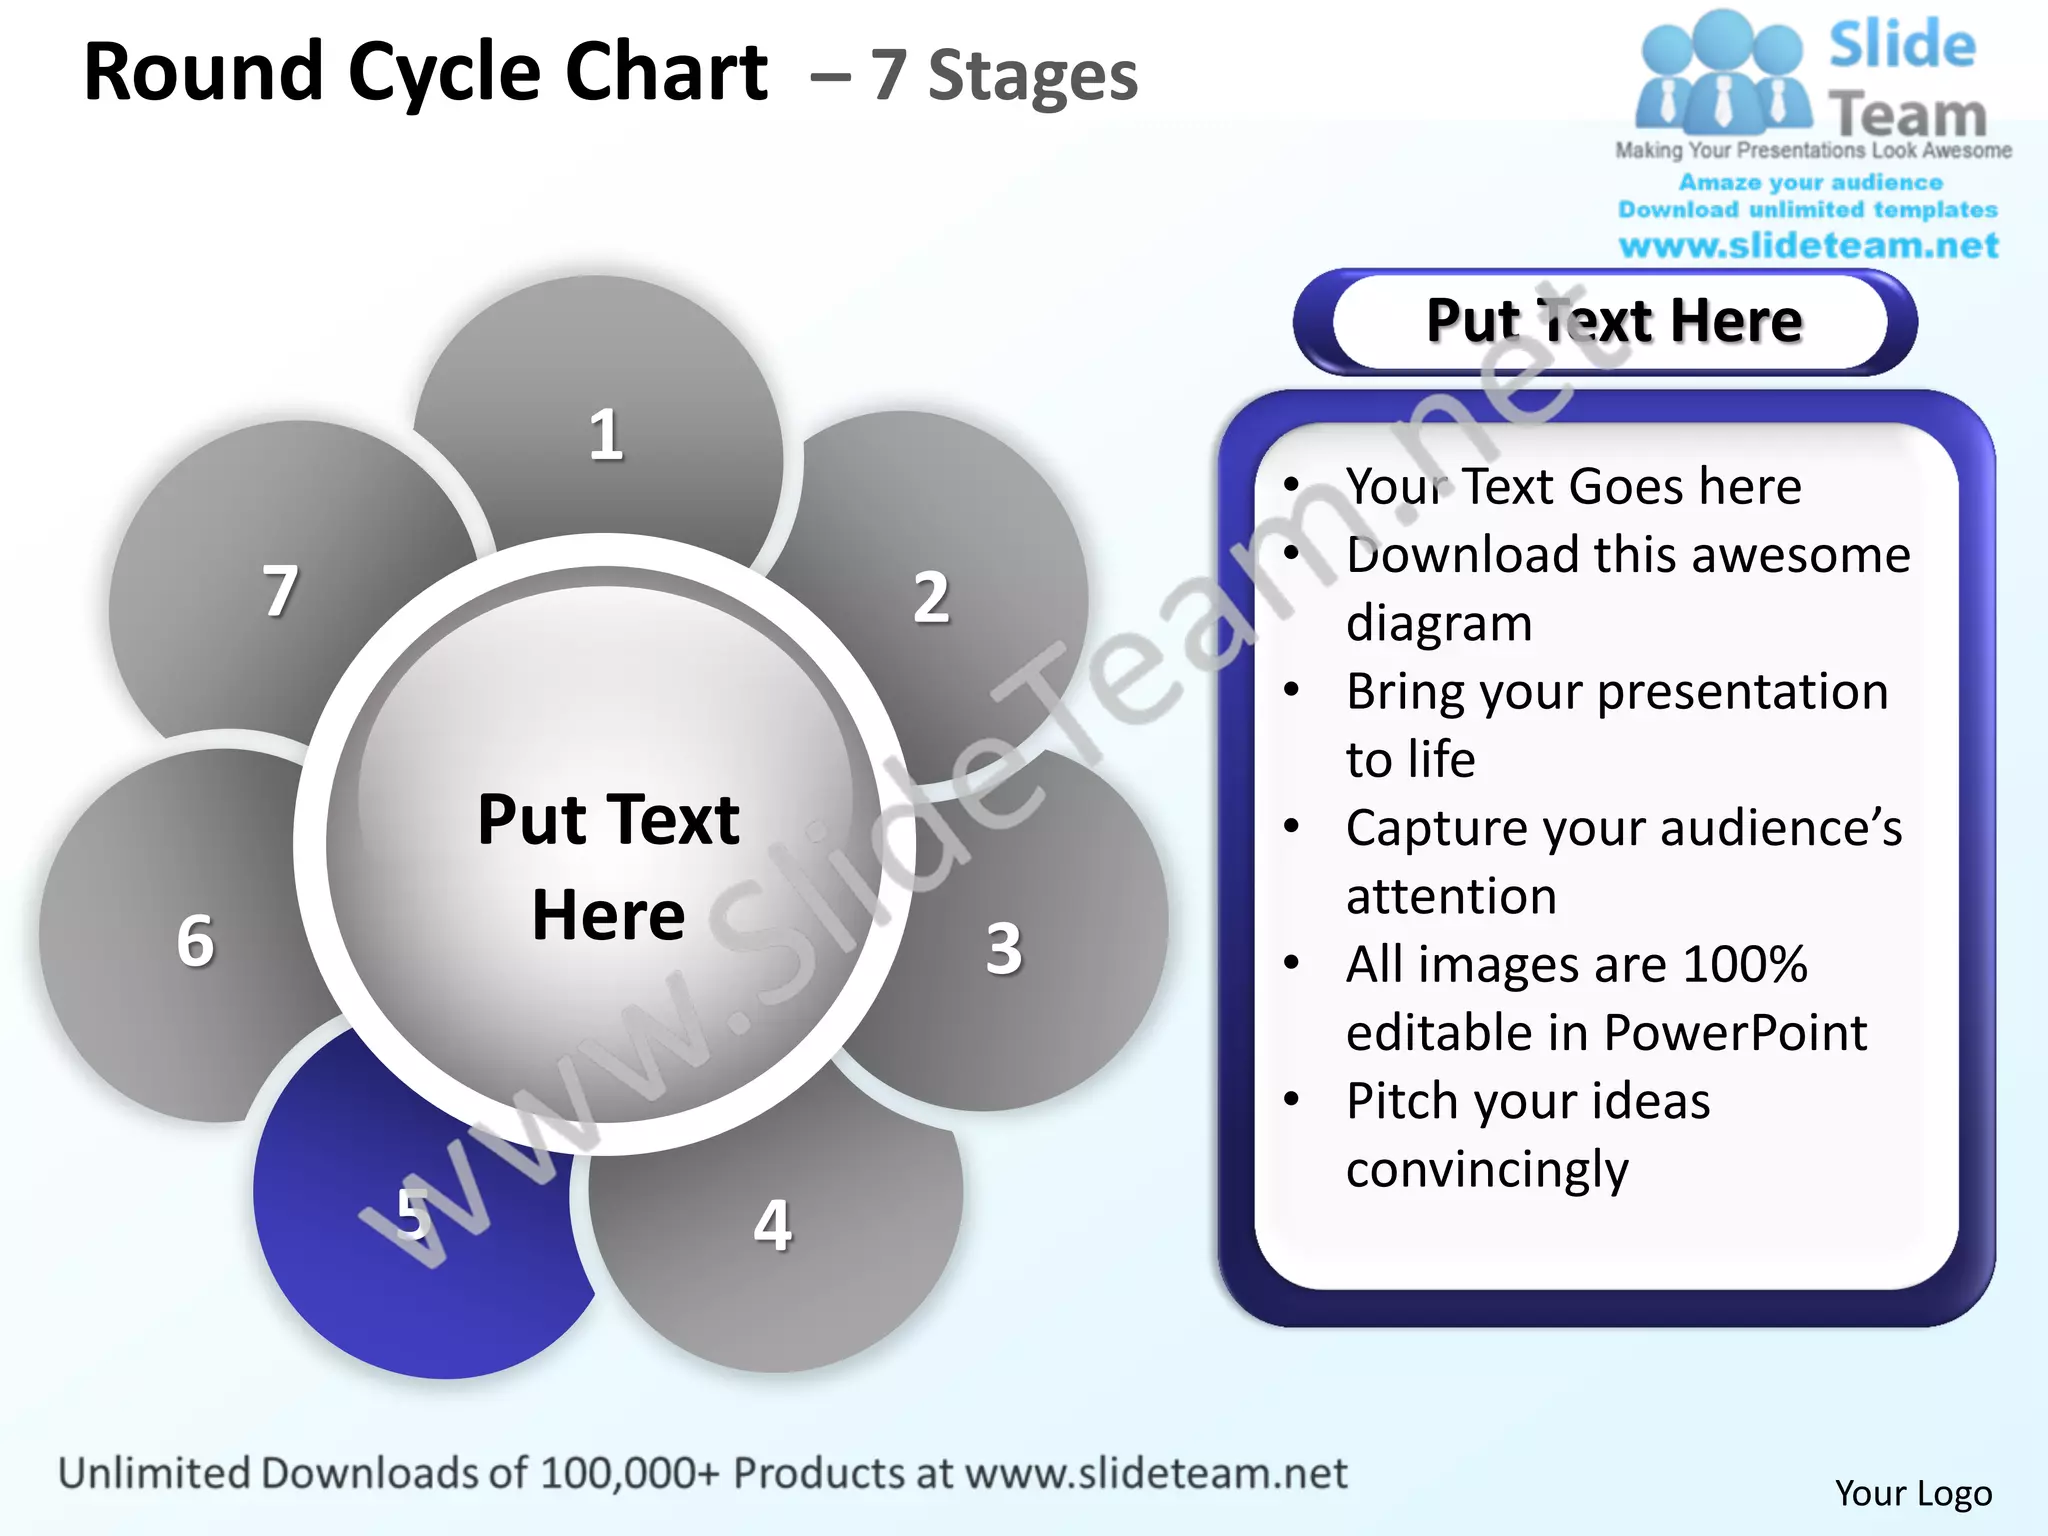
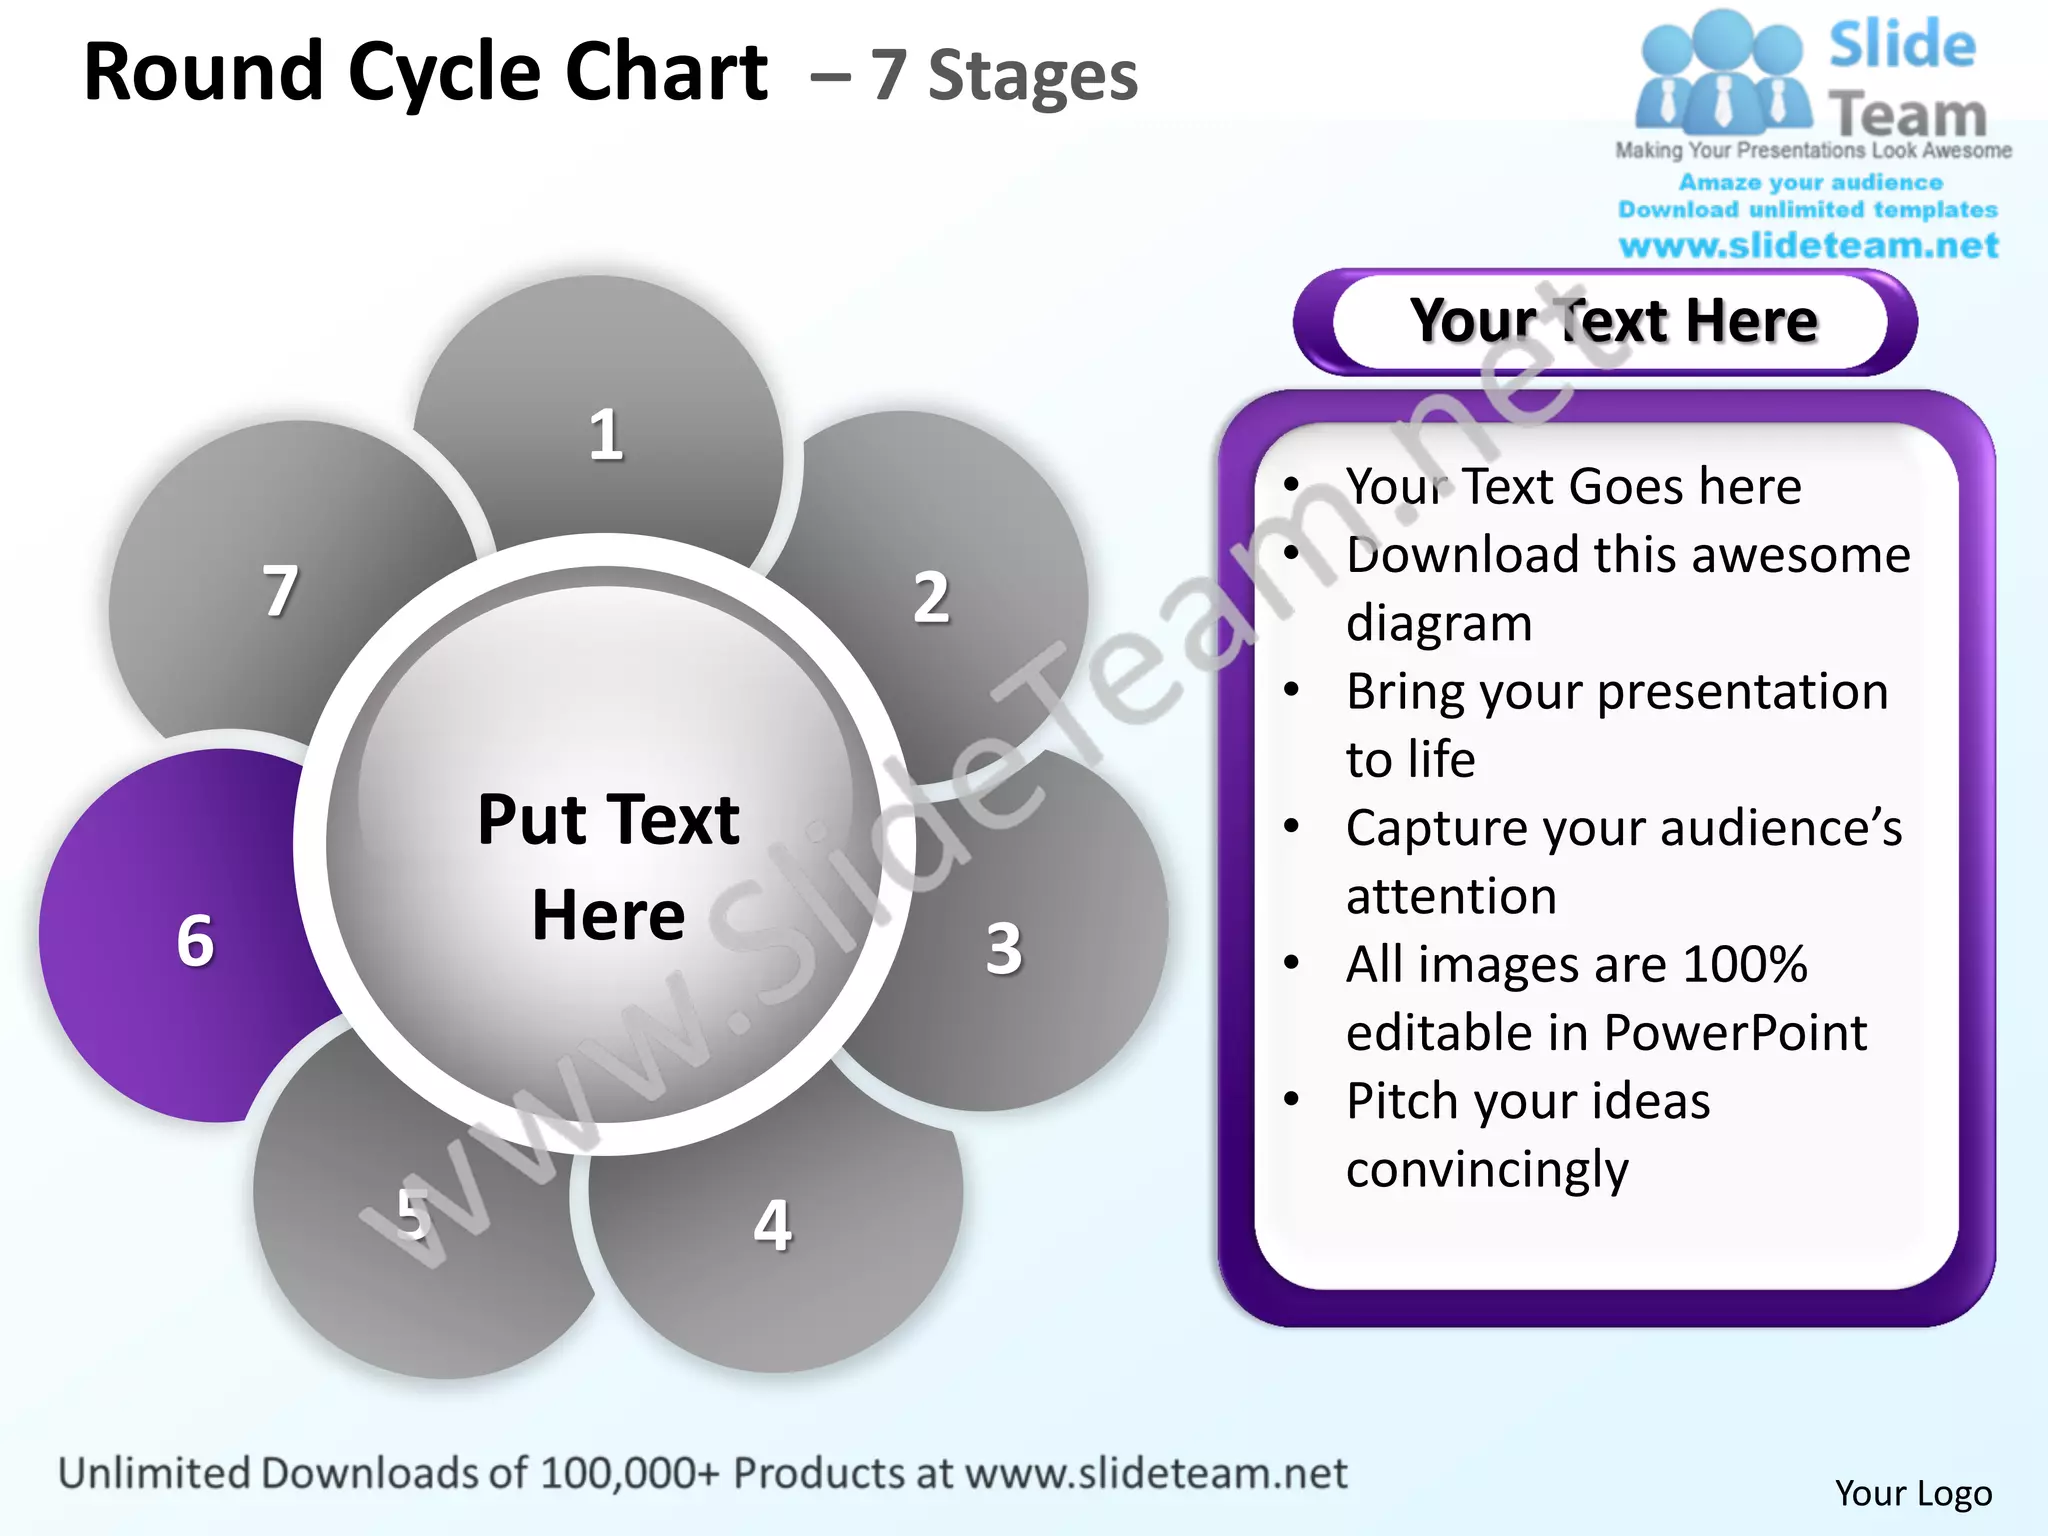
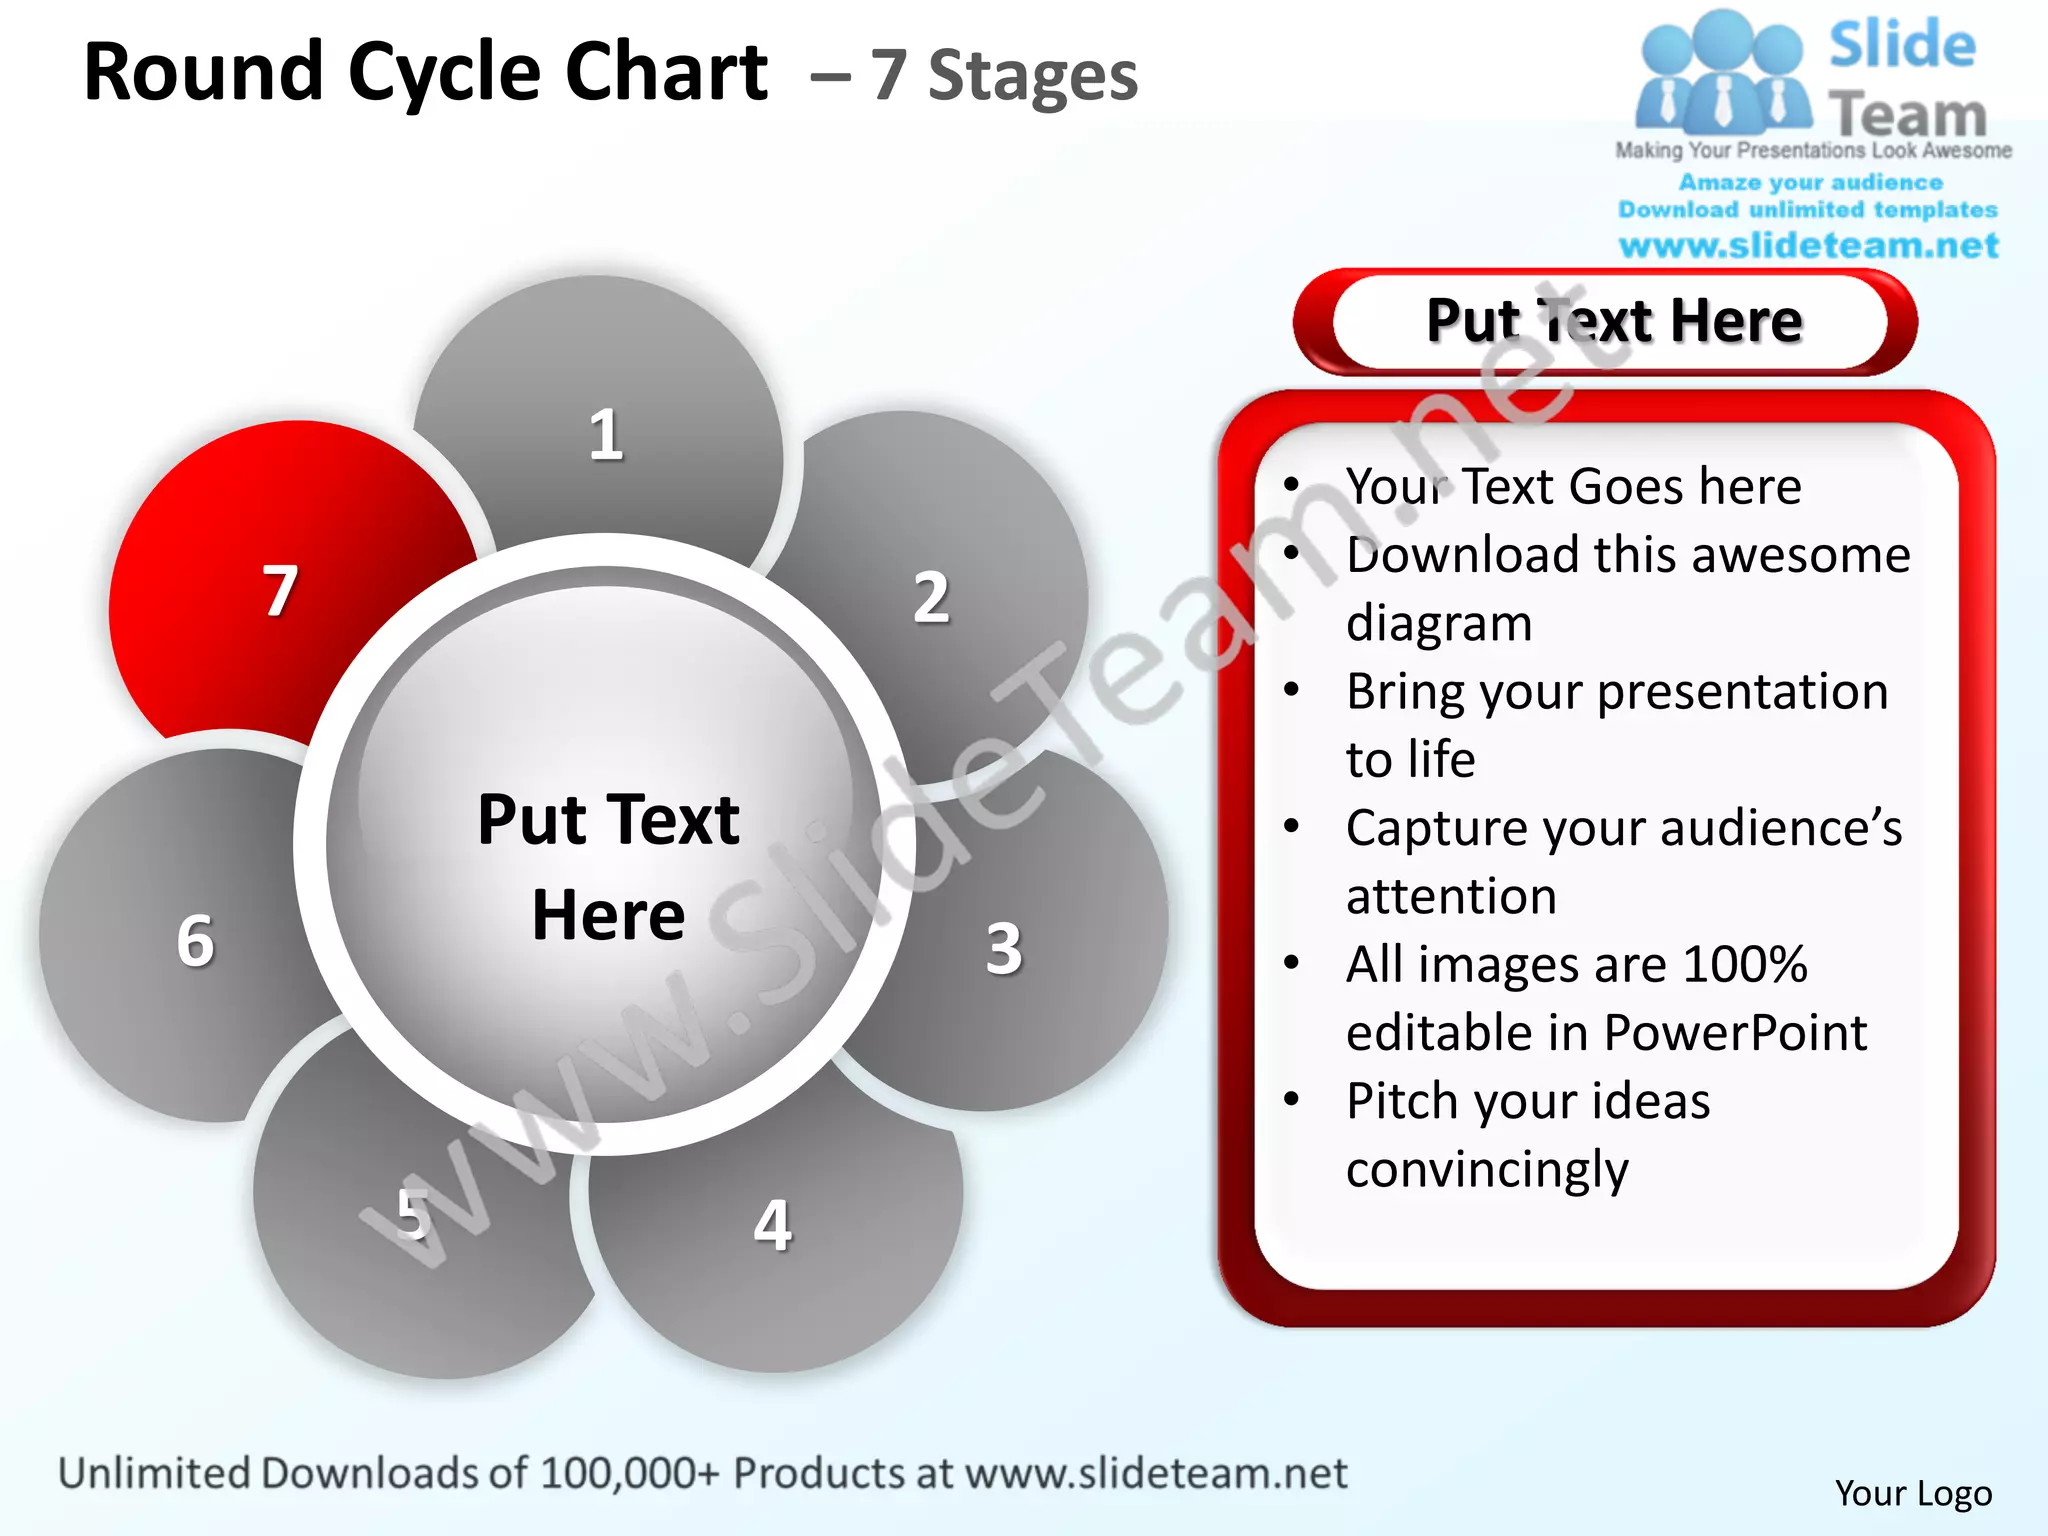
The document describes a round cycle chart with 7 stages. It encourages adding text to each stage and downloading the diagram. The diagram consists of a circle divided into 7 sections, with instructions to customize the text and images in each section. The purpose is to bring presentations to life, capture audiences' attention, and pitch ideas convincingly. All images in the chart can be edited in PowerPoint by changing properties like color, size, and orientation.
Rethinking Lessons Learned in the PMBoK Process Groups: A Model based on Peop...Marcirio Chaves
The Ballistic 2.0 model
Intends to fill a gap in literature regarding LL
Based on consolidated literature
Expands the use of the knowledge creation model
Is in tune with PM 2.0 (agile, flexible, dynamic)
Provides theoretical foundation for future researches.
The Italian Budget Cycle and the European Semester: how the European Semester works; economic planning in Italy; Public Finance Manoeuvre; the Stability Bill; Excessive Deficit Procedure. telosaes.it
Aligning the centre and line ministries - Roland Schneider, AustriaOECD Governance
This presentation was made by Roland Schneider, Austria,, at the 12th Annual Meeting on Performance and Results held at the OECD, Paris, on 24-25 November 2016
1. Round Cycle Chart – 7 Stages
• Your Text here
• Download this
awesome diagram
1
• Your Text here
• Download this
• Put Text here
awesome diagram 7 2 • Download this
awesome diagram
Put Text
• Put Text here
6 Here • Your Text here
• Download this 3 • Download this
awesome diagram awesome diagram
• Your Text here 5 4
• Download this • Put Text here
awesome diagram • Download this
awesome diagram
Your Logo
2. Round Cycle Chart – 7 Stages
Put Text Here
1
• Your Text Goes here
• Download this awesome
7 2 diagram
• Bring your presentation
to life
Put Text • Capture your audience’s
Here attention
6 3 • All images are 100%
editable in PowerPoint
• Pitch your ideas
convincingly
5 4
Your Logo
3. Round Cycle Chart – 7 Stages
Your Text Here
1
• Your Text Goes here
• Download this awesome
7 2 diagram
• Bring your presentation
to life
Put Text • Capture your audience’s
Here attention
6 3 • All images are 100%
editable in PowerPoint
• Pitch your ideas
convincingly
5 4
Your Logo
4. Round Cycle Chart – 7 Stages
Put Text Here
1
• Your Text Goes here
• Download this awesome
7 2 diagram
• Bring your presentation
to life
Put Text • Capture your audience’s
Here attention
6 3 • All images are 100%
editable in PowerPoint
• Pitch your ideas
convincingly
5 4
Your Logo
5. Round Cycle Chart – 7 Stages
Your Text Here
1
• Your Text Goes here
• Download this awesome
7 2 diagram
• Bring your presentation
to life
Put Text • Capture your audience’s
Here attention
6 3 • All images are 100%
editable in PowerPoint
• Pitch your ideas
convincingly
5 4
Your Logo
6. Round Cycle Chart – 7 Stages
Put Text Here
1
• Your Text Goes here
• Download this awesome
7 2 diagram
• Bring your presentation
to life
Put Text • Capture your audience’s
Here attention
6 3 • All images are 100%
editable in PowerPoint
• Pitch your ideas
convincingly
5 4
Your Logo
7. Round Cycle Chart – 7 Stages
Your Text Here
1
• Your Text Goes here
• Download this awesome
7 2 diagram
• Bring your presentation
to life
Put Text • Capture your audience’s
Here attention
6 3 • All images are 100%
editable in PowerPoint
• Pitch your ideas
convincingly
5 4
Your Logo
8. Round Cycle Chart – 7 Stages
Put Text Here
1
• Your Text Goes here
• Download this awesome
7 2 diagram
• Bring your presentation
to life
Put Text • Capture your audience’s
Here attention
6 3 • All images are 100%
editable in PowerPoint
• Pitch your ideas
convincingly
5 4
Your Logo
9. All images are 100% editable in PowerPoint
“Change color, size and orientation of any icon to your liking”
10. Ungrouping the object
2
1
3
1. Right click the object.
2. Choose Group and then Ungroup.
3. Click beside the object and drag the arrow over it.
11. Edit Color
2 3
1
1. Select the shape to change the color and Right click the object( click any object which you
want to change color)
2. Choose Format Shape in the dialog box.
3. Choose “Fill” in the Format Shape box then “Solid” or “Gradient” depending on the
appearance of the object. Change colour as shown in the picture.