Download to read offline
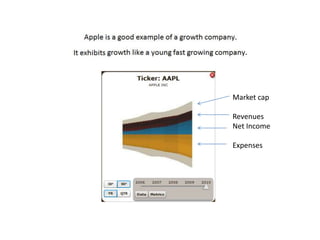
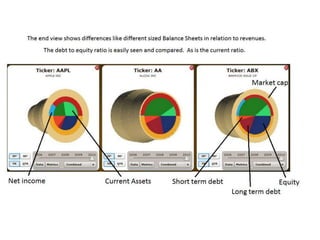
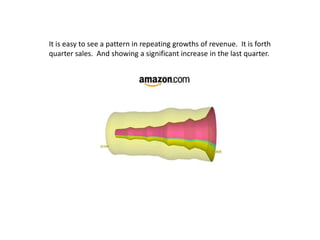
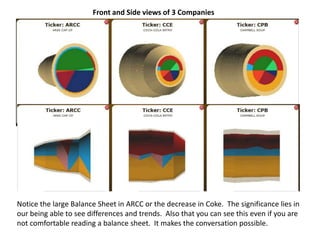

This document discusses financial metrics like revenue, net income, and expenses for companies and compares their balance sheets and trends over quarters. It shows front and side views of 3 companies' financial data to highlight differences and trends between them that allow people to discuss the companies' financial situations even without reading balance sheets in depth.


