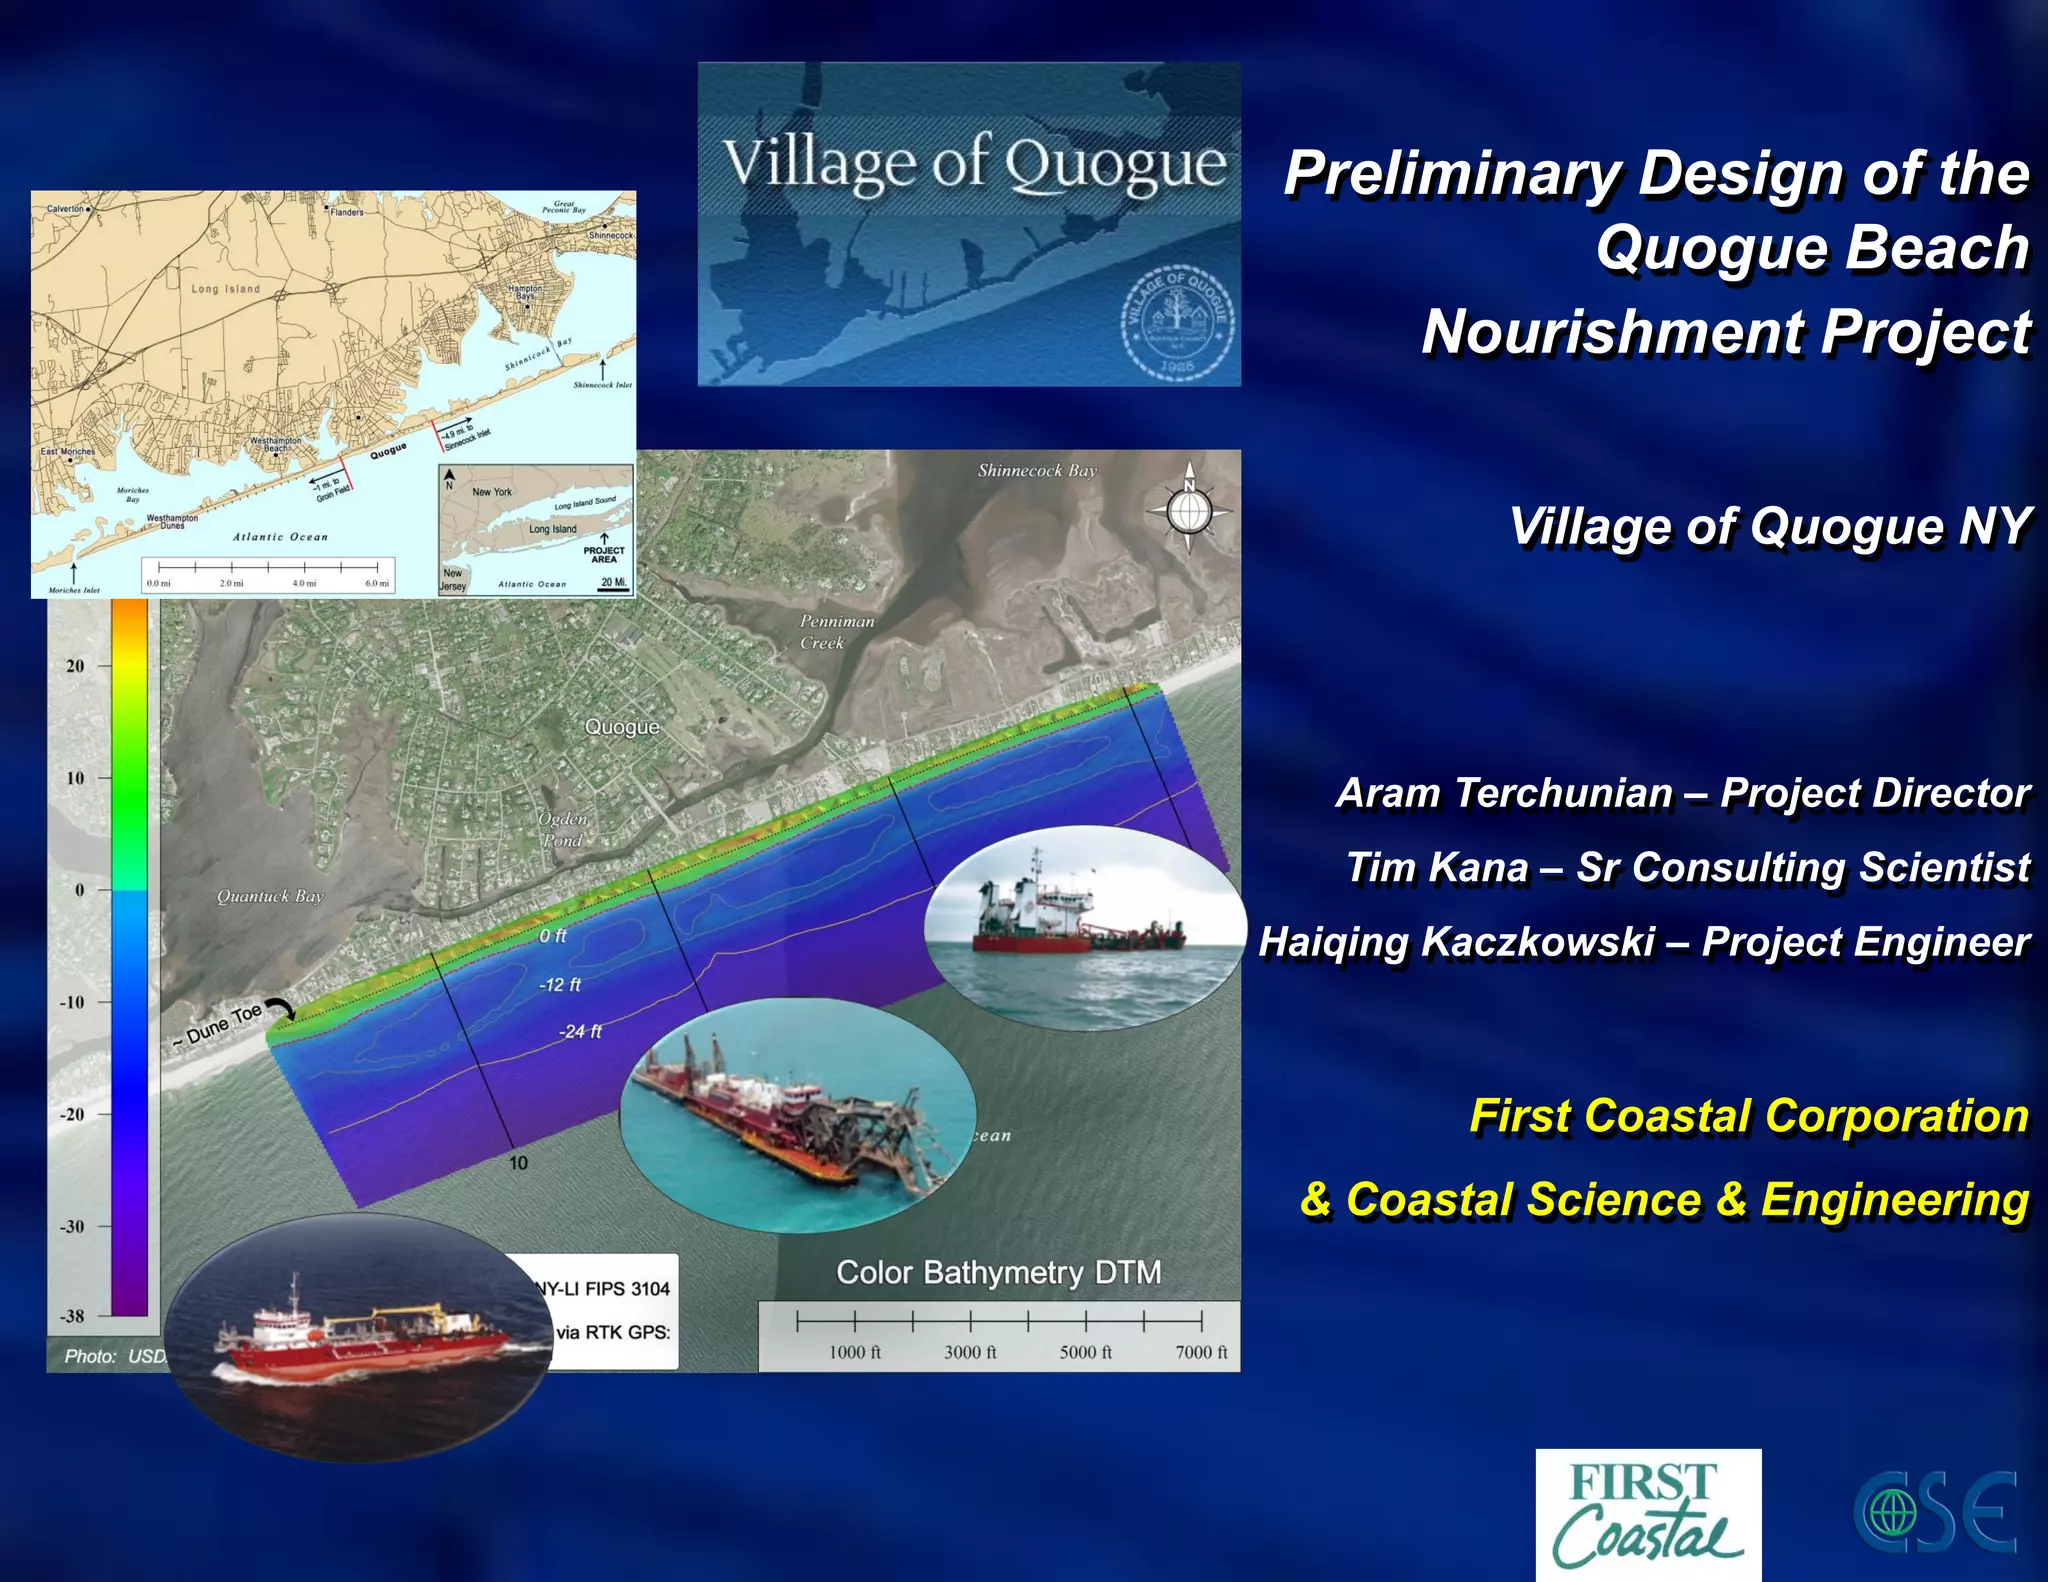
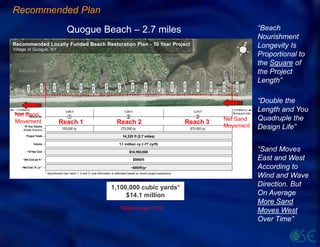
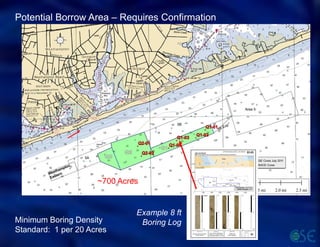
Preliminary Design of the
Quogue Beach
Nourishment Project
Village of Quogue NY
Aram Terchunian – Project Director
Tim Kana – Sr Consulting Scientist
Haiqing Kaczkowski – Project Engineer
First Coastal Corporation
& Coastal Science & Engineering
Beach Profile – The Shore Zone That Absorbs Breaking Waves
Average Waves
Storm Waves
After Komar 1998
“Profile Volume”
Equilibrium Profiles
Profile Shape Will Change Frequently.
But If the Profile Volume Remains
Constant, The Beach Is In Equilibrium
After Kana 1990
Offshore
Bar
Application To Quogue Beach
“Profile Volume”
The First Coastal – CSE Team Determined:
- Quogue Beach (~2.7 miles) has lost ~60,000 cy/yr since the 1950s.
This is equivalent to ~5 ft/yr shoreline recession.
- There is a sand deficit (~495,000 cy) in the profile compared with a
normal healthy beach which is why the dry beach is narrow in summer
and some dune sections erode each year
- Quality Borrow Sand is Located ~1 mile offshore in ~50 ft depths
- Approx 1.1 million cubic yards (+/- 15%) are required to restore the
2.7 mile beach and maintain a healthy beach for over 10 years
- It is feasible to complete projects of this type in ~2 months using
ocean-going hopper dredges or (possibly) traditional pipeline dredges
- Upon completion of the project, the beach is expected to be
indistinguishable from a natural beach, but average about 75 ft wider
and offer more protection to property.
Recommended Plan
Bridgehampton-Water Mill Beach – 3.0 miles
“Beach
Nourishment
Longevity Is
Proportional to
the Square of
the Project
Length”
“Double the
Length and You
Quadruple the
Design Life”
“Sand Moves
East and West
According to
Wind and Wave
Direction. But
On Average
More Sand
Moves West
Over Time”
7,875 ft7,751 ft
Quogue Beach – 2.7 miles
Reach 1 Reach 2 Reach 3
Net Sand
Movement
Net Sand
Movement
1,100,000 cubic yards*
$14.1 million
*Middle range +15%
Potential Borrow Area – Requires Confirmation
Example 8 ft
Boring Log
~700 Acres
Minimum Boring Density
Standard: 1 per 20 Acres
Liberty Island
First Load – 8:20 pm, 24 May 2011
Other Projects: Nags Head NC
Nags Head Pier ‒ Reach 1
23 Feb 2011
2 Sept 2011
21 Nov 201112 Jun 2012
STA525
Nags Head NC – Accounting of Nourishment Volumes
Unit Volume Changes (CY/FT) Relative To Nov-2010
Date of
Survey
Toe of Dune
To +6 FT
+6 FT To
0 FT
0 FT To
-2 FT
-2 FT To
-6 FT
-6 FT To
-12 FT
Nov-11 6 23 8 16 31
Jun-12 7 16 6 14 29
Outer Bar
Movement
Before Nourishment (Nov 2010 )
~10 Months After Nourishment (Jun 2012)
170 ft
Toe of Dune to MLW = 315 ft
Station 785+00
Jennett’s Pier ‒ Reach 1
Unit Volume Changes (CY/FT) Relative To Nov-2010
Date of
Survey
Toe of
Dune to
+6 FT
+6 FT To
0 FT
0 FT To
-2 FT
-2 FT To
-6 FT
-6 FT To
-12 FT
-12 FT To
-19 FT
-19 FT To
-24 FT
Nov-11 11 47 14 4 30 -2 2
Jun-12 17 42 13 0 53 7 1
 Phase 1 - 6.8 miles - 1,735,000 cubic yards - Nov 2002 thru April 2003
 Phase 2 - 5.8 miles - 1,850,000 cubic yards - January thru March 2003
Sponsors: Town of Pine Knoll Shores & Town of Indian Beach - Phase 1
Town of Emerald Isle - Phases 2 & 3
Bogue Banks Nourishment Project
Pine Knoll Shores North Carolina
Photos by PA McKee & TW Kana
September 1999
June 2004 July 2012
Post-FLOYD
2 yrs Post-Nourishment
Present
July 2012
Sept 2005
Post-OPHELIA
5-yrs Post-OPHELIA Renourishment
Initial Locally Funded Project
FEMA Funded
Renourishment
Myrtle Beach
South Carolina
20011985
Initial Locally Funded
Project – 1986
Post Hugo FEMA
project – 1990
Federal “50-yr”
Project – 1997; 2008

Preliminary Design of the Quogue Beach Nourishment Project

  • 1.
    Preliminary Design ofthe Quogue Beach Nourishment Project Village of Quogue NY Aram Terchunian – Project Director Tim Kana – Sr Consulting Scientist Haiqing Kaczkowski – Project Engineer First Coastal Corporation & Coastal Science & Engineering
  • 2.
    Beach Profile –The Shore Zone That Absorbs Breaking Waves Average Waves Storm Waves After Komar 1998
  • 3.
    “Profile Volume” Equilibrium Profiles ProfileShape Will Change Frequently. But If the Profile Volume Remains Constant, The Beach Is In Equilibrium After Kana 1990
  • 4.
    Offshore Bar Application To QuogueBeach “Profile Volume”
  • 5.
    The First Coastal– CSE Team Determined: - Quogue Beach (~2.7 miles) has lost ~60,000 cy/yr since the 1950s. This is equivalent to ~5 ft/yr shoreline recession. - There is a sand deficit (~495,000 cy) in the profile compared with a normal healthy beach which is why the dry beach is narrow in summer and some dune sections erode each year - Quality Borrow Sand is Located ~1 mile offshore in ~50 ft depths - Approx 1.1 million cubic yards (+/- 15%) are required to restore the 2.7 mile beach and maintain a healthy beach for over 10 years - It is feasible to complete projects of this type in ~2 months using ocean-going hopper dredges or (possibly) traditional pipeline dredges - Upon completion of the project, the beach is expected to be indistinguishable from a natural beach, but average about 75 ft wider and offer more protection to property.
  • 6.
    Recommended Plan Bridgehampton-Water MillBeach – 3.0 miles “Beach Nourishment Longevity Is Proportional to the Square of the Project Length” “Double the Length and You Quadruple the Design Life” “Sand Moves East and West According to Wind and Wave Direction. But On Average More Sand Moves West Over Time” 7,875 ft7,751 ft Quogue Beach – 2.7 miles Reach 1 Reach 2 Reach 3 Net Sand Movement Net Sand Movement 1,100,000 cubic yards* $14.1 million *Middle range +15%
  • 7.
    Potential Borrow Area– Requires Confirmation Example 8 ft Boring Log ~700 Acres Minimum Boring Density Standard: 1 per 20 Acres
  • 8.
    Liberty Island First Load– 8:20 pm, 24 May 2011 Other Projects: Nags Head NC
  • 9.
    Nags Head Pier‒ Reach 1 23 Feb 2011 2 Sept 2011 21 Nov 201112 Jun 2012 STA525
  • 10.
    Nags Head NC– Accounting of Nourishment Volumes
  • 11.
    Unit Volume Changes(CY/FT) Relative To Nov-2010 Date of Survey Toe of Dune To +6 FT +6 FT To 0 FT 0 FT To -2 FT -2 FT To -6 FT -6 FT To -12 FT Nov-11 6 23 8 16 31 Jun-12 7 16 6 14 29 Outer Bar Movement
  • 12.
    Before Nourishment (Nov2010 ) ~10 Months After Nourishment (Jun 2012) 170 ft Toe of Dune to MLW = 315 ft Station 785+00 Jennett’s Pier ‒ Reach 1
  • 13.
    Unit Volume Changes(CY/FT) Relative To Nov-2010 Date of Survey Toe of Dune to +6 FT +6 FT To 0 FT 0 FT To -2 FT -2 FT To -6 FT -6 FT To -12 FT -12 FT To -19 FT -19 FT To -24 FT Nov-11 11 47 14 4 30 -2 2 Jun-12 17 42 13 0 53 7 1
  • 14.
     Phase 1- 6.8 miles - 1,735,000 cubic yards - Nov 2002 thru April 2003  Phase 2 - 5.8 miles - 1,850,000 cubic yards - January thru March 2003 Sponsors: Town of Pine Knoll Shores & Town of Indian Beach - Phase 1 Town of Emerald Isle - Phases 2 & 3 Bogue Banks Nourishment Project
  • 15.
    Pine Knoll ShoresNorth Carolina Photos by PA McKee & TW Kana September 1999 June 2004 July 2012 Post-FLOYD 2 yrs Post-Nourishment Present July 2012 Sept 2005 Post-OPHELIA 5-yrs Post-OPHELIA Renourishment Initial Locally Funded Project FEMA Funded Renourishment
  • 16.
    Myrtle Beach South Carolina 20011985 InitialLocally Funded Project – 1986 Post Hugo FEMA project – 1990 Federal “50-yr” Project – 1997; 2008