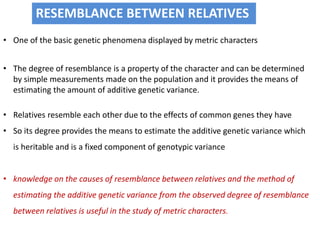
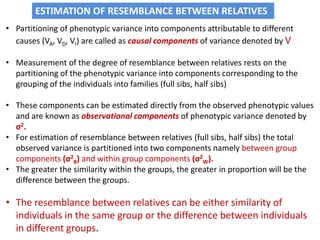
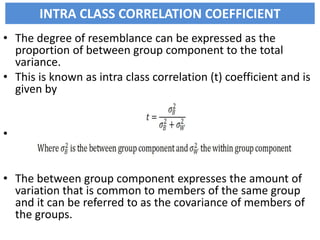
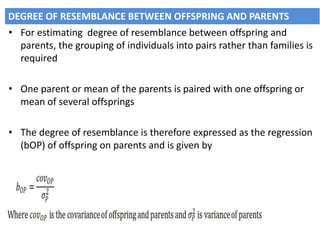
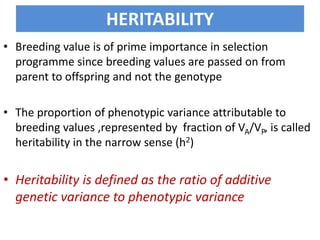
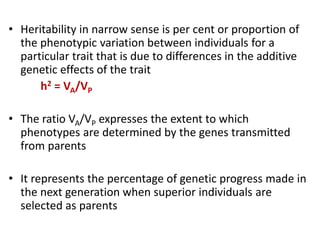
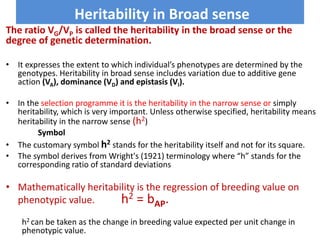
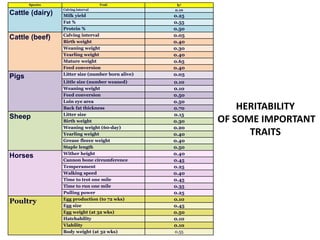
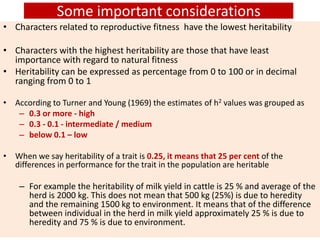
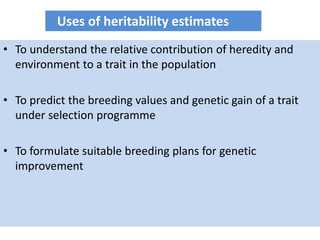
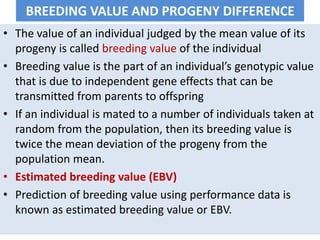
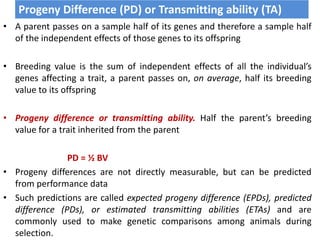
Topics: - Resemblance between the relatives
- Heritability
Dr S.Shanaz
RESEMBLANCE BETWEEN RELATIVES
• One of the basic genetic phenomena displayed by metric characters
• The degree of resemblance is a property of the character and can be determined
by simple measurements made on the population and it provides the means of
estimating the amount of additive genetic variance.
• Relatives resemble each other due to the effects of common genes they have
• So its degree provides the means to estimate the additive genetic variance which
is heritable and is a fixed component of genotypic variance
• knowledge on the causes of resemblance between relatives and the method of
estimating the additive genetic variance from the observed degree of resemblance
between relatives is useful in the study of metric characters.
• Partitioning of phenotypic variance into components attributable to different
causes (VA, VD, VI) are called as causal components of variance denoted by V
• Measurement of the degree of resemblance between relatives rests on the
partitioning of the phenotypic variance into components corresponding to the
grouping of the individuals into families (full sibs, half sibs)
• These components can be estimated directly from the observed phenotypic values
and are known as observational components of phenotypic variance denoted by
σ2.
• For estimation of resemblance between relatives (full sibs, half sibs) the total
observed variance is partitioned into two components namely between group
components (σ2
B) and within group components (σ2
W).
• The greater the similarity within the groups, the greater in proportion will be the
difference between the groups.
• The resemblance between relatives can be either similarity of
individuals in the same group or the difference between individuals
in different groups.
ESTIMATION OF RESEMBLANCE BETWEEN RELATIVES
INTRA CLASS CORRELATION COEFFICIENT
• The degree of resemblance can be expressed as the
proportion of between group component to the total
variance.
• This is known as intra class correlation (t) coefficient and is
given by
•
• The between group component expresses the amount of
variation that is common to members of the same group
and it can be referred to as the covariance of members of
the groups.
• For estimating degree of resemblance between offspring and
parents, the grouping of individuals into pairs rather than families is
required
• One parent or mean of the parents is paired with one offspring or
mean of several offsprings
• The degree of resemblance is therefore expressed as the regression
(bOP) of offspring on parents and is given by
DEGREE OF RESEMBLANCE BETWEEN OFFSPRING AND PARENTS
HERITABILITY
• Breeding value is of prime importance in selection
programme since breeding values are passed on from
parent to offspring and not the genotype
• The proportion of phenotypic variance attributable to
breeding values ,represented by fraction of VA/VP, is called
heritability in the narrow sense (h2)
• Heritability is defined as the ratio of additive
genetic variance to phenotypic variance
• Heritability in narrow sense is per cent or proportion of
the phenotypic variation between individuals for a
particular trait that is due to differences in the additive
genetic effects of the trait
h2 = VA/VP
• The ratio VA/VP expresses the extent to which
phenotypes are determined by the genes transmitted
from parents
• It represents the percentage of genetic progress made in
the next generation when superior individuals are
selected as parents
Heritability in Broad sense
The ratio VG/VP is called the heritability in the broad sense or the
degree of genetic determination.
• It expresses the extent to which individual’s phenotypes are determined by the
genotypes. Heritability in broad sense includes variation due to additive gene
action (VA), dominance (VD) and epistasis (VI).
• In the selection programme it is the heritability in the narrow sense or simply
heritability, which is very important. Unless otherwise specified, heritability means
heritability in the narrow sense (h2)
Symbol
• The customary symbol h2 stands for the heritability itself and not for its square.
• The symbol derives from Wright's (1921) terminology where “h” stands for the
corresponding ratio of standard deviations
• Mathematically heritability is the regression of breeding value on
phenotypic value. h2 = bAP.
h2 can be taken as the change in breeding value expected per unit change in
phenotypic value.
Importance of heritability
• The success of Breeder in changing the characteristics of
population can be predicted only from knowledge of
degree of relationship between phenotypic values and
breeding values
• This is degree of correspondence & is measured by the
heritability
• Heritability in narrow sense is a measure of the strength
of the relationship between phenotypic values and
breeding values for a trait in a population
• Heritability in the broad sense is a measure of the
strength of the relationship between phenotypic values
and genotypic values.
• Heritability is a property of the character, population and the environment
in which it is measured
• Value of the heritability depends on the magnitude of all the components of
variance (VP = VA+VD+VI+VE), so change in any one of these will affect it
• All the genetic components are influenced by gene frequencies and may
differ from one population to another
• More variable environment reduces the heritability and more uniform
condition increases
• Heritability of a trait is not fixed. It varies from population to population
and from environment to environment
• Heritability ranges from 0 to 1
• If heritability is high, selection tends to be effective and vice versa.
Features of Heritability
HERITABILITY
OF SOME IMPORTANT
TRAITS
Species Trait h2
Cattle (dairy)
Calving interval 0.10
Milk yield 0.25
Fat % 0.55
Protein % 0.50
Cattle (beef) Calving interval 0.05
Birth weight 0.40
Weaning weight 0.30
Yearling weight 0.40
Mature weight 0.65
Feed conversion 0.40
Pigs Litter size (number born alive) 0.05
Little size (number weaned) 0.10
Weaning weight 0.10
Feed conversion 0.50
Loin eye area 0.50
Back fat thickness 0.70
Sheep Litter size 0.15
Birth weight 0.30
Weaning weight (60-day) 0.20
Yearling weight 0.40
Grease fleece weight 0.40
Staple length 0.50
Horses Wither height 0.40
Cannon bone circumference 0.45
Temperament 0.25
Walking speed 0.40
Time to trot one mile 0.45
Time to run one mile 0.35
Pulling power 0.25
Poultry Egg production (to 72 wks) 0.10
Egg size 0.45
Egg weight (at 32 wks) 0.50
Hatchability 0.10
Viability 0.10
Body weight (at 32 wks) 0.55
Some important considerations
• Characters related to reproductive fitness have the lowest heritability
• Characters with the highest heritability are those that have least
importance with regard to natural fitness
• Heritability can be expressed as percentage from 0 to 100 or in decimal
ranging from 0 to 1
• According to Turner and Young (1969) the estimates of h2 values was grouped as
– 0.3 or more - high
– 0.3 - 0.1 - intermediate / medium
– below 0.1 – low
• When we say heritability of a trait is 0.25, it means that 25 per cent of the
differences in performance for the trait in the population are heritable
– For example the heritability of milk yield in cattle is 25 % and average of the
herd is 2000 kg. This does not mean that 500 kg (25%) is due to heredity
and the remaining 1500 kg to environment. It means that of the difference
between individual in the herd in milk yield approximately 25 % is due to
heredity and 75 % is due to environment.
• To understand the relative contribution of heredity and
environment to a trait in the population
• To predict the breeding values and genetic gain of a trait
under selection programme
• To formulate suitable breeding plans for genetic
improvement
Uses of heritability estimates
BREEDING VALUE AND PROGENY DIFFERENCE
• The value of an individual judged by the mean value of its
progeny is called breeding value of the individual
• Breeding value is the part of an individual’s genotypic value
that is due to independent gene effects that can be
transmitted from parents to offspring
• If an individual is mated to a number of individuals taken at
random from the population, then its breeding value is
twice the mean deviation of the progeny from the
population mean.
• Estimated breeding value (EBV)
• Prediction of breeding value using performance data is
known as estimated breeding value or EBV.
• A parent passes on a sample half of its genes and therefore a sample half
of the independent effects of those genes to its offspring
• Breeding value is the sum of independent effects of all the individual’s
genes affecting a trait, a parent passes on, on average, half its breeding
value to its offspring
• Progeny difference or transmitting ability. Half the parent’s breeding
value for a trait inherited from the parent
PD = ½ BV
• Progeny differences are not directly measurable, but can be predicted
from performance data
• Such predictions are called expected progeny difference (EPDs), predicted
difference (PDs), or estimated transmitting abilities (ETAs) and are
commonly used to make genetic comparisons among animals during
selection.
Progeny Difference (PD) or Transmitting ability (TA)
Resemblance between relatives

Resemblance between relatives

  • 1.
    Topics: - Resemblancebetween the relatives - Heritability Dr S.Shanaz
  • 2.
    RESEMBLANCE BETWEEN RELATIVES •One of the basic genetic phenomena displayed by metric characters • The degree of resemblance is a property of the character and can be determined by simple measurements made on the population and it provides the means of estimating the amount of additive genetic variance. • Relatives resemble each other due to the effects of common genes they have • So its degree provides the means to estimate the additive genetic variance which is heritable and is a fixed component of genotypic variance • knowledge on the causes of resemblance between relatives and the method of estimating the additive genetic variance from the observed degree of resemblance between relatives is useful in the study of metric characters.
  • 3.
    • Partitioning ofphenotypic variance into components attributable to different causes (VA, VD, VI) are called as causal components of variance denoted by V • Measurement of the degree of resemblance between relatives rests on the partitioning of the phenotypic variance into components corresponding to the grouping of the individuals into families (full sibs, half sibs) • These components can be estimated directly from the observed phenotypic values and are known as observational components of phenotypic variance denoted by σ2. • For estimation of resemblance between relatives (full sibs, half sibs) the total observed variance is partitioned into two components namely between group components (σ2 B) and within group components (σ2 W). • The greater the similarity within the groups, the greater in proportion will be the difference between the groups. • The resemblance between relatives can be either similarity of individuals in the same group or the difference between individuals in different groups. ESTIMATION OF RESEMBLANCE BETWEEN RELATIVES
  • 4.
    INTRA CLASS CORRELATIONCOEFFICIENT • The degree of resemblance can be expressed as the proportion of between group component to the total variance. • This is known as intra class correlation (t) coefficient and is given by • • The between group component expresses the amount of variation that is common to members of the same group and it can be referred to as the covariance of members of the groups.
  • 5.
    • For estimatingdegree of resemblance between offspring and parents, the grouping of individuals into pairs rather than families is required • One parent or mean of the parents is paired with one offspring or mean of several offsprings • The degree of resemblance is therefore expressed as the regression (bOP) of offspring on parents and is given by DEGREE OF RESEMBLANCE BETWEEN OFFSPRING AND PARENTS
  • 6.
    HERITABILITY • Breeding valueis of prime importance in selection programme since breeding values are passed on from parent to offspring and not the genotype • The proportion of phenotypic variance attributable to breeding values ,represented by fraction of VA/VP, is called heritability in the narrow sense (h2) • Heritability is defined as the ratio of additive genetic variance to phenotypic variance
  • 7.
    • Heritability innarrow sense is per cent or proportion of the phenotypic variation between individuals for a particular trait that is due to differences in the additive genetic effects of the trait h2 = VA/VP • The ratio VA/VP expresses the extent to which phenotypes are determined by the genes transmitted from parents • It represents the percentage of genetic progress made in the next generation when superior individuals are selected as parents
  • 8.
    Heritability in Broadsense The ratio VG/VP is called the heritability in the broad sense or the degree of genetic determination. • It expresses the extent to which individual’s phenotypes are determined by the genotypes. Heritability in broad sense includes variation due to additive gene action (VA), dominance (VD) and epistasis (VI). • In the selection programme it is the heritability in the narrow sense or simply heritability, which is very important. Unless otherwise specified, heritability means heritability in the narrow sense (h2) Symbol • The customary symbol h2 stands for the heritability itself and not for its square. • The symbol derives from Wright's (1921) terminology where “h” stands for the corresponding ratio of standard deviations • Mathematically heritability is the regression of breeding value on phenotypic value. h2 = bAP. h2 can be taken as the change in breeding value expected per unit change in phenotypic value.
  • 9.
    Importance of heritability •The success of Breeder in changing the characteristics of population can be predicted only from knowledge of degree of relationship between phenotypic values and breeding values • This is degree of correspondence & is measured by the heritability • Heritability in narrow sense is a measure of the strength of the relationship between phenotypic values and breeding values for a trait in a population • Heritability in the broad sense is a measure of the strength of the relationship between phenotypic values and genotypic values.
  • 10.
    • Heritability isa property of the character, population and the environment in which it is measured • Value of the heritability depends on the magnitude of all the components of variance (VP = VA+VD+VI+VE), so change in any one of these will affect it • All the genetic components are influenced by gene frequencies and may differ from one population to another • More variable environment reduces the heritability and more uniform condition increases • Heritability of a trait is not fixed. It varies from population to population and from environment to environment • Heritability ranges from 0 to 1 • If heritability is high, selection tends to be effective and vice versa. Features of Heritability
  • 11.
    HERITABILITY OF SOME IMPORTANT TRAITS SpeciesTrait h2 Cattle (dairy) Calving interval 0.10 Milk yield 0.25 Fat % 0.55 Protein % 0.50 Cattle (beef) Calving interval 0.05 Birth weight 0.40 Weaning weight 0.30 Yearling weight 0.40 Mature weight 0.65 Feed conversion 0.40 Pigs Litter size (number born alive) 0.05 Little size (number weaned) 0.10 Weaning weight 0.10 Feed conversion 0.50 Loin eye area 0.50 Back fat thickness 0.70 Sheep Litter size 0.15 Birth weight 0.30 Weaning weight (60-day) 0.20 Yearling weight 0.40 Grease fleece weight 0.40 Staple length 0.50 Horses Wither height 0.40 Cannon bone circumference 0.45 Temperament 0.25 Walking speed 0.40 Time to trot one mile 0.45 Time to run one mile 0.35 Pulling power 0.25 Poultry Egg production (to 72 wks) 0.10 Egg size 0.45 Egg weight (at 32 wks) 0.50 Hatchability 0.10 Viability 0.10 Body weight (at 32 wks) 0.55
  • 12.
    Some important considerations •Characters related to reproductive fitness have the lowest heritability • Characters with the highest heritability are those that have least importance with regard to natural fitness • Heritability can be expressed as percentage from 0 to 100 or in decimal ranging from 0 to 1 • According to Turner and Young (1969) the estimates of h2 values was grouped as – 0.3 or more - high – 0.3 - 0.1 - intermediate / medium – below 0.1 – low • When we say heritability of a trait is 0.25, it means that 25 per cent of the differences in performance for the trait in the population are heritable – For example the heritability of milk yield in cattle is 25 % and average of the herd is 2000 kg. This does not mean that 500 kg (25%) is due to heredity and the remaining 1500 kg to environment. It means that of the difference between individual in the herd in milk yield approximately 25 % is due to heredity and 75 % is due to environment.
  • 13.
    • To understandthe relative contribution of heredity and environment to a trait in the population • To predict the breeding values and genetic gain of a trait under selection programme • To formulate suitable breeding plans for genetic improvement Uses of heritability estimates
  • 14.
    BREEDING VALUE ANDPROGENY DIFFERENCE • The value of an individual judged by the mean value of its progeny is called breeding value of the individual • Breeding value is the part of an individual’s genotypic value that is due to independent gene effects that can be transmitted from parents to offspring • If an individual is mated to a number of individuals taken at random from the population, then its breeding value is twice the mean deviation of the progeny from the population mean. • Estimated breeding value (EBV) • Prediction of breeding value using performance data is known as estimated breeding value or EBV.
  • 15.
    • A parentpasses on a sample half of its genes and therefore a sample half of the independent effects of those genes to its offspring • Breeding value is the sum of independent effects of all the individual’s genes affecting a trait, a parent passes on, on average, half its breeding value to its offspring • Progeny difference or transmitting ability. Half the parent’s breeding value for a trait inherited from the parent PD = ½ BV • Progeny differences are not directly measurable, but can be predicted from performance data • Such predictions are called expected progeny difference (EPDs), predicted difference (PDs), or estimated transmitting abilities (ETAs) and are commonly used to make genetic comparisons among animals during selection. Progeny Difference (PD) or Transmitting ability (TA)