Reporte de especificidad y sensibildad de la prueba de intolerancias alimenticias
•
0 likes•378 views

Reporte de especificidad y sensibildad de la prueba de intolerancias alimenticias

Recommended
Recommended
More Related Content
What's hot
What's hot (13)
Similar to Reporte de especificidad y sensibildad de la prueba de intolerancias alimenticias
Similar to Reporte de especificidad y sensibildad de la prueba de intolerancias alimenticias (20)
More from MEDIAGNOSTIC
More from MEDIAGNOSTIC (10)
Recently uploaded
Recently uploaded (20)
Reporte de especificidad y sensibildad de la prueba de intolerancias alimenticias
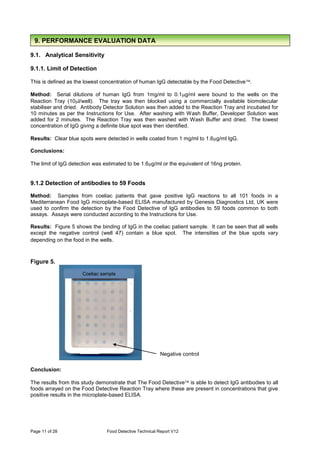
- 1. Page 11 of 28 Food Detective Technical Report V12 9.1. Analytical Sensitivity 9.1.1. Limit of Detection This is defined as the lowest concentration of human IgG detectable by the Food Detective. Method: Serial dilutions of human IgG from 1mg/ml to 0.1g/ml were bound to the wells on the Reaction Tray (10l/well). The tray was then blocked using a commercially available biomolecular stabiliser and dried. Antibody Detector Solution was then added to the Reaction Tray and incubated for 10 minutes as per the Instructions for Use. After washing with Wash Buffer, Developer Solution was added for 2 minutes. The Reaction Tray was then washed with Wash Buffer and dried. The lowest concentration of IgG giving a definite blue spot was then identified. Results: Clear blue spots were detected in wells coated from 1 mg/ml to 1.6g/ml IgG. Conclusions: The limit of IgG detection was estimated to be 1.6g/ml or the equivalent of 16ng protein. 9.1.2 Detection of antibodies to 59 Foods Method: Samples from coeliac patients that gave positive IgG reactions to all 101 foods in a Mediterranean Food IgG microplate-based ELISA manufactured by Genesis Diagnostics Ltd, UK were used to confirm the detection by the Food Detective of IgG antibodies to 59 foods common to both assays. Assays were conducted according to the Instructions for Use. Results: Figure 5 shows the binding of IgG in the coeliac patient sample. It can be seen that all wells except the negative control (well 47) contain a blue spot. The intensities of the blue spots vary depending on the food in the wells. Figure 5. Conclusion: The results from this study demonstrate that The Food Detective is able to detect IgG antibodies to all foods arrayed on the Food Detective Reaction Tray where these are present in concentrations that give positive results in the microplate-based ELISA. Coeliac sample Negative control 9. PERFORMANCE EVALUATION DATA
- 2. Page 12 of 28 Food Detective Technical Report V12 9.2. Sensitivity, specificity and accuracy relative to conventional microplate-based ELISA Method: Relative sensitivity and specificity of the Food Detective was assessed in relation to the detection of positive IgG reactions (>12 U/ml) and negative reactions (<12 U/ml) by the microplate- based 93 Food IgG and Mediterranean Food IgG ELISAs both manufactured by Genesis Diagnostics Ltd. Since the Food Detective is a qualitative assay, borderline results obtained in the semi-quantitative microplate-based assays are considered negative in this study. Results and Conclusions: Table 2 shows the % sensitivity, specificity and accuracy for the detection of IgG's to each food/mixture included in the Food Detective in relation to the target response derived from the microplate-based assay. These data confirm that the Food Detective is suitable for its intended use. Table 2. Food Detective Food % Sensitivity % Specificity % Accuracy Oat 100 100 100 Wheat 88 100 92 Rice 100 100 100 Corn 100 100 100 Rye 88 100 92 Durum Wheat 100 100 100 Gluten 88 100 92 Almond 100 100 100 Brazil 100 100 100 Cashew 100 100 100 Tea 100 100 100 Walnut 75 100 92 Cow Milk 100 100 100 Whole Egg 100 100 100 Chicken 88 100 92 Lamb 100 100 100 Beef 100 100 100 Pork 100 100 100 White Fish 100 100 100 Freshwater Fish 100 100 100 Tuna 100 100 100 Shellfish 100 100 100 Broccoli 100 100 100 Cabbage 100 100 100 Carrot 100 100 100 Leek 100 100 100 Potato 100 100 100 Celery 100 100 100 Cucumber 100 100 100 Peppers 100 100 100 Legume Mix 83 100 92 Grapefruit 100 100 100 Melon Mix 100 100 100 Peanut 100 100 100 Soya Bean 100 100 100 Cocoa Bean 100 100 100 Apple 100 100 100 Blackcurrant 100 100 100 Olive 100 100 100 Orange/Lemon 100 100 100 Strawberry 100 100 100 Tomato 100 100 100 Ginger 100 100 100 Garlic 100 100 100 Mushroom 100 100 100 Yeast 86 100 92
- 3. Page 13 of 28 Food Detective Technical Report V12 9.3 Antigen absorption studies Specificity has been confirmed using antigen absorption studies. Method: Food IgG positive sera were pre-incubated with the reactive food antigen prior to assay. This allows any IgG antibodies to the foods to complex to the food antigens rendering the antibodies unavailable for binding to the food in the subsequent immunoassay. The results for absorbed serum are compared with those for unabsorbed serum. In the example in Table 3, samples positive for IgG's to tea, lentil, oat, almond, egg, beef, shellfish, cabbage, tomato, mustard, yeast and potato were absorbed with the corresponding antigen at room temperature for 1 hour. Unabsorbed sera were treated with the buffer in which the extracts are dissolved. Absorbed and unabsorbed sera were then diluted in Sample Diluent and the assay was performed as per the Instructions for Use. The intensity of blue spots was scored with 6+ indicating a very intense spot and 1 + a weak positive spot; (-) indicates a negative result. Where no effect of absorption was observed following a one hour incubation at room temperature, absorptions were carried out at 37 o C for 2 hours (Table 4). Cross-over absorptions were also performed to confirm food IgG specificity (Table 5 and Table 6). Results: It can be seen from Table 3 that absorption of food IgG positive sera with the cognate antigen significantly decreased antibody binding to the corresponding food on the Reaction Tray for all foods except potato. Table 3. Comparison of unabsorbed sera and sera absorbed with various antigens for 1 hour at room temperature. Tea Lentil Oat Almond Unabsorbed 2+ 3+ 6+ 1+ Absorbed +/- 1+ 3+ +/- Egg Beef Shellfish Cabbage Unabsorbed 5+ 2+ 3+ 5+ Absorbed 1+ 1+ 1+ +/- Tomato Mustard Yeast Potato Unabsorbed 4+ 4+ 5+ 1+ Absorbed 2+ 1+ +/- 1+ Longer absorptions at 37 o C reduced binding further as shown in Table 4.
- 4. Page 14 of 28 Food Detective Technical Report V12 Table 4. Comparison of unabsorbed sera and sera absorbed with various antigens for 2 hours at 37 o C. Plate 1 Tea Lentil Oat Almond Unabsorbed 2+ 3+ 6+ 1+ Absorbed - - 1+ - Egg Beef Shellfish Cabbage 5+ 2+ 3+ 5+ - - - - Plate 3 Tomato Mustard Yeast Potato Unabsorbed 4+ 4+ 6+ 1+ Absorbed 1+ 2+ 1+ - Table 5 shows the effect of absorption with yeast extract on the binding of IgG to non-yeast extracts and to yeast. It can be seen that only IgG binding to yeast is affected by absorbing serum with yeast. Table 5. The effect of absorption with yeast on IgG binding to various antigens. Plate 1 Tea Lentil Oat Almond Unabsorbed 3+ 4+ 4+ 2+ Absorbed with yeast 3+ 4+ 4+ 2+ Plate 2 Egg Beef Shellfish Cabbage Unabsorbed 3+ 2+ 2+ 5+ Absorbed with yeast 3+ 3+ 2+ 5+ Plate 3 Tomato Mustard Yeast Potato Unabsorbed 4+ 4+ 5+ 3+ Absorbed with yeast 3+ 3+ 1+ 3+
- 5. Page 15 of 28 Food Detective Technical Report V12 Table 6. The effect of absorption with mustard, oat and cabbage on IgG binding to various antigens. Tea Lentil Oat Almond Unabsorbed 2+ 4+ 4+ 2+ Absorbed with mustard 2+ 4+ 4+ 2+ Egg Beef Shellfish Cabbage Unabsorbed 3+ 2+ 2+ 5+ Absorbed with oat 3+ 3+ 2+ 5+ Tomato Mustard Yeast Potato Unabsorbed 4+ 4+ 5+ 3+ Absorbed with cabbage Neg 3+ 5+ 1+ It can be seen from Table 6 that absorption of serum with mustard had no effect on IgG binding to tea, lentil, oat and almond. Absorption with oat had no effect on IgG binding to egg, beef, shellfish and cabbage. Absorption of serum with cabbage significantly reduced binding of IgG to tomato and to a lesser extent to mustard and potato, but had no effect on IgG binding to yeast. Conclusions: Absorption studies, examples of which are shown in Tables 3-6 have confirmed the specificity of food antibody binding for almost all foods. The finding that absorption with cabbage reduced IgG binding to mustard probably reflects antibody cross-reactivity, since cabbage and mustard are both members of the Mustard family. Antibody cross-reactivity may also explain the effect of cabbage absorption on IgG reactivity with tomato and potato. The latter are both members of the Nightshade family. Food antibody cross-reactivity is well documented; further examples are given in Table 7. Table 7. Food antibody cross reactivity Reactive foods Cross-reactive foods Cows’ milk Hens’ eggs Peanuts Various tree nuts Soya bean Fish Wheat Other animal milk Eggs of other birds Various tree nuts; rarely other legumes Cross react with one another and with peanut Seldom cross-reacts significantly with other legumes Other fish Other cereals
- 6. Page 16 of 28 Food Detective Technical Report V12 9.4 Intralot reproducibility Method: 5 randomly selected plates were assayed using corresponding kit components and sera with characterised food IgG immunoreactivity. Patterns of immunoreactivity shown by the kits are compared by visual inspection and recorded to confirm reproducibility. Results: See Table 8 and Table 9 Table 8. Positive sample C10271 Sample 18029 Plate Well Food 1 2 3 4 5 1 Oat + + + + + 2 Wheat + + + + + 3 Rice + + + + + 4 Corn + + + + + 5 Rye + + + + + 6 Durum Wheat + + + + + 7 Gluten + + + + + 8 Almond + + + + + 9 Brazil + + + + + 10 Cashew + + + + + 11 Tea + + + + + 12 Walnut + + + + + 13 Cow Milk + + + + + 14 Whole Egg + + + + + 15 Chicken + + + + + 16 Lamb + + + + + 17 Beef + + + + + 18 Pork + + + + + 19 White Fish + + + + + 20 Freshwater Fish + + + + + 21 Tuna + + + + + 22 Shellfish + + + + + 23 Broccoli + + + + + 24 Cabbage + + + + + 25 Carrot + + + + + 26 Leek + + + + + 27 Potato + + + + + 28 Celery + + + + + 29 Cucumber + + + + + 30 Peppers + + + + + 31 Legume Mix + + + + + 32 Grapefruit + + + + + 33 Melon Mix + + + + + 34 Peanut + + + + + 35 Soya Bean + + + + + 36 Cocoa Bean + + + + + 37 Apple + + + + + 38 Blackcurrant + + + + + 39 Olive + + + + + 40 Orange/Lemon + + + + + 41 Strawberry + + + + + 42 Tomato + + + + + 43 Ginger + + + + + 44 Garlic + + + + + 45 Mushroom + + + + + 46 Yeast + + + + + 47 Negative 48 Positive + + + + +
- 7. Page 17 of 28 Food Detective Technical Report V12 Table 9. Negative sample Conclusions: Manufacturing procedures give rise to highly reproducible intralot assay performance. C10271 Sample MIR Plate Well Food 1 2 3 4 5 1 Oat - - - - - 2 Wheat - - - - - 3 Rice - - - - - 4 Corn - - - - - 5 Rye - - - - - 6 Durum Wheat - - - - - 7 Gluten - - - - - 8 Almond - - - - - 9 Brazil - - - - - 10 Cashew - - - - - 11 Tea - - - - - 12 Walnut - - - - - 13 Cow Milk - - - - - 14 Whole Egg - - - - - 15 Chicken - - - - - 16 Lamb - - - - - 17 Beef - - - - - 18 Pork - - - - - 19 White Fish - - - - - 20 Freshwater Fish - - - - - 21 Tuna - - - - - 22 Shellfish - - - - - 23 Broccoli - - - - - 24 Cabbage - - - - - 25 Carrot - - - - - 26 Leek - - - - - 27 Potato - - - - - 28 Celery - - - - - 29 Cucumber - - - - - 30 Peppers - - - - - 31 Legume Mix - - - - - 32 Grapefruit - - - - - 33 Melon Mix - - - - - 34 Peanut - - - - - 35 Soya Bean - - - - - 36 Cocoa Bean - - - - - 37 Apple - - - - - 38 Blackcurrant - - - - - 39 Olive - - - - - 40 Orange/Lemon - - - - - 41 Strawberry - - - - - 42 Tomato - - - - - 43 Ginger - - - - - 44 Garlic - - - - - 45 Mushroom - - - - - 46 Yeast - - - - - 47 Negative - - - - - 48 Positive + + + + +
- 8. Page 18 of 28 Food Detective Technical Report V12 9.5 Interlot reproducibility Method: Each kit lot is assayed at QC using sera with characterised food IgG immunoreactivity and the results are compared with those obtained with a previously passed kit lot to confirm reproducibility. Results: See Table 10 Table 10. Sample IW Kit lot Well Food 10276 10289 10303 1 Oat 2 Wheat + + + 3 Rice 4 Corn 5 Rye + + + 6 Durum Wheat 7 Gluten + + + 8 Almond 9 Brazil 10 Cashew + + + 11 Tea + + + 12 Walnut 13 Cow Milk + + + 14 Whole Egg + + + 15 Chicken 16 Lamb 17 Beef 18 Pork 19 White Fish 20 Freshwater Fish 21 Tuna 22 Shellfish + + + 23 Broccoli 24 Cabbage 25 Carrot 26 Leek 27 Potato 28 Celery 29 Cucumber 30 Peppers 31 Legume Mix 32 Grapefruit 33 Melon Mix 34 Peanut 35 Soya Bean + + + 36 Cocoa Bean + + + 37 Apple 38 Blackcurrant 39 Olive 40 Orange/Lemon 41 Strawberry 42 Tomato 43 Ginger 44 Garlic 45 Mushroom 46 Yeast 47 Negative 48 Positive + + + Conclusions: Manufacturing procedures assure interlot reproducibility
- 9. Page 19 of 28 Food Detective Technical Report V12 9.6 Matrix Effects Method: The effects of common, potentially interfering substances were assessed by spiking samples with triglycerides to 3g/dL, haemoglobin to 100mg/dl and bilirubin to 40mg/dL. Blood samples with added triglycerides, haemoglobin and bilirubin were then tested in parallel with controls in Food Detective. Results: See Figure 6 for representative results. Figure 6. GD blood sample with 3g/dL of triglycerides GD blood sample without triglycerides GD blood sample with 1000mg/dlL of haemoglobin GD blood sample without haemoglobin + Triglycerides - Triglycerides + Triglycerides - Triglycerides + Haemoglobin - Haemoglobin
- 10. Page 20 of 28 Food Detective Technical Report V12 Figure 6 contd GD blood sample with added 40mg/dl of bilirubin GD blood sample without bilirubin Conclusions: No interference was observed with hemolytic (up to 1000 mg/dL), lipemic (up to 3 g/dL triglycerides) or bilirubin (up to 40 mg/dL) containing blood samples. - Triglycerides + Bilirubin - Bilirubin