Download to read offline

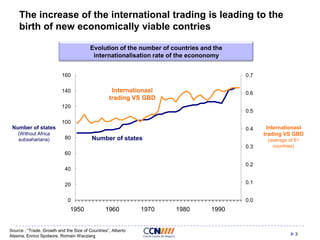
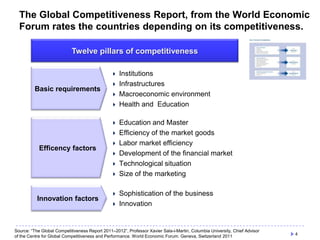
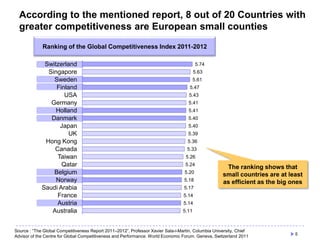
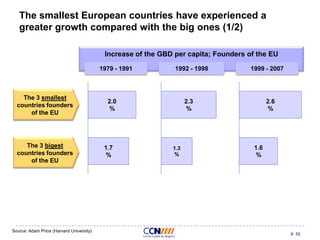
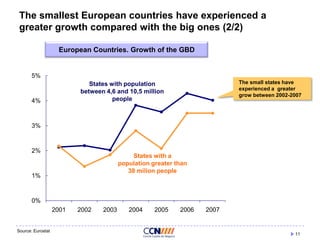


The document discusses how small countries can be economically viable. It notes that the number of states has increased significantly over the last 60 years. As international trade has expanded, it has led to the emergence of new economically viable smaller countries. Several rankings of country competitiveness show that many of the top competitive countries are small European states, including Switzerland, Denmark, and Sweden. The document argues that Catalonia has a population and geographic size similar to these successful small European countries. It presents data showing that smaller European nations have experienced higher GDP growth than larger countries, especially in more recent years. Therefore, being a small country continues to be an advantage for national wealth and competitiveness.


![Global Entrepreneurship Pp Update Lkb 1 26 2012[1]](https://cdn.slidesharecdn.com/ss_thumbnails/globalentrepreneurshipppupdatelkb12620121-13324381627488-phpapp02-120322124344-phpapp02-thumbnail.jpg?width=640&height=640&fit=bounds)
![[Challenge:Future] Leveraging Est European Competitiveness through innovation](https://cdn.slidesharecdn.com/ss_thumbnails/challengefuture-leveraging-est-european-competitiveness-through-innovation4639-130228022804-phpapp01-thumbnail.jpg?width=640&height=640&fit=bounds)