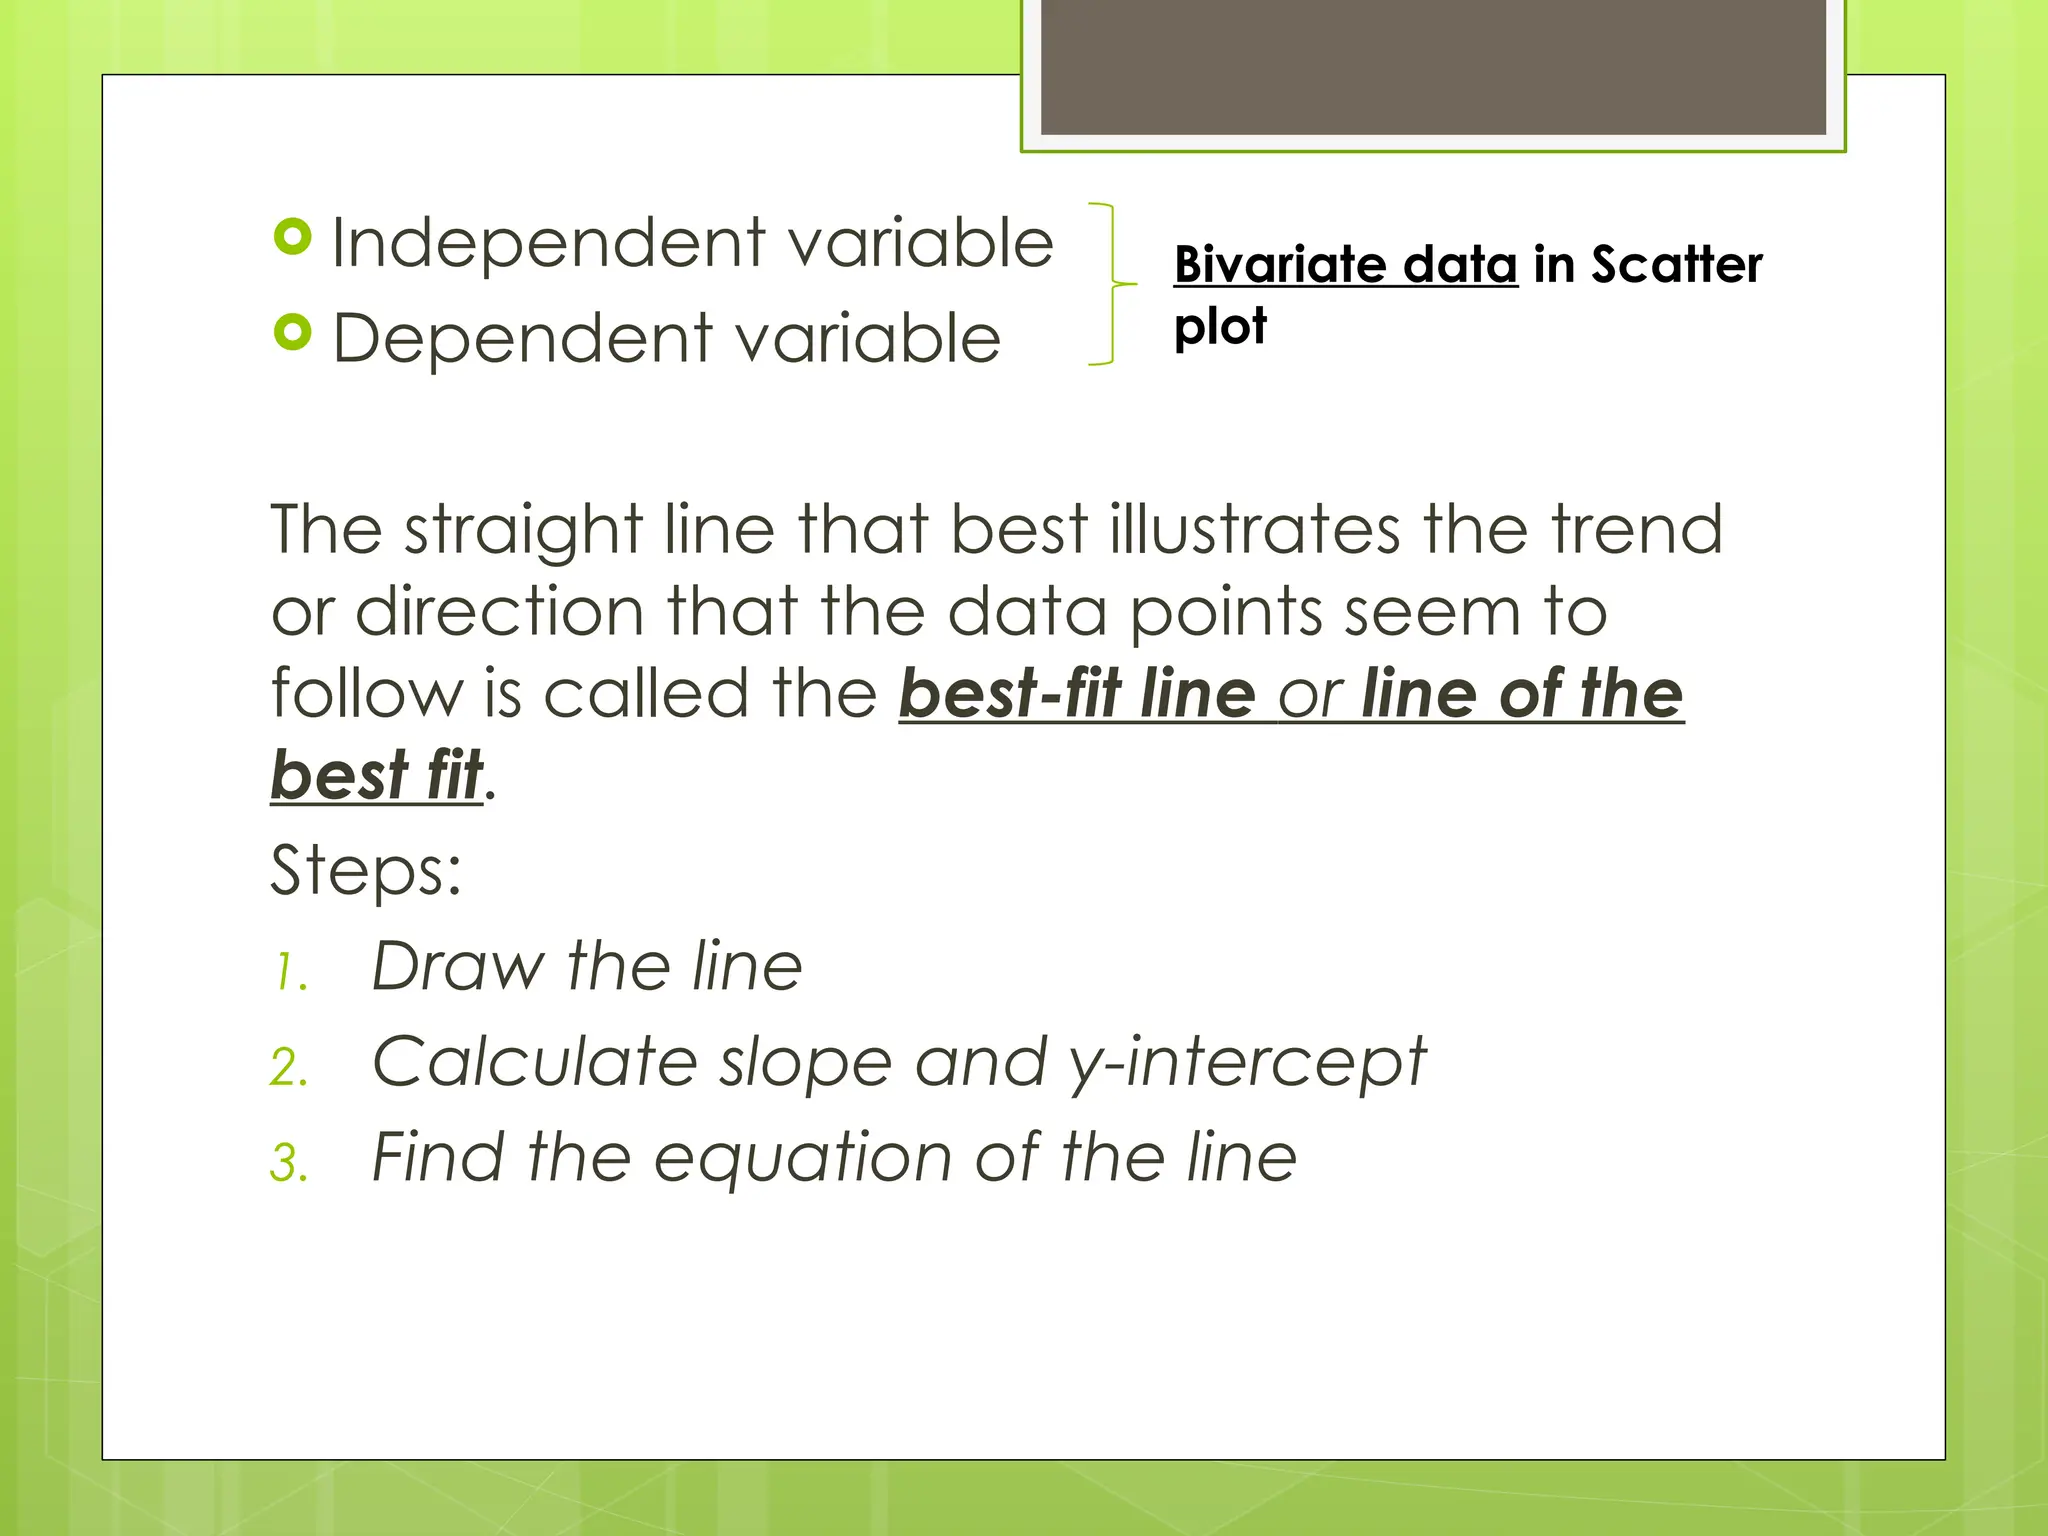
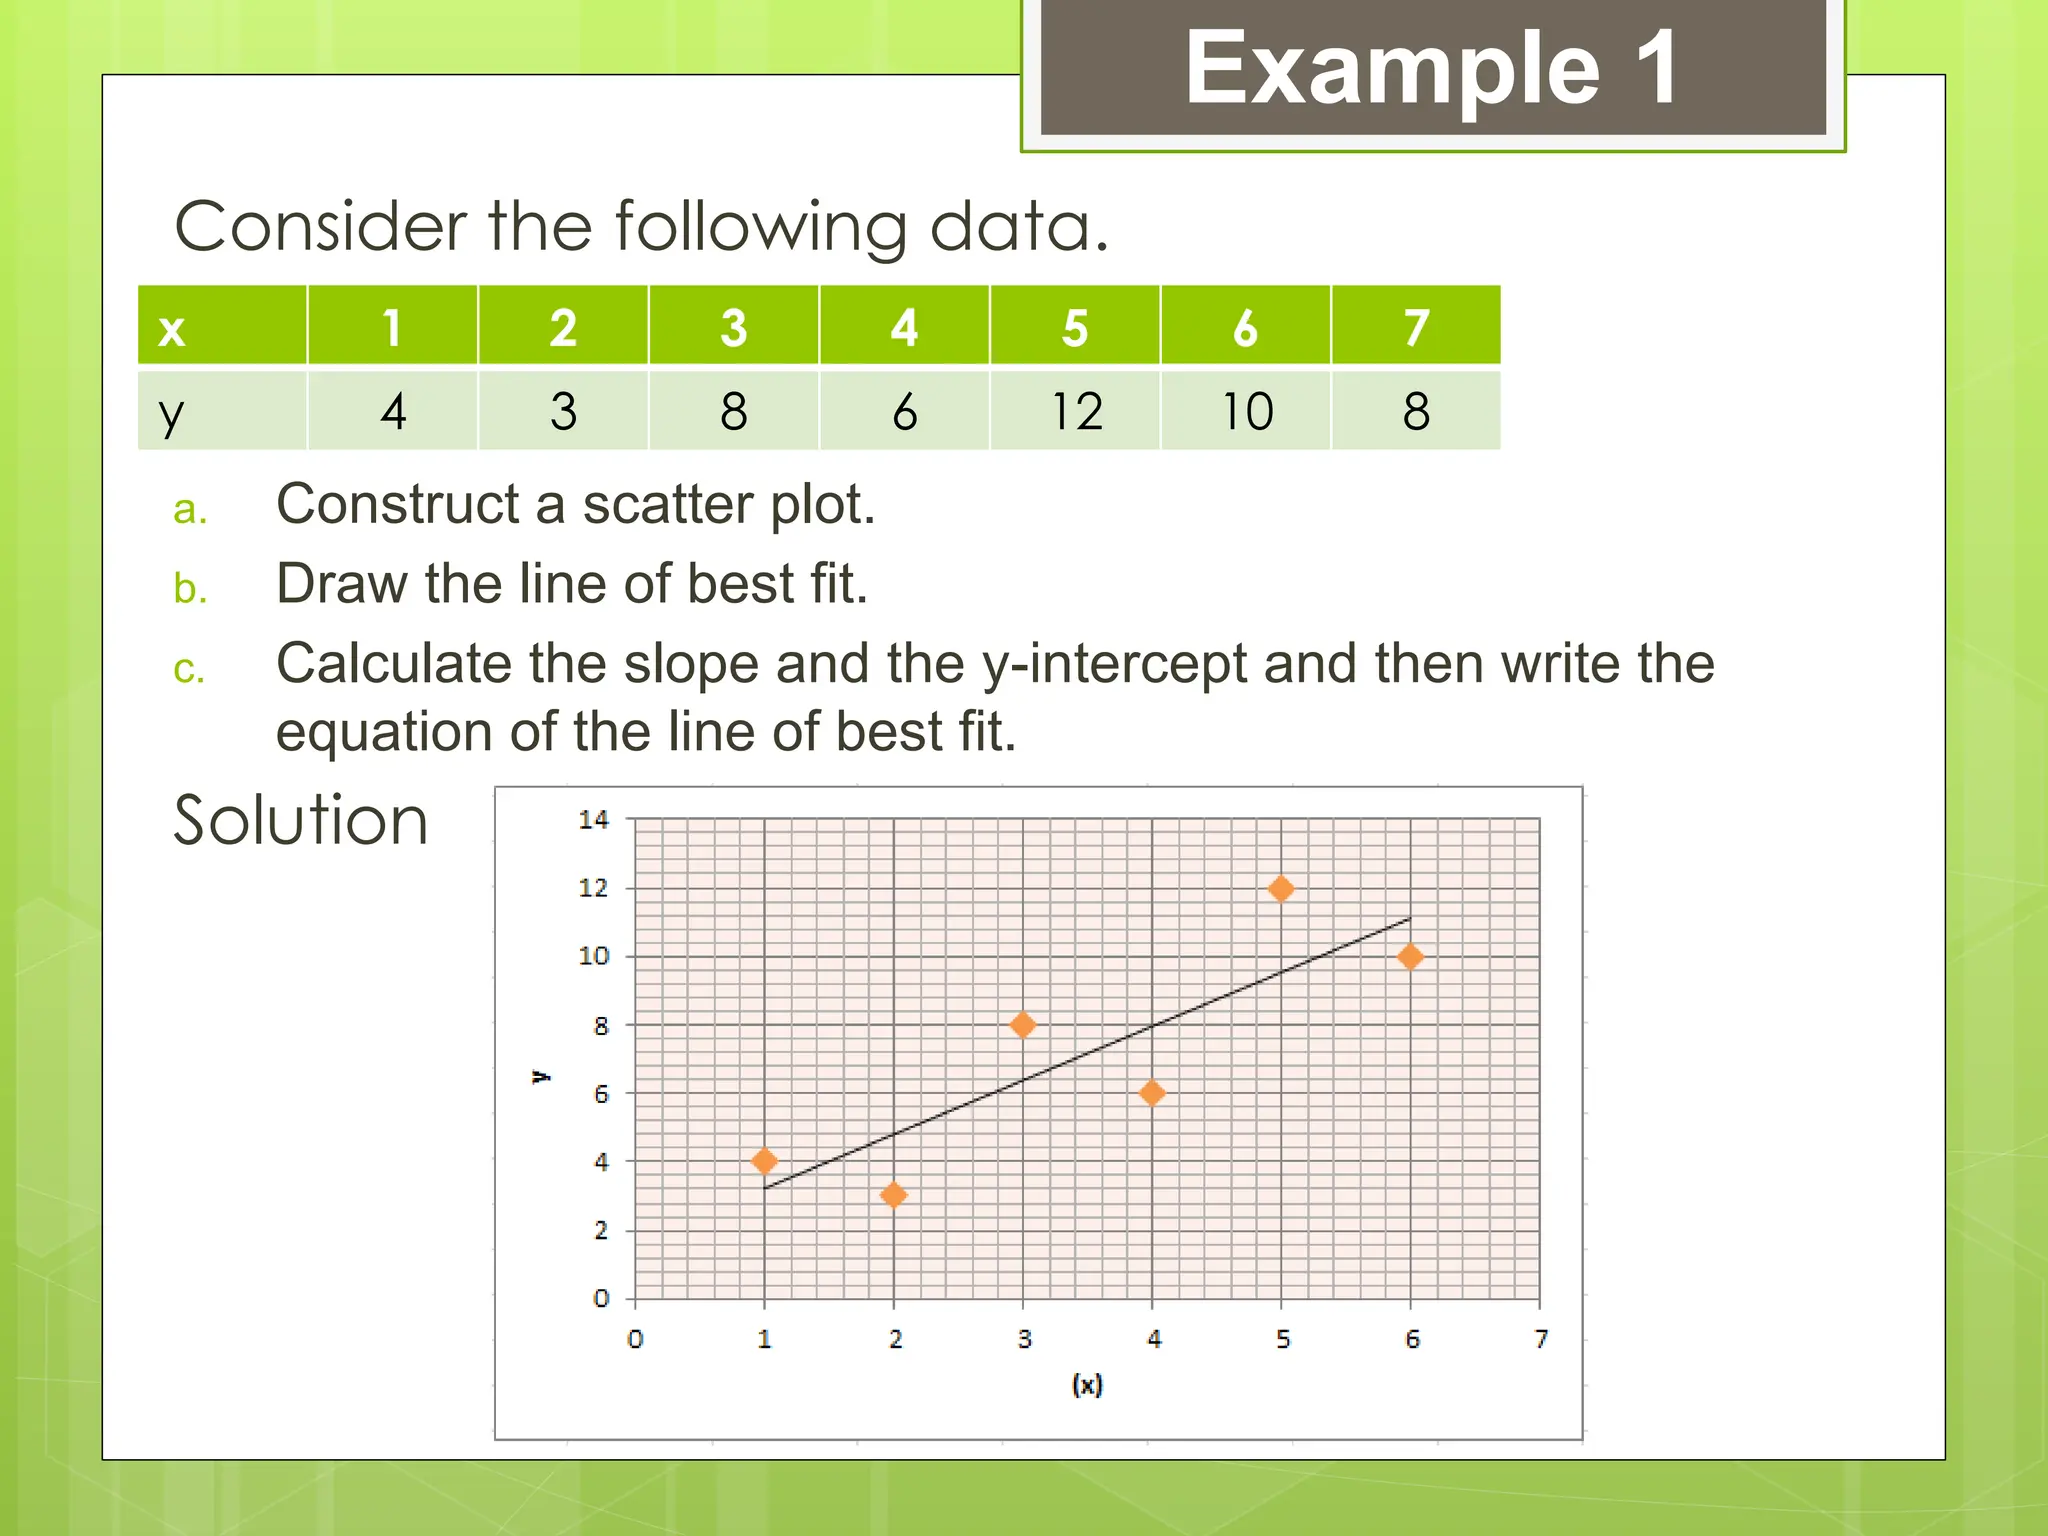
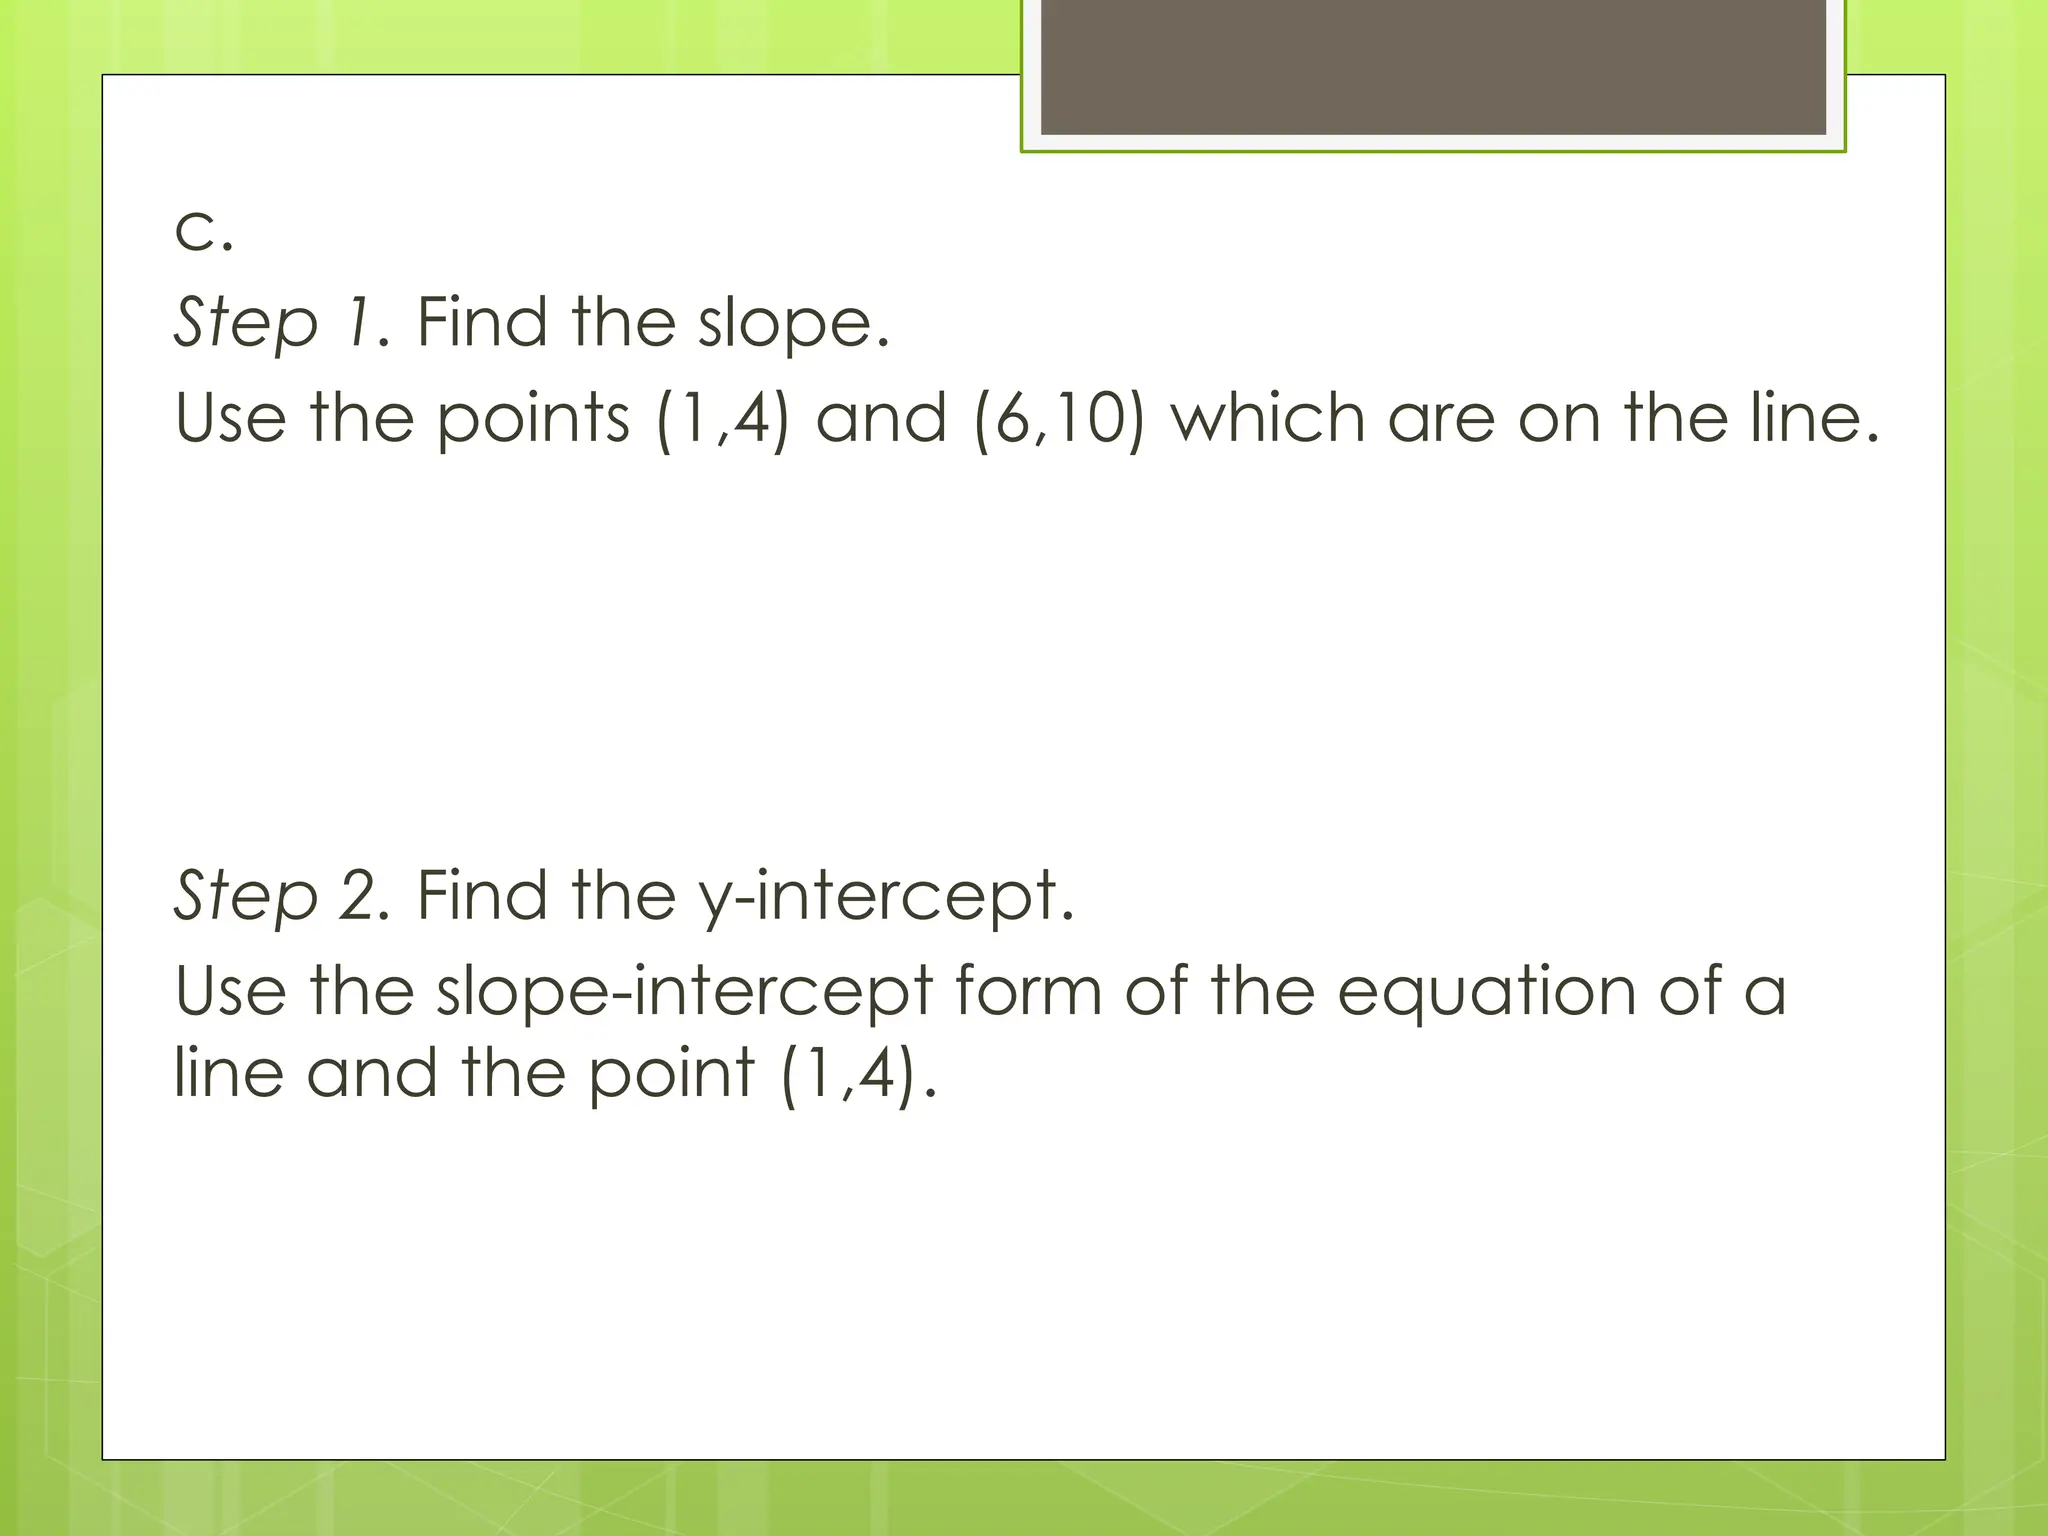
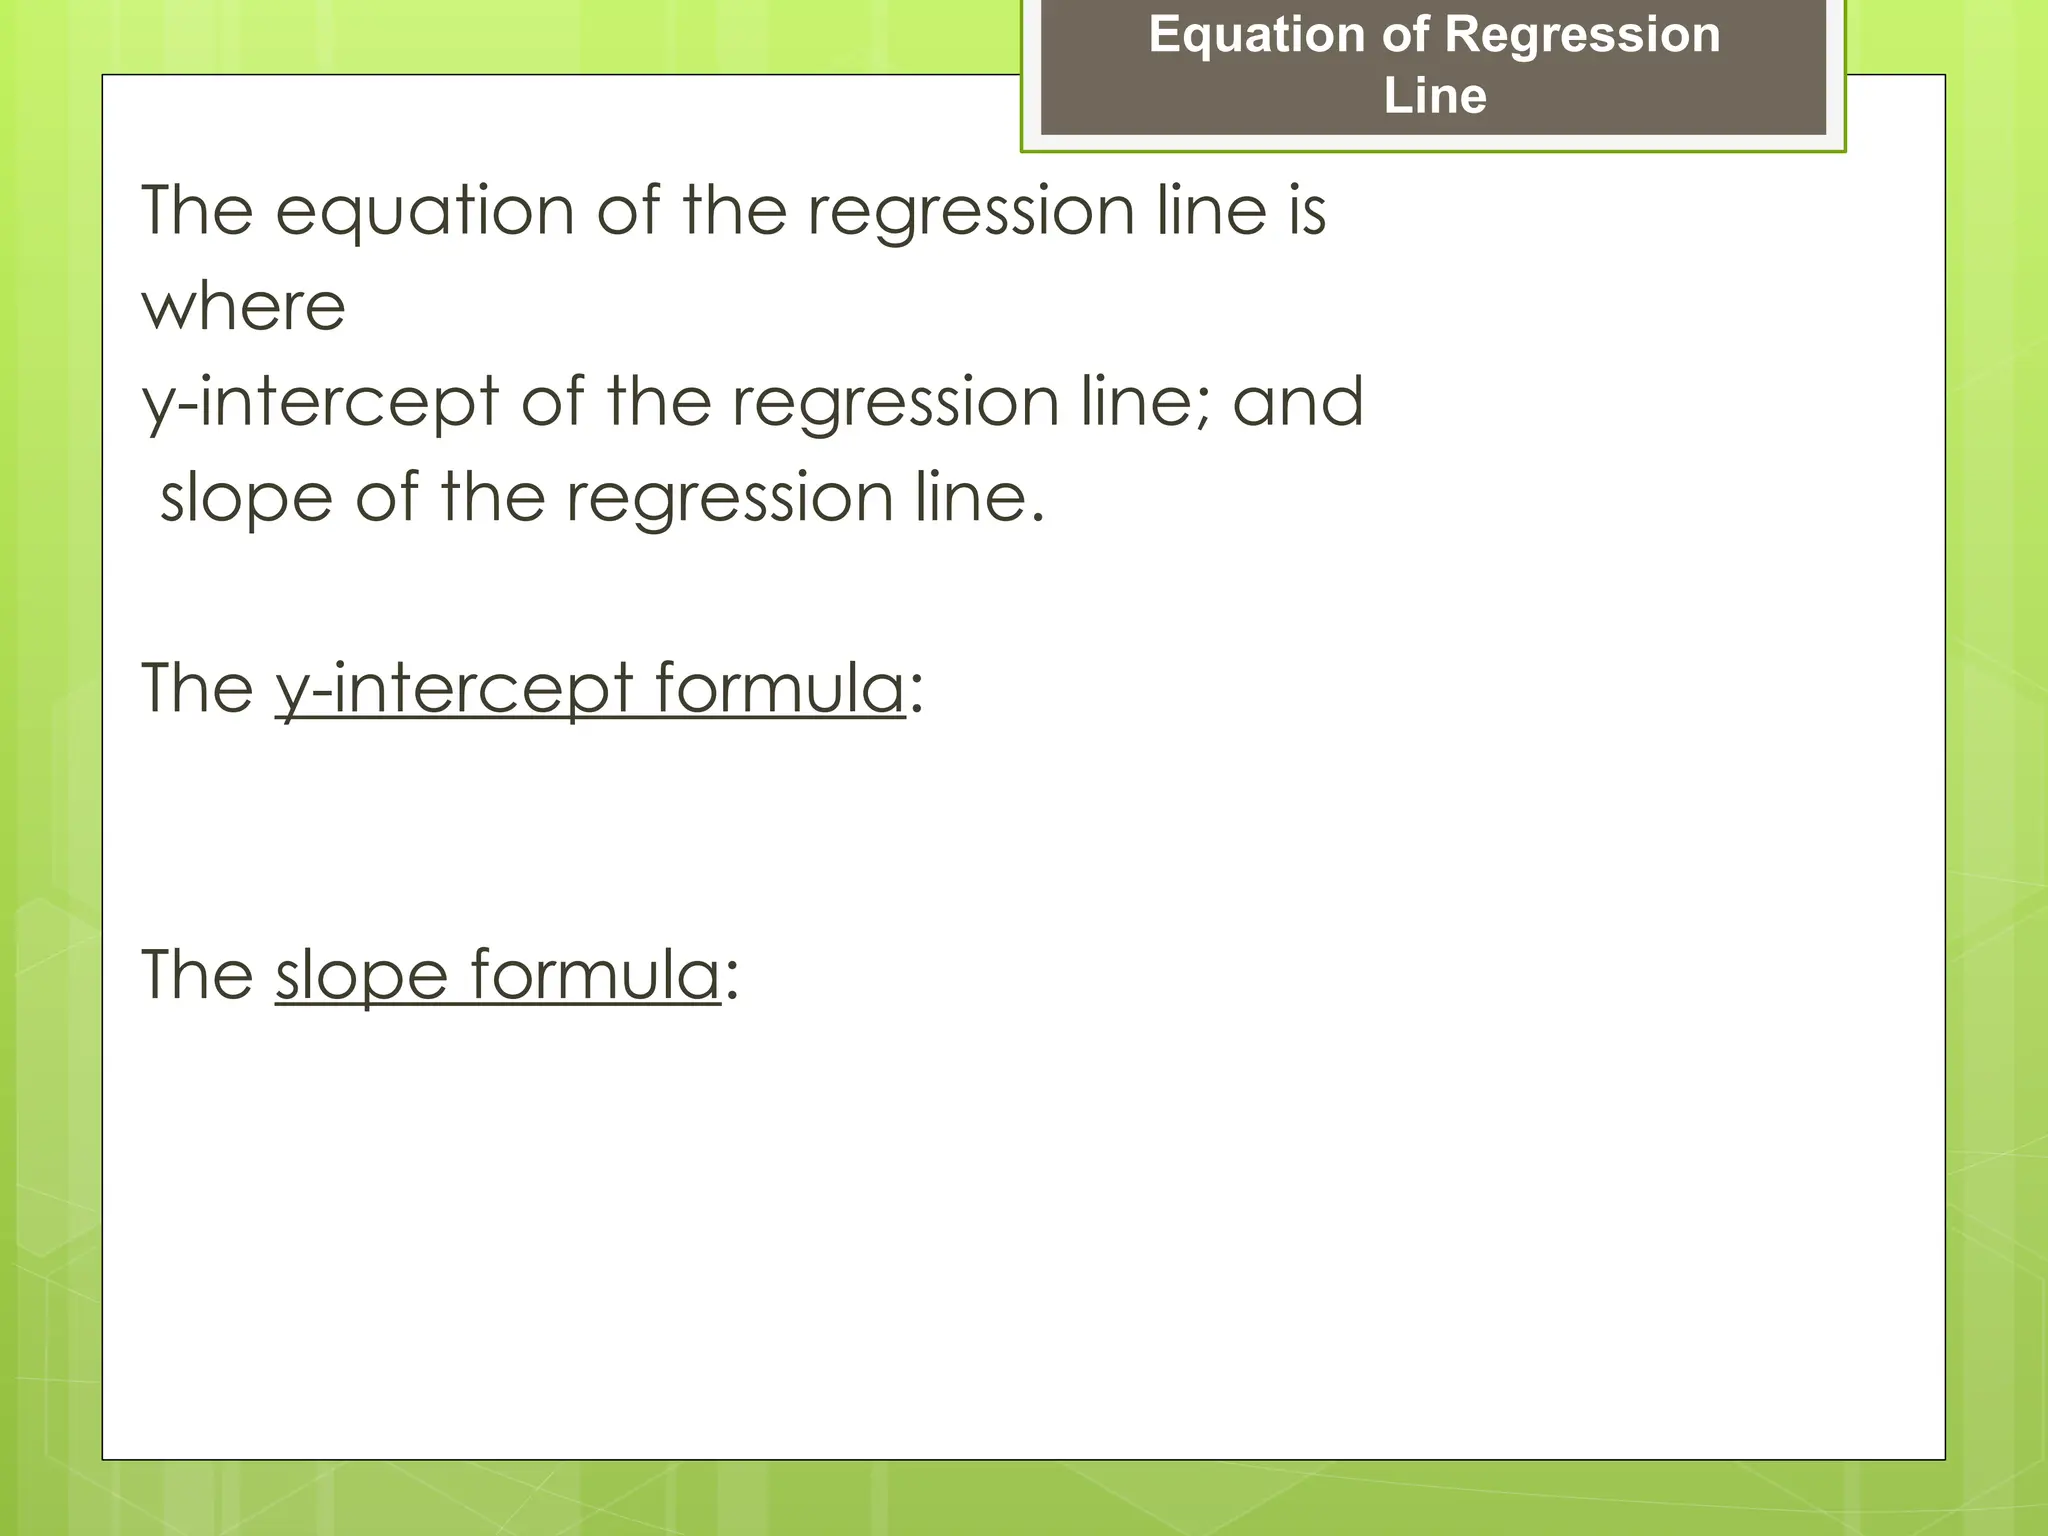
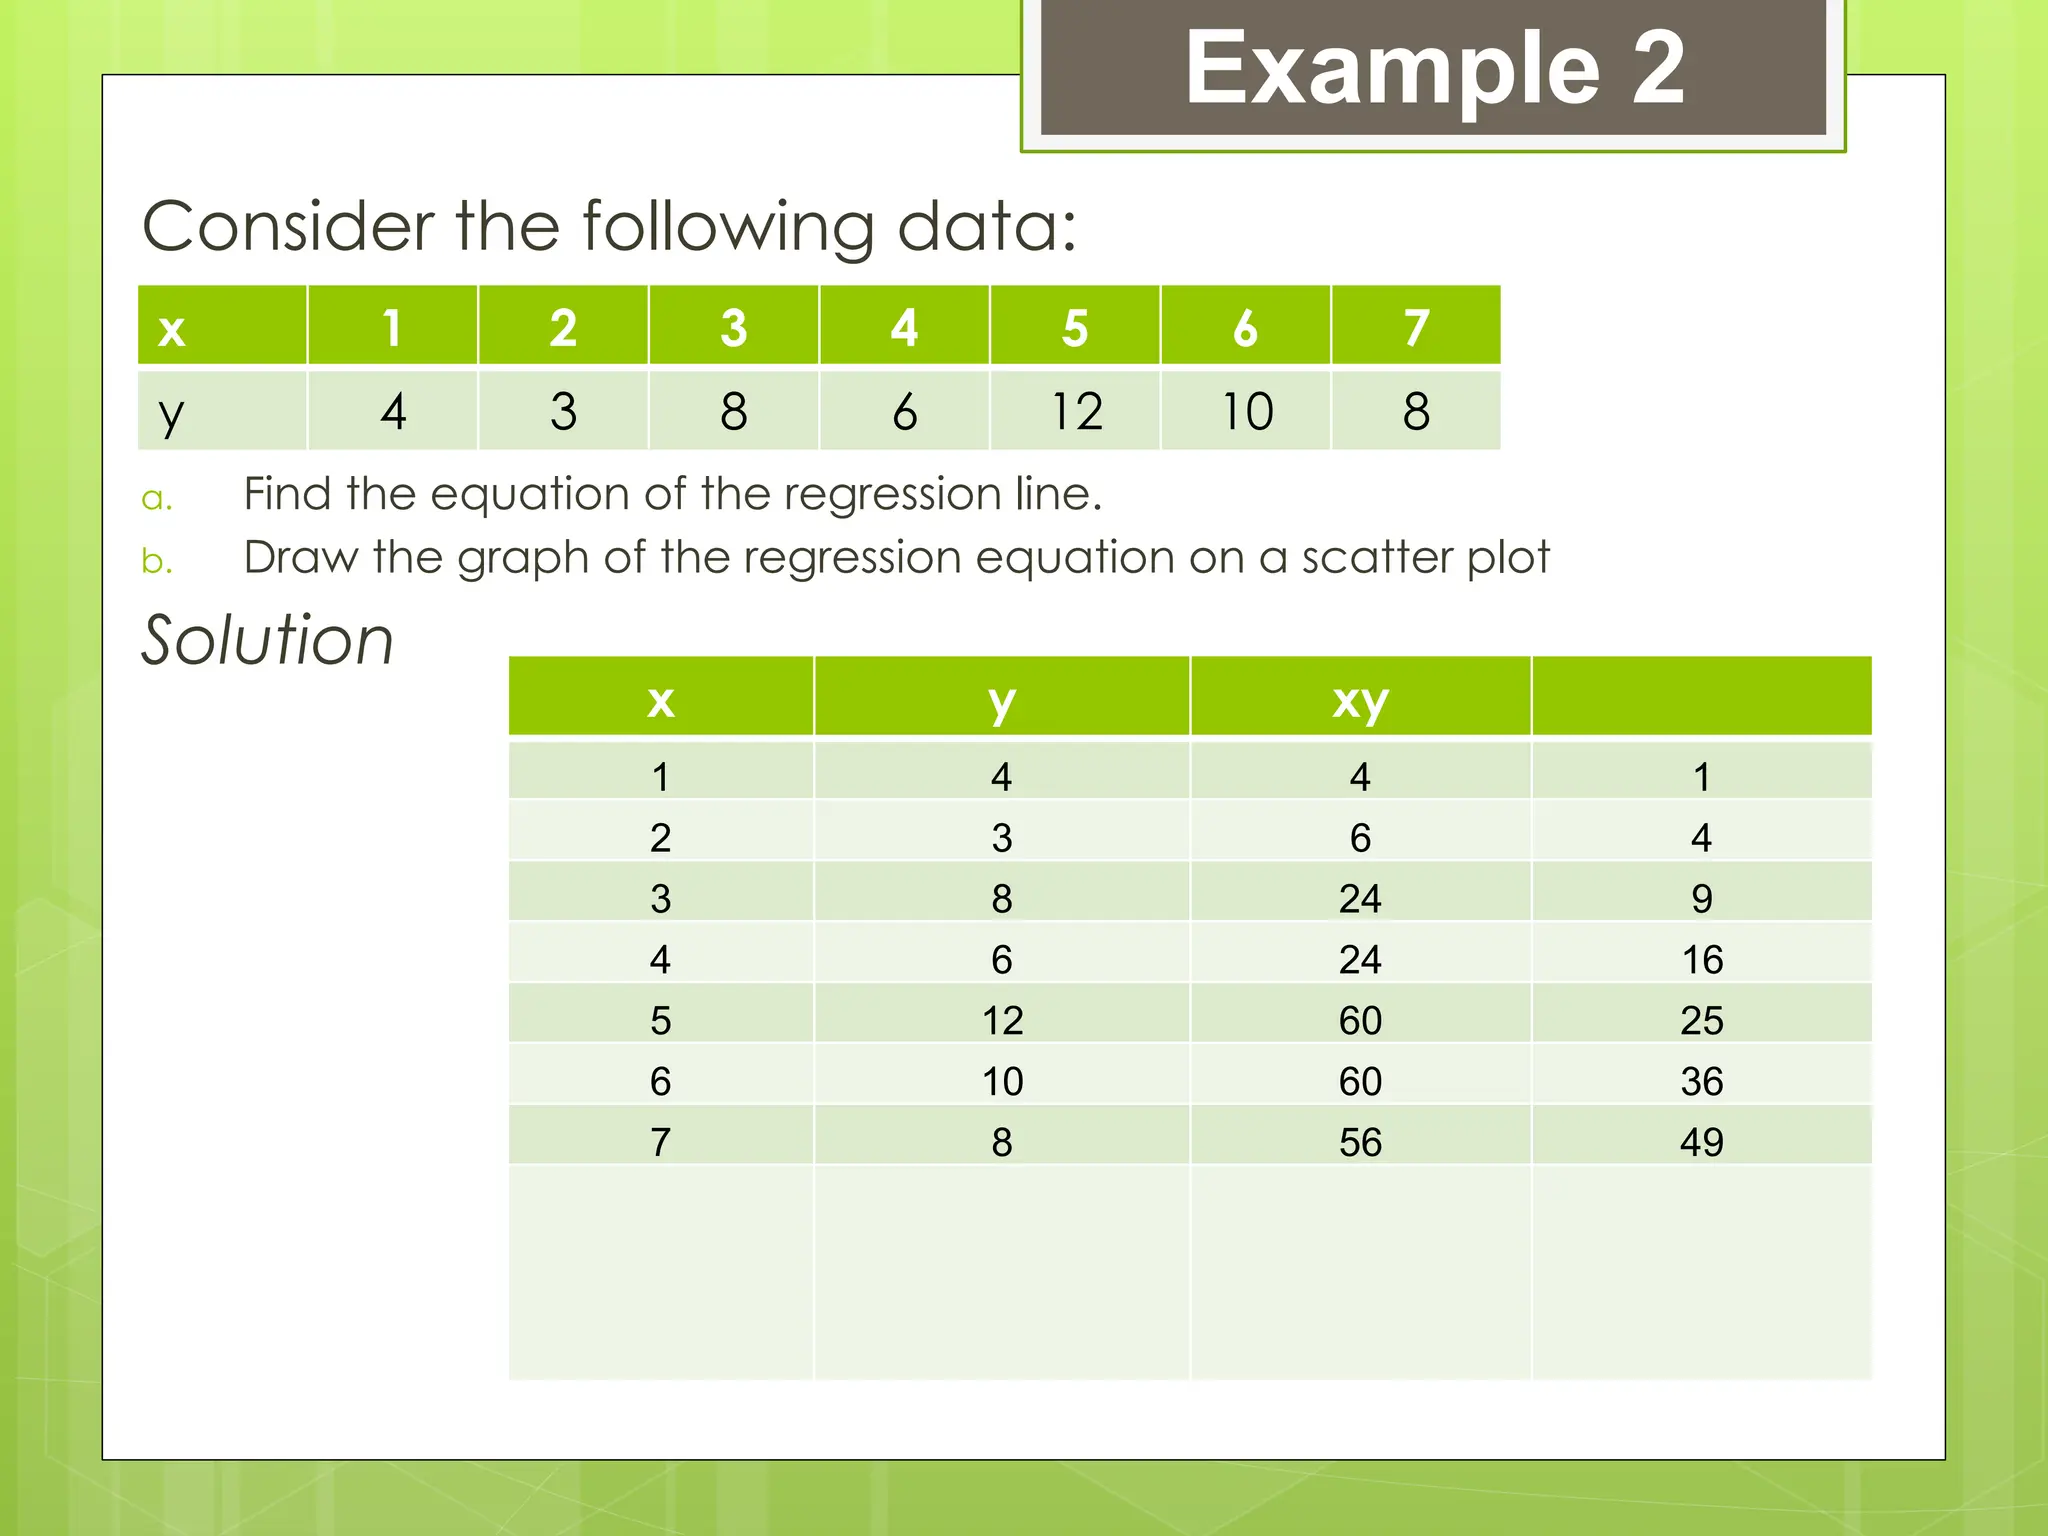
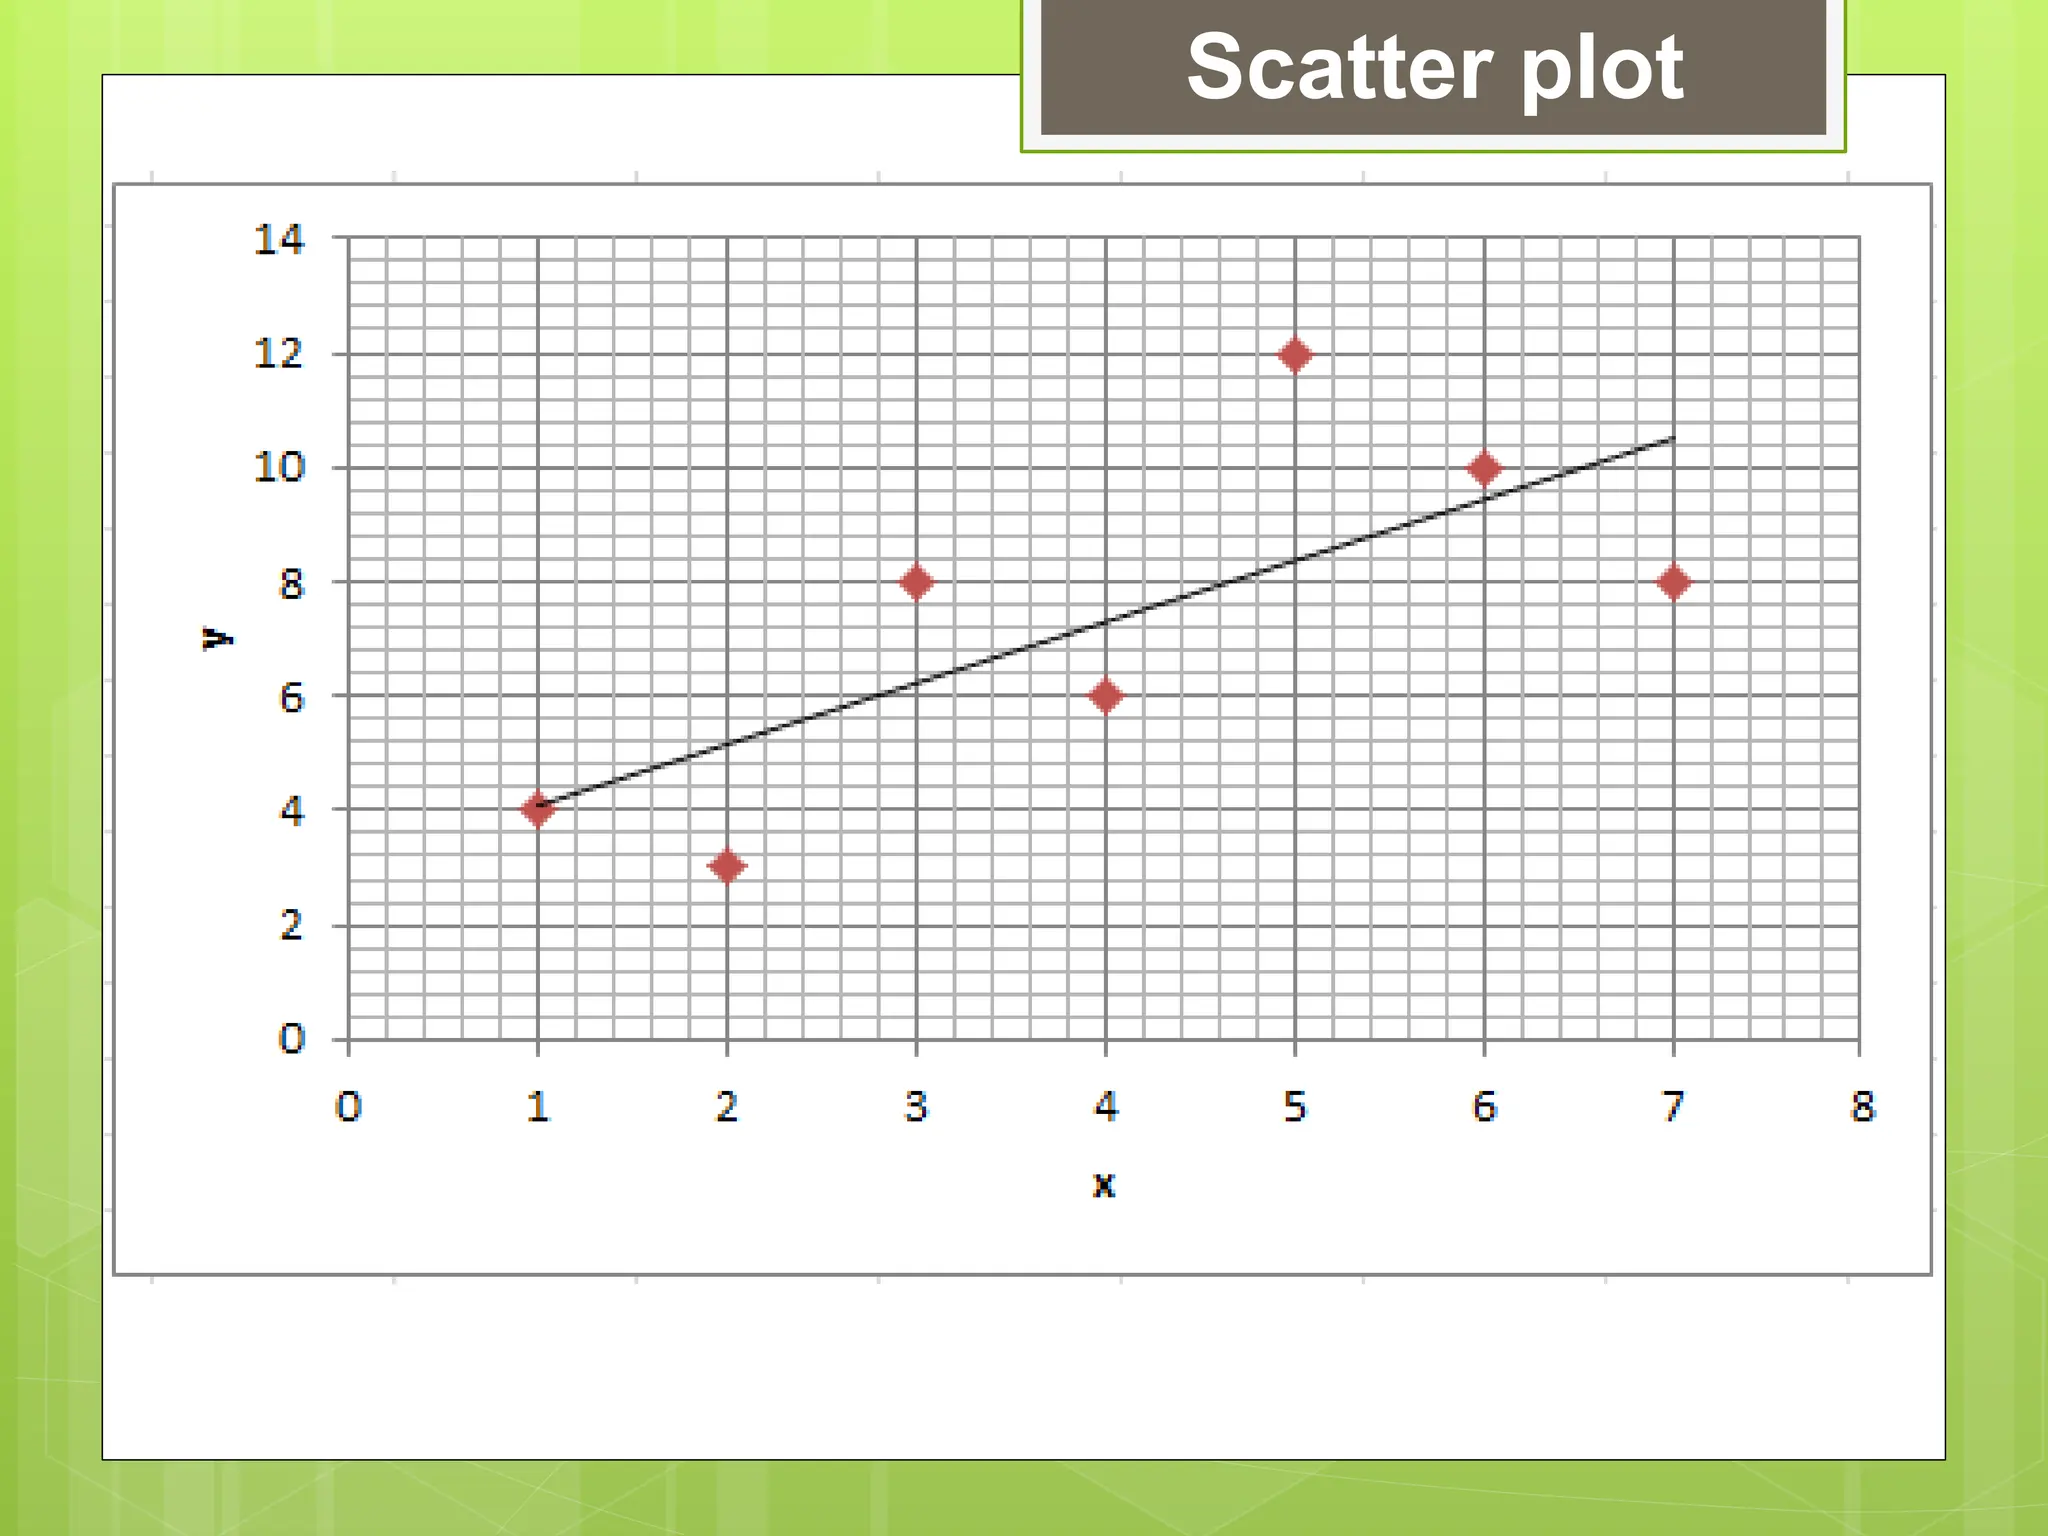
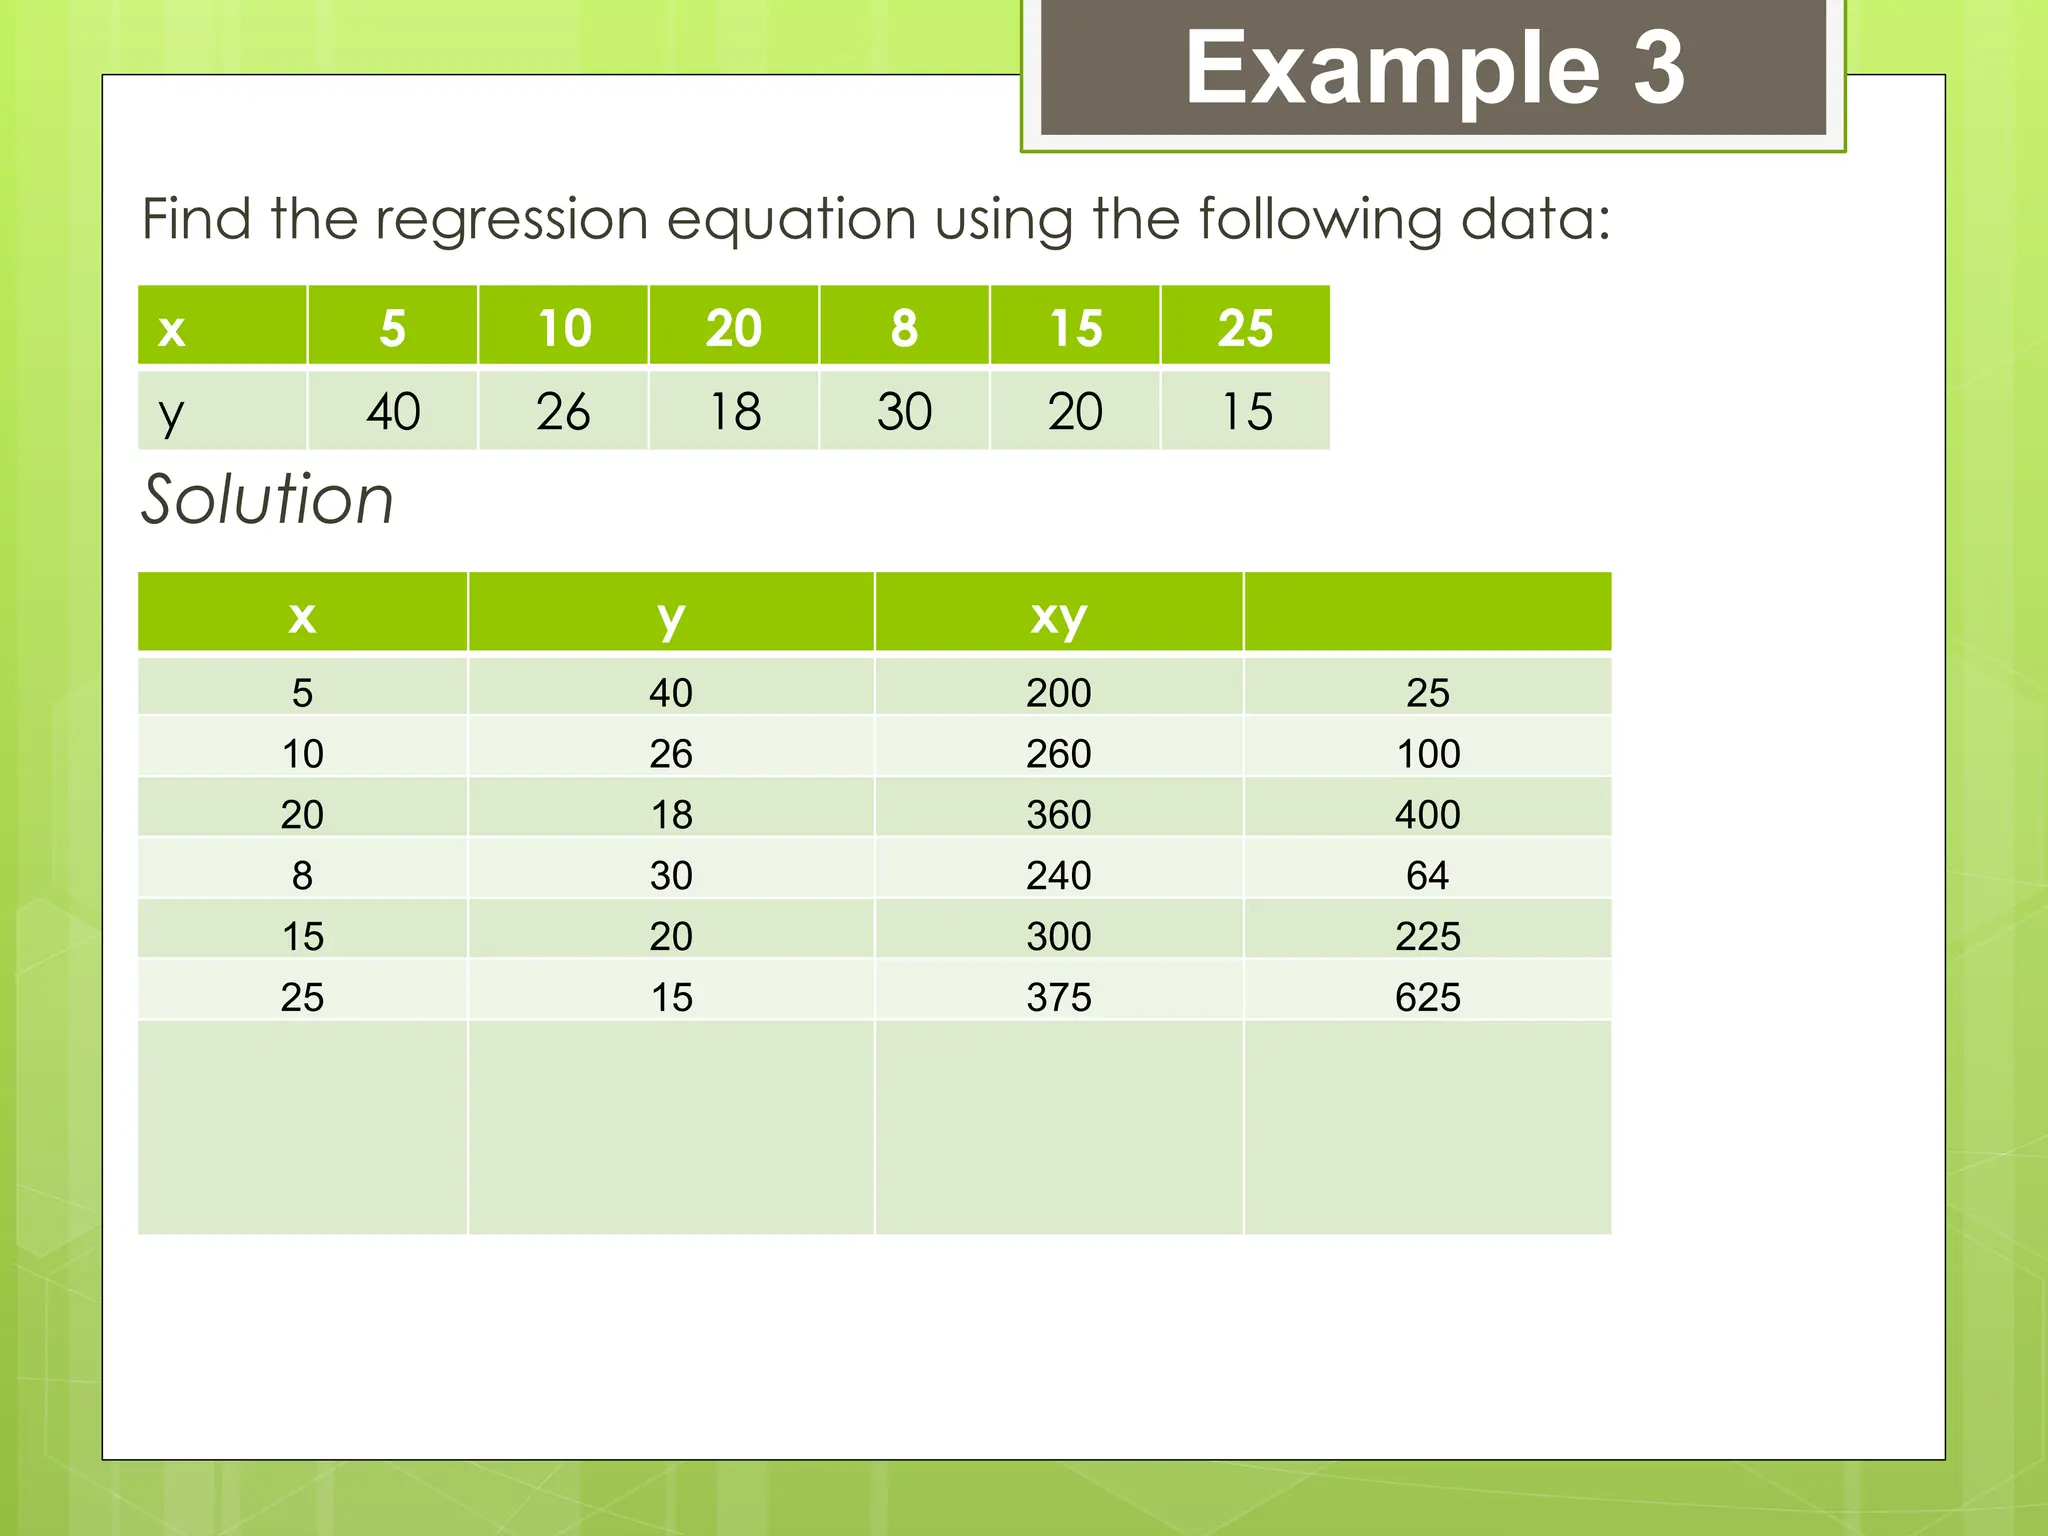
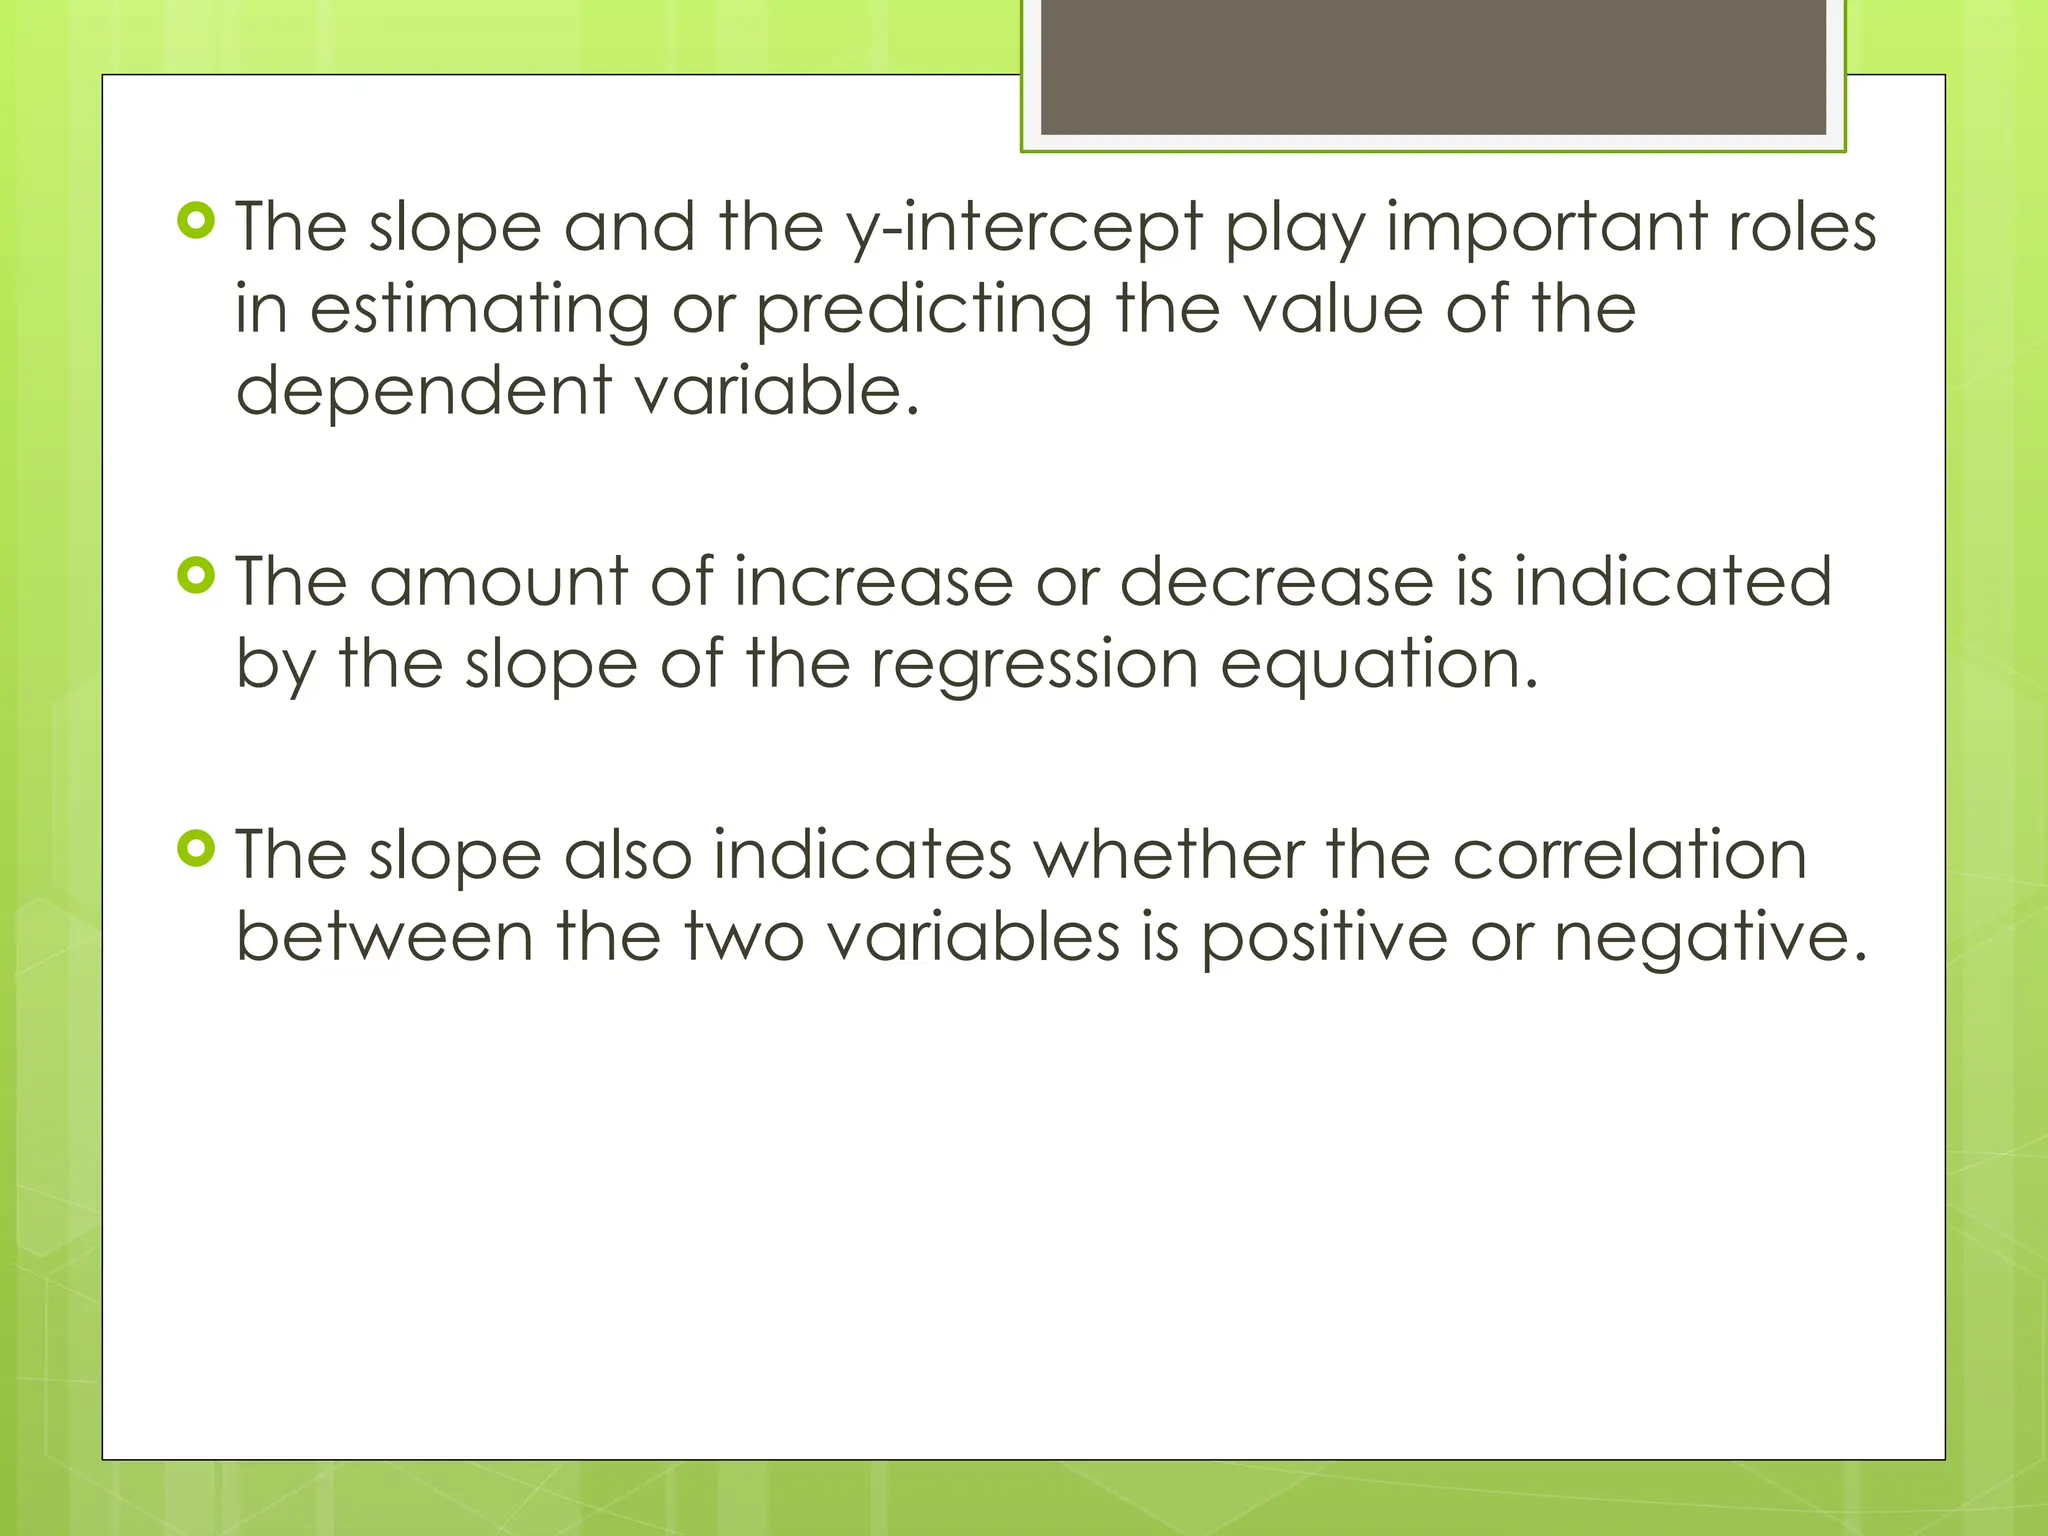
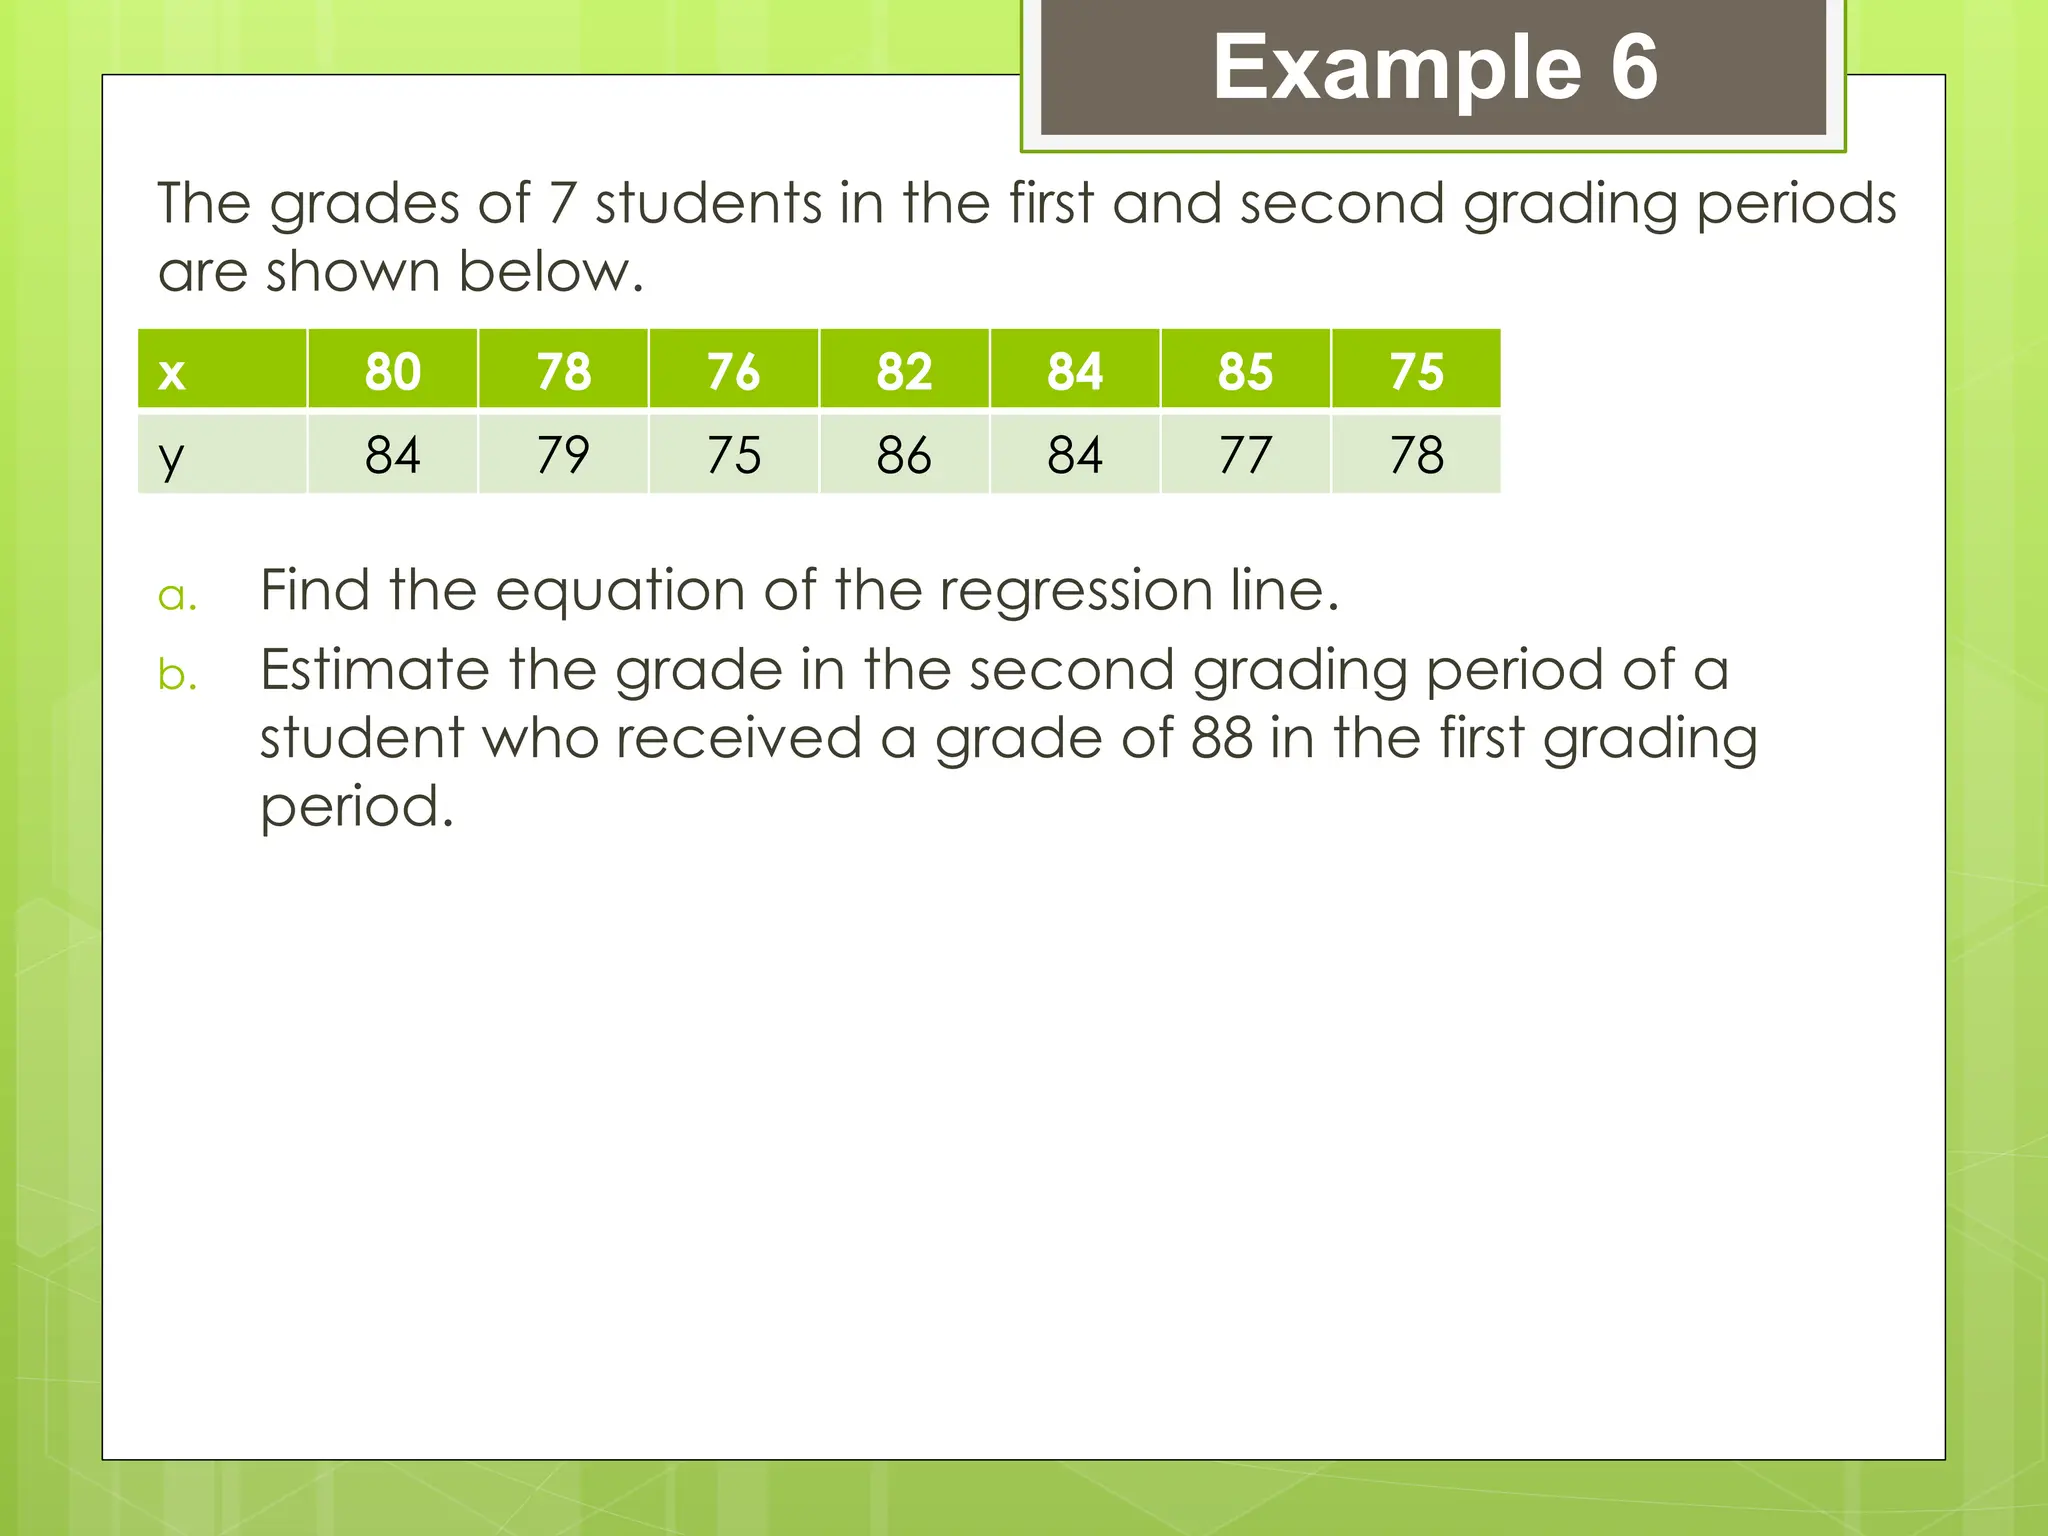
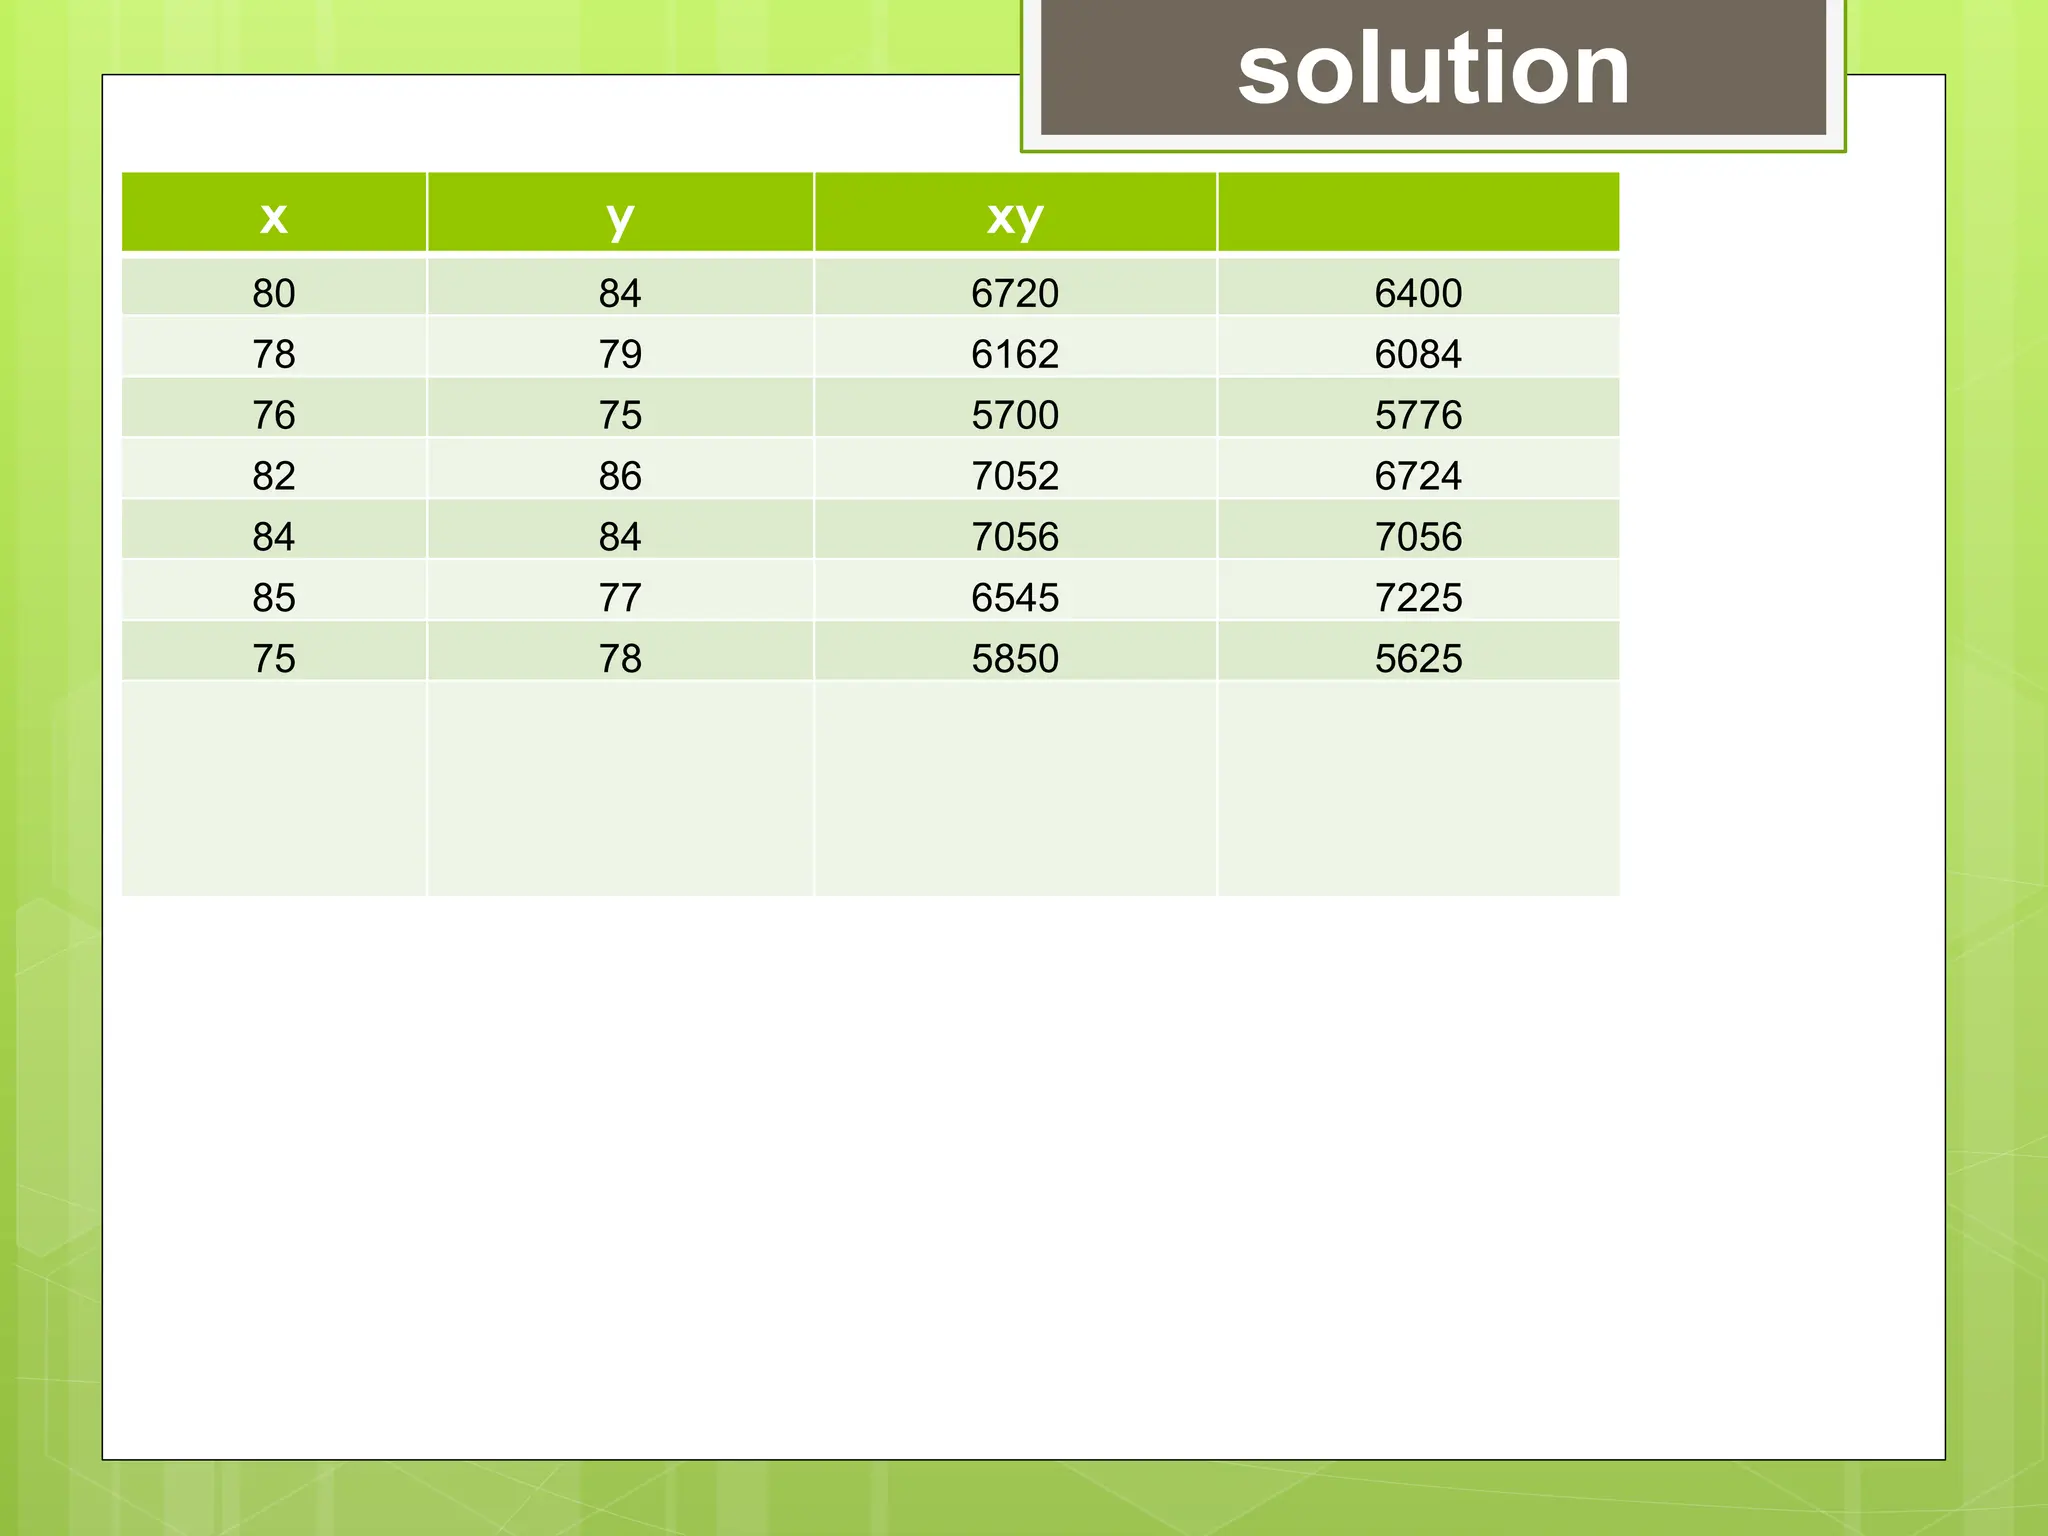
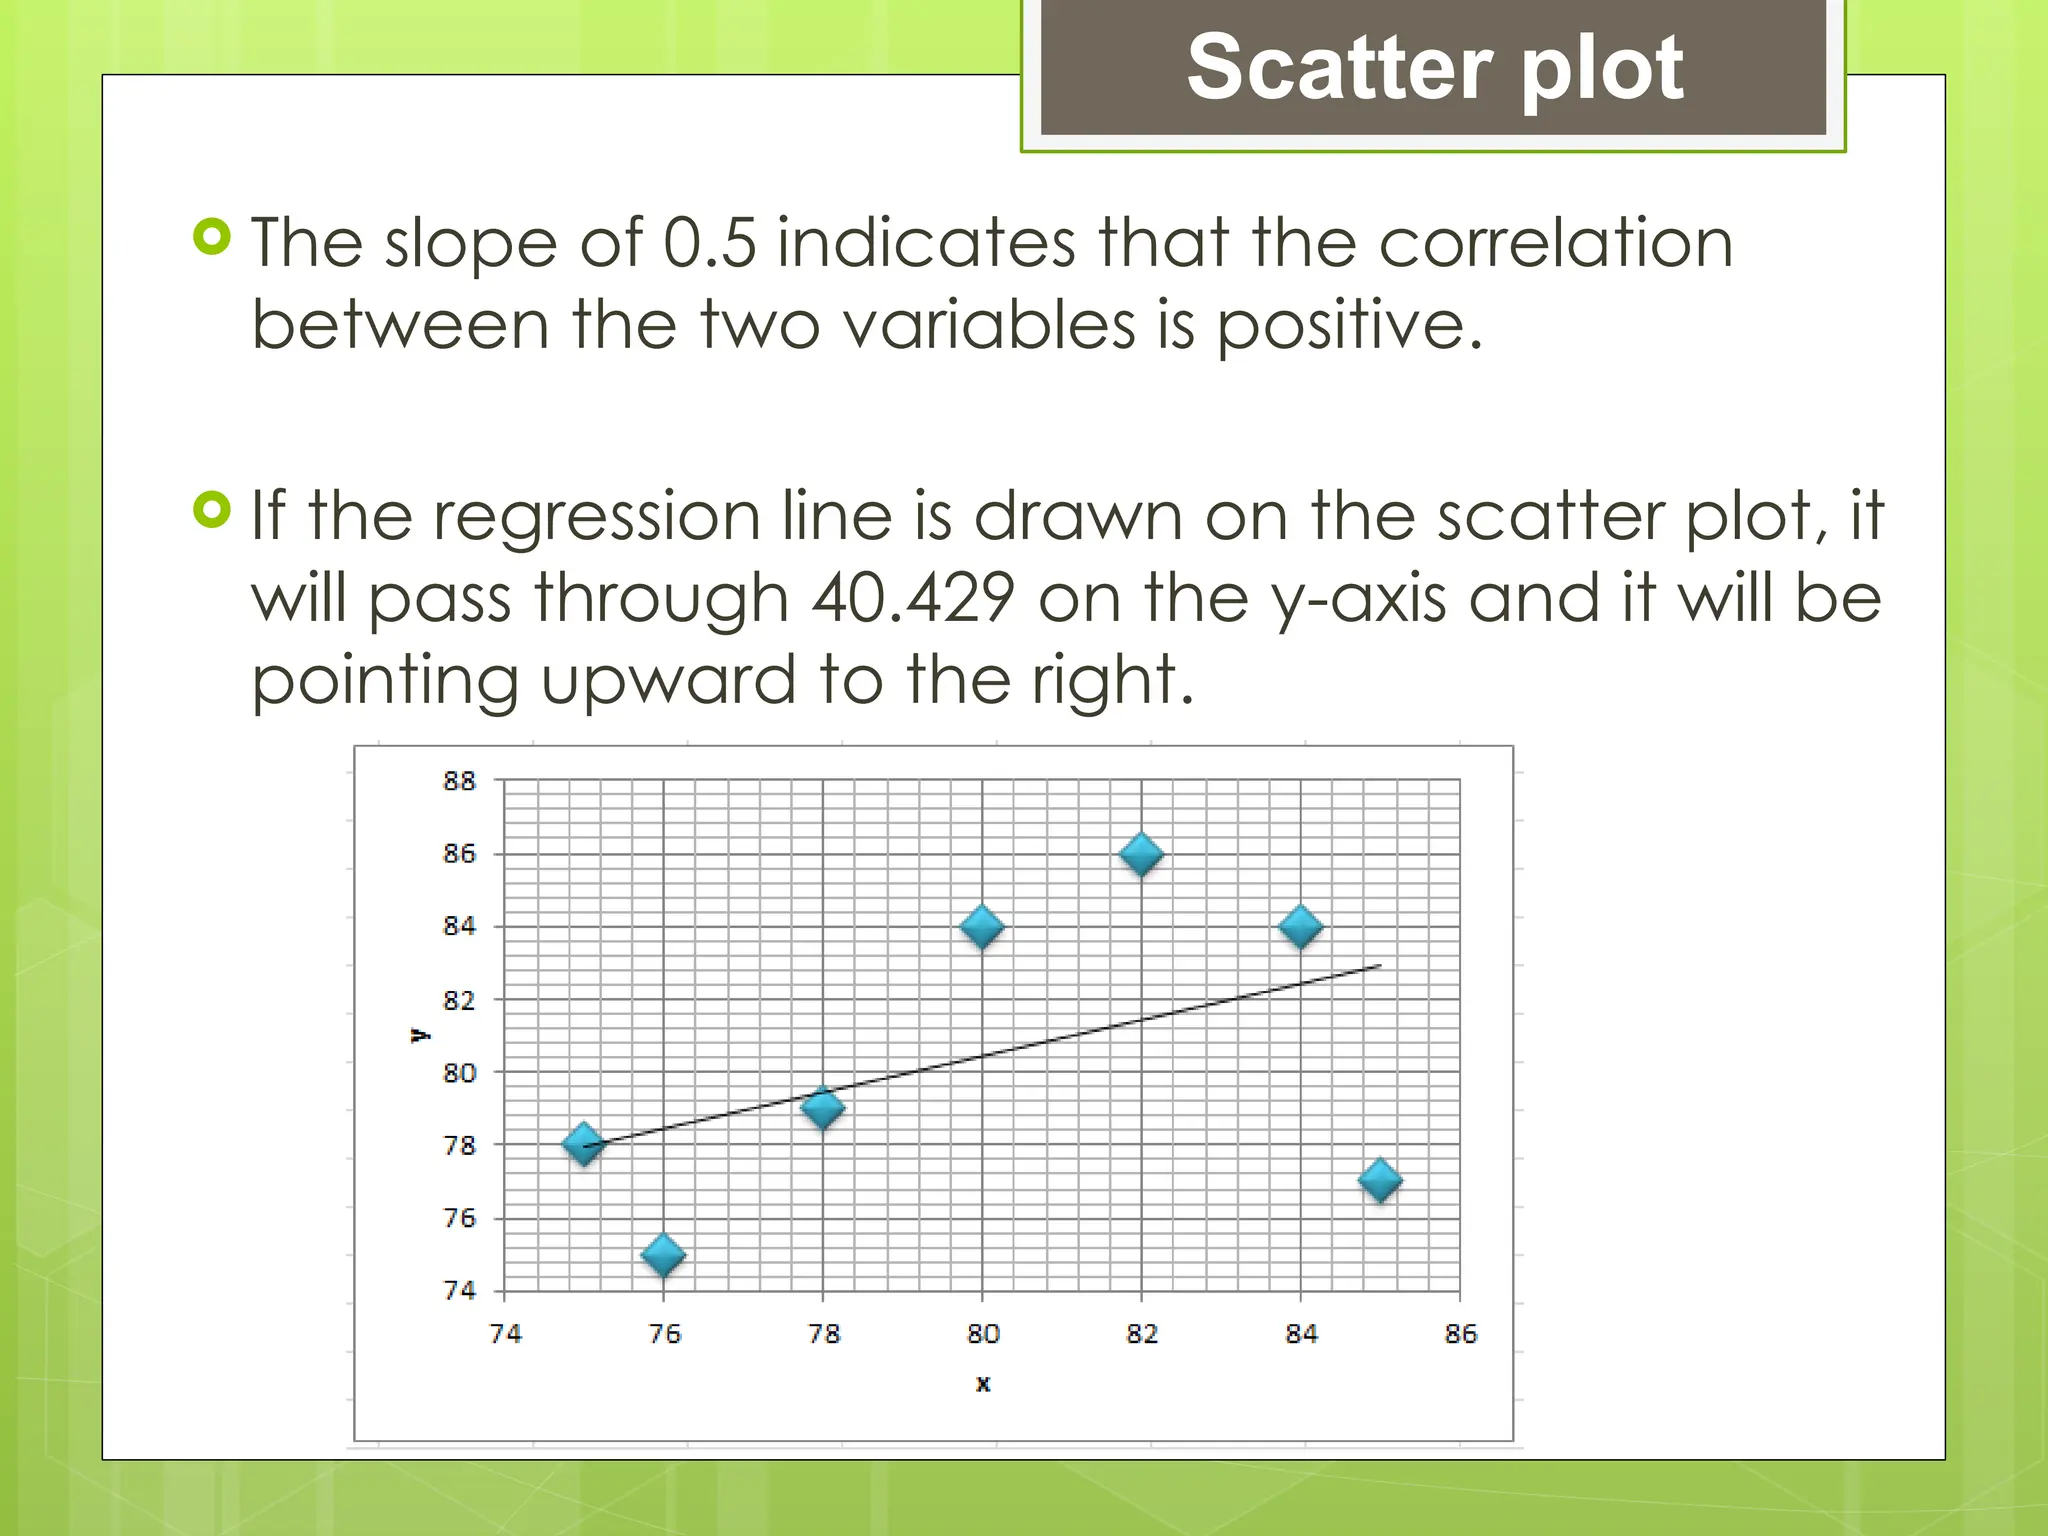
REGRESSION
ANALYSIS
Learning Competencies
The learner will be able to:
1. Identify the independent and dependent variable;
2. Draw the best fit line on a scatter plot;
3. Calculate the slope and the y-intercept of the
regression line;
4. Interpret the calculated slope and the y-intercept
of the regression line;
5. Predict the value of the dependent variable given
the value of the independent variable; and
6. Solve problems involving regression analysis.
 Independent variable
 Dependent variable
The straight line that best illustrates the trend
or direction that the data points seem to
follow is called the best-fit line or line of the
best fit.
Steps:
1. Draw the line
2. Calculate slope and y-intercept
3. Find the equation of the line
Bivariate data in Scatter
plot
Consider the following data.
a. Construct a scatter plot.
b. Draw the line of best fit.
c. Calculate the slope and the y-intercept and then write the
equation of the line of best fit.
Solution
Example 1
x 1 2 3 4 5 6 7
y 4 3 8 6 12 10 8
c.
Step 1. Find the slope.
Use the points (1,4) and (6,10) which are on the line.
Step 2. Find the y-intercept.
Use the slope-intercept form of the equation of a
line and the point (1,4).
Step 3. Write the equation of the line of best fit.
Substitute the value of m and the value of b
in .
The equation of the line best fit is
or if the slope and the y-intercept are rounded
to nearest integer.
 However, if another student will use two points other
than those used in the above computations, he would
obtain a different equation for the line of best fit.
 The above computation is preferred if there is a perfect
correlation between variables, or the points lie on a
straight line.
 However, if the points are scattered or not on a straight
line, there is a better way to find the equation of the line
of best fit. This equation is called the equation of the
regression line or simply regression equation.
The equation of the regression line is
where
y-intercept of the regression line; and
slope of the regression line.
The y-intercept formula:
The slope formula:
Equation of Regression
Line
Consider the following data:
a. Find the equation of the regression line.
b. Draw the graph of the regression equation on a scatter plot
Solution
Example 2
x 1 2 3 4 5 6 7
y 4 3 8 6 12 10 8
x y xy
1 4 4 1
2 3 6 4
3 8 24 9
4 6 24 16
5 12 60 25
6 10 60 36
7 8 56 49
The equation of the regression line is
Solving and
Scatter plot
Find the regression equation using the following data:
Solution
Example 3
x 5 10 20 8 15 25
y 40 26 18 30 20 15
x y xy
5 40 200 25
10 26 260 100
20 18 360 400
8 30 240 64
15 20 300 225
25 15 375 625
The equation of the regression line is
Solving and
Scatter plot
Shown below are the ages (x) and the systolic blood pressure
numbers (y) of 9 male patients in a certain hospital. Find the
regression equation.
Solution
Example 4
Age (x) 26 40 35 50 45 55 28 30 52
Systolic Blood
pressure number
110 140 120 145 130 150 150 125 142
solution
Patient x y xy
1 26 110 2860 676
2 40 140 5600 1600
3 35 120 4200 1225
4 50 145 7250 2500
5 45 130 5850 2025
6 55 150 8250 3025
7 28 150 4200 784
8 30 125 3750 900
9 52 142 7384 2704
The equation of the regression line is
Solving and
Scatter plot
Prediction and
Estimation
Using the Regression
Equation for
 The regression equation can be used to predict or estimate the
value of the dependent variable if the value of the independent
variable is given.
Consider the following data:
a. Find the equation of the regression line.
b. Draw the graph of the regression equation on the scatter
plot.
c. Estimate the value of if
Example 5
x 1 2 3 4 5 6 7
y 4 5 1 6 7 10 7
solution
x y xy
1 4 4 1
2 5 10 4
3 1 3 9
4 6 24 16
5 7 35 25
6 10 60 36
7 7 49 49
The equation of the regression line is
Solving and
Scatter plot
Estimating the Value of y
 The slope and the y-intercept play important roles
in estimating or predicting the value of the
dependent variable.
 The amount of increase or decrease is indicated
by the slope of the regression equation.
 The slope also indicates whether the correlation
between the two variables is positive or negative.
The grades of 7 students in the first and second grading periods
are shown below.
a. Find the equation of the regression line.
b. Estimate the grade in the second grading period of a
student who received a grade of 88 in the first grading
period.
Example 6
x 80 78 76 82 84 85 75
y 84 79 75 86 84 77 78
solution
x y xy
80 84 6720 6400
78 79 6162 6084
76 75 5700 5776
82 86 7052 6724
84 84 7056 7056
85 77 6545 7225
75 78 5850 5625
The equation of the regression line is
Solving and
Scatter plot
 The slope of 0.5 indicates that the correlation
between the two variables is positive.
 If the regression line is drawn on the scatter plot, it
will pass through 40.429 on the y-axis and it will be
pointing upward to the right.
Estimating the Value of y

Regression Anaysis.pptx understanding about

  • 1.
  • 2.
    Learning Competencies The learnerwill be able to: 1. Identify the independent and dependent variable; 2. Draw the best fit line on a scatter plot; 3. Calculate the slope and the y-intercept of the regression line; 4. Interpret the calculated slope and the y-intercept of the regression line; 5. Predict the value of the dependent variable given the value of the independent variable; and 6. Solve problems involving regression analysis.
  • 3.
     Independent variable Dependent variable The straight line that best illustrates the trend or direction that the data points seem to follow is called the best-fit line or line of the best fit. Steps: 1. Draw the line 2. Calculate slope and y-intercept 3. Find the equation of the line Bivariate data in Scatter plot
  • 4.
    Consider the followingdata. a. Construct a scatter plot. b. Draw the line of best fit. c. Calculate the slope and the y-intercept and then write the equation of the line of best fit. Solution Example 1 x 1 2 3 4 5 6 7 y 4 3 8 6 12 10 8
  • 5.
    c. Step 1. Findthe slope. Use the points (1,4) and (6,10) which are on the line. Step 2. Find the y-intercept. Use the slope-intercept form of the equation of a line and the point (1,4).
  • 6.
    Step 3. Writethe equation of the line of best fit. Substitute the value of m and the value of b in . The equation of the line best fit is or if the slope and the y-intercept are rounded to nearest integer.
  • 7.
     However, ifanother student will use two points other than those used in the above computations, he would obtain a different equation for the line of best fit.  The above computation is preferred if there is a perfect correlation between variables, or the points lie on a straight line.  However, if the points are scattered or not on a straight line, there is a better way to find the equation of the line of best fit. This equation is called the equation of the regression line or simply regression equation.
  • 8.
    The equation ofthe regression line is where y-intercept of the regression line; and slope of the regression line. The y-intercept formula: The slope formula: Equation of Regression Line
  • 9.
    Consider the followingdata: a. Find the equation of the regression line. b. Draw the graph of the regression equation on a scatter plot Solution Example 2 x 1 2 3 4 5 6 7 y 4 3 8 6 12 10 8 x y xy 1 4 4 1 2 3 6 4 3 8 24 9 4 6 24 16 5 12 60 25 6 10 60 36 7 8 56 49
  • 10.
    The equation ofthe regression line is Solving and
  • 11.
  • 12.
    Find the regressionequation using the following data: Solution Example 3 x 5 10 20 8 15 25 y 40 26 18 30 20 15 x y xy 5 40 200 25 10 26 260 100 20 18 360 400 8 30 240 64 15 20 300 225 25 15 375 625
  • 13.
    The equation ofthe regression line is Solving and
  • 14.
  • 15.
    Shown below arethe ages (x) and the systolic blood pressure numbers (y) of 9 male patients in a certain hospital. Find the regression equation. Solution Example 4 Age (x) 26 40 35 50 45 55 28 30 52 Systolic Blood pressure number 110 140 120 145 130 150 150 125 142
  • 16.
    solution Patient x yxy 1 26 110 2860 676 2 40 140 5600 1600 3 35 120 4200 1225 4 50 145 7250 2500 5 45 130 5850 2025 6 55 150 8250 3025 7 28 150 4200 784 8 30 125 3750 900 9 52 142 7384 2704
  • 17.
    The equation ofthe regression line is Solving and
  • 18.
  • 19.
    Prediction and Estimation Using theRegression Equation for
  • 20.
     The regressionequation can be used to predict or estimate the value of the dependent variable if the value of the independent variable is given.
  • 21.
    Consider the followingdata: a. Find the equation of the regression line. b. Draw the graph of the regression equation on the scatter plot. c. Estimate the value of if Example 5 x 1 2 3 4 5 6 7 y 4 5 1 6 7 10 7
  • 22.
    solution x y xy 14 4 1 2 5 10 4 3 1 3 9 4 6 24 16 5 7 35 25 6 10 60 36 7 7 49 49
  • 23.
    The equation ofthe regression line is Solving and
  • 24.
  • 25.
  • 26.
     The slopeand the y-intercept play important roles in estimating or predicting the value of the dependent variable.  The amount of increase or decrease is indicated by the slope of the regression equation.  The slope also indicates whether the correlation between the two variables is positive or negative.
  • 27.
    The grades of7 students in the first and second grading periods are shown below. a. Find the equation of the regression line. b. Estimate the grade in the second grading period of a student who received a grade of 88 in the first grading period. Example 6 x 80 78 76 82 84 85 75 y 84 79 75 86 84 77 78
  • 28.
    solution x y xy 8084 6720 6400 78 79 6162 6084 76 75 5700 5776 82 86 7052 6724 84 84 7056 7056 85 77 6545 7225 75 78 5850 5625
  • 29.
    The equation ofthe regression line is Solving and
  • 30.
    Scatter plot  Theslope of 0.5 indicates that the correlation between the two variables is positive.  If the regression line is drawn on the scatter plot, it will pass through 40.429 on the y-axis and it will be pointing upward to the right.
  • 31.