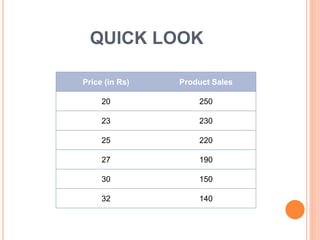
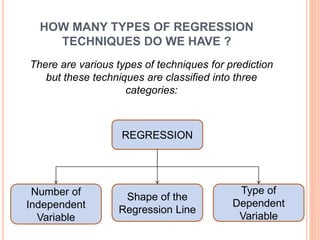
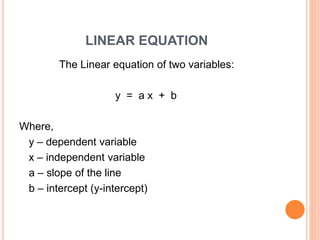
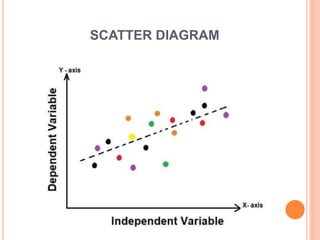
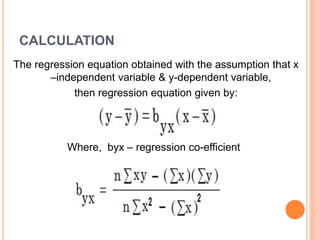
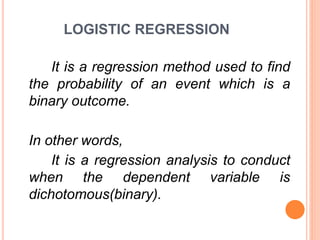
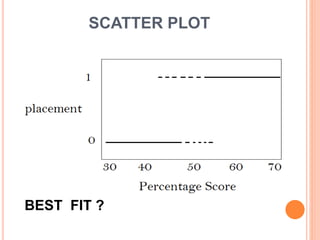
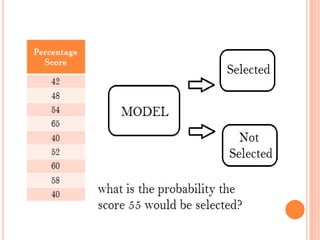
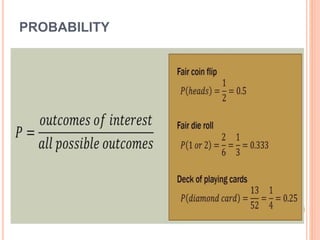
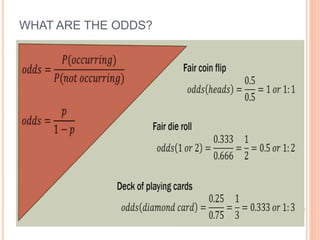
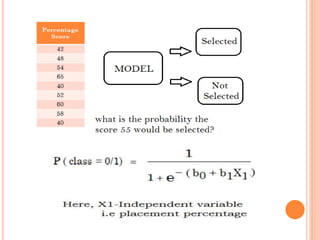
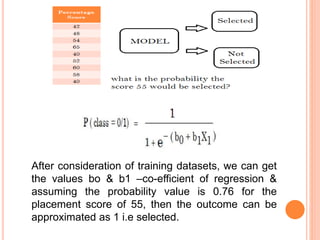
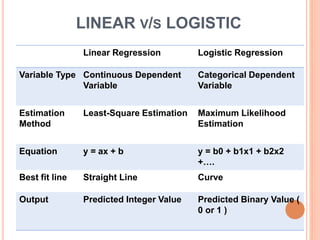
REGRESSION
ANALYSIS
Prof. Sachin.S.L
QUICK LOOK
Price (in Rs) Product Sales
20 250
23 230
25 220
27 190
30 150
32 140
REGRESSION
The property of the tendency
of the actual value to lie close
to the estimated value.
REGRESSION ANALYSIS
It is a predictive modeling technique
which investigates & estimates
the relationship between the variables.
In the Regression Analysis,
 The independent variable is known also as
Regressor/Predictor/Explanatory variable.
 The dependent variable is known also as
Regressed/Predicted/Explained variable
WHY WE USE
REGRESSION ANALYSIS?
The main theme is to estimate the relationship
between two or more variables.
The benefits of using regression analysis:
 It indicates the Significant Relationships between
dependent and independent variable.
 It indicates the Strength of Impact of multiple
independent variables on a dependent variable.
HOW MANY TYPES OF
REGRESSION TECHNIQUES
DO WE HAVE
?
HOW MANY TYPES OF REGRESSION
TECHNIQUES DO WE HAVE ?
There are various types of techniques for prediction
but these techniques are classified into three
categories:
Number of
Independent
Variable
Shape of the
Regression Line
Type of
Dependent
Variable
REGRESSION
LINEAR REGRESSION
 The simplest mathematical relationship between
two variables such as one being independent and
other dependent
 The least square linear regression is a method for
predicting the value of a dependent variable Y,
based on the value of an independent variable X
using the linear equation.
LINEAR EQUATION
The Linear equation of two variables:
y = a x + b
Where,
y – dependent variable
x – independent variable
a – slope of the line
b – intercept (y-intercept)
SCATTER DIAGRAM
CALCULATION
The regression equation obtained with the assumption that x
–independent variable & y-dependent variable,
then regression equation given by:
Where, byx – regression co-efficient
EXAMPLE ?
Reference to Excel Spreadsheet
LOGISTIC
REGRESSION
?
LOGISTIC REGRESSION
It is a regression method used to find
the probability of an event which is a
binary outcome.
In other words,
It is a regression analysis to conduct
when the dependent variable is
dichotomous(binary).
EXAMPLE
How does the probability of placement
(Selected / Not-selected) change for
every additional percentage score in
examination?
Do change in body fat intake & age
have an influence on the probability of
having a heart attack (Yes / No)?
MAJOR ASSUMPTIONS &
UNDERSTANDINGS
 The dependent variable should be dichotomous in
nature (Ex: Pass/Fail, Present/Absent)
 There should be no high correlations (multi-
colinearity) among the predictors(independent
variables).
 It requires large sample size because maximum
likelihood estimates are less powerful at low
sample sizes.
 The regression doesn’t require linear relationship
between dependent and independent variables.
RANGE, ODDS & LOGIT FUNCTION
Here the value of Y-dependent variable ranges from
0 to 1 and it can be represented by following
equation
PLACEMENT DATA
Percentage
Score
Placement
(0-Not Selected
1-Selected)
42 0
48 1
54 1
65 1
40 0
52 0
60 1
58 1
40 0
SCATTER PLOT
BEST FIT ?
PROBABILITY
WHAT ARE THE ODDS?
ODDS RATIO
BRING BERNOULLI
PREDICTIVE EQUATION
After consideration of training datasets, we can get
the values bo & b1 –co-efficient of regression &
assuming the probability value is 0.76 for the
placement score of 55, then the outcome can be
approximated as 1 i.e selected.
LINEAR V/S LOGISTIC
Linear Regression Logistic Regression
Variable Type Continuous Dependent
Variable
Categorical Dependent
Variable
Estimation
Method
Least-Square Estimation Maximum Likelihood
Estimation
Equation y = ax + b y = b0 + b1x1 + b2x2
+….
Best fit line Straight Line Curve
Output Predicted Integer Value Predicted Binary Value (
0 or 1 )
THANK YOU

Regression analysis

  • 1.
  • 2.
    QUICK LOOK Price (inRs) Product Sales 20 250 23 230 25 220 27 190 30 150 32 140
  • 3.
    REGRESSION The property ofthe tendency of the actual value to lie close to the estimated value.
  • 4.
    REGRESSION ANALYSIS It isa predictive modeling technique which investigates & estimates the relationship between the variables. In the Regression Analysis,  The independent variable is known also as Regressor/Predictor/Explanatory variable.  The dependent variable is known also as Regressed/Predicted/Explained variable
  • 5.
    WHY WE USE REGRESSIONANALYSIS? The main theme is to estimate the relationship between two or more variables. The benefits of using regression analysis:  It indicates the Significant Relationships between dependent and independent variable.  It indicates the Strength of Impact of multiple independent variables on a dependent variable.
  • 6.
    HOW MANY TYPESOF REGRESSION TECHNIQUES DO WE HAVE ?
  • 7.
    HOW MANY TYPESOF REGRESSION TECHNIQUES DO WE HAVE ? There are various types of techniques for prediction but these techniques are classified into three categories: Number of Independent Variable Shape of the Regression Line Type of Dependent Variable REGRESSION
  • 8.
    LINEAR REGRESSION  Thesimplest mathematical relationship between two variables such as one being independent and other dependent  The least square linear regression is a method for predicting the value of a dependent variable Y, based on the value of an independent variable X using the linear equation.
  • 9.
    LINEAR EQUATION The Linearequation of two variables: y = a x + b Where, y – dependent variable x – independent variable a – slope of the line b – intercept (y-intercept)
  • 10.
  • 11.
    CALCULATION The regression equationobtained with the assumption that x –independent variable & y-dependent variable, then regression equation given by: Where, byx – regression co-efficient
  • 12.
    EXAMPLE ? Reference toExcel Spreadsheet
  • 13.
  • 14.
    LOGISTIC REGRESSION It isa regression method used to find the probability of an event which is a binary outcome. In other words, It is a regression analysis to conduct when the dependent variable is dichotomous(binary).
  • 15.
    EXAMPLE How does theprobability of placement (Selected / Not-selected) change for every additional percentage score in examination? Do change in body fat intake & age have an influence on the probability of having a heart attack (Yes / No)?
  • 16.
    MAJOR ASSUMPTIONS & UNDERSTANDINGS The dependent variable should be dichotomous in nature (Ex: Pass/Fail, Present/Absent)  There should be no high correlations (multi- colinearity) among the predictors(independent variables).  It requires large sample size because maximum likelihood estimates are less powerful at low sample sizes.  The regression doesn’t require linear relationship between dependent and independent variables.
  • 17.
    RANGE, ODDS &LOGIT FUNCTION Here the value of Y-dependent variable ranges from 0 to 1 and it can be represented by following equation
  • 18.
  • 19.
  • 21.
  • 22.
  • 23.
  • 24.
  • 26.
  • 28.
    After consideration oftraining datasets, we can get the values bo & b1 –co-efficient of regression & assuming the probability value is 0.76 for the placement score of 55, then the outcome can be approximated as 1 i.e selected.
  • 29.
    LINEAR V/S LOGISTIC LinearRegression Logistic Regression Variable Type Continuous Dependent Variable Categorical Dependent Variable Estimation Method Least-Square Estimation Maximum Likelihood Estimation Equation y = ax + b y = b0 + b1x1 + b2x2 +…. Best fit line Straight Line Curve Output Predicted Integer Value Predicted Binary Value ( 0 or 1 )
  • 30.