Downloaded 12 times
![The Index
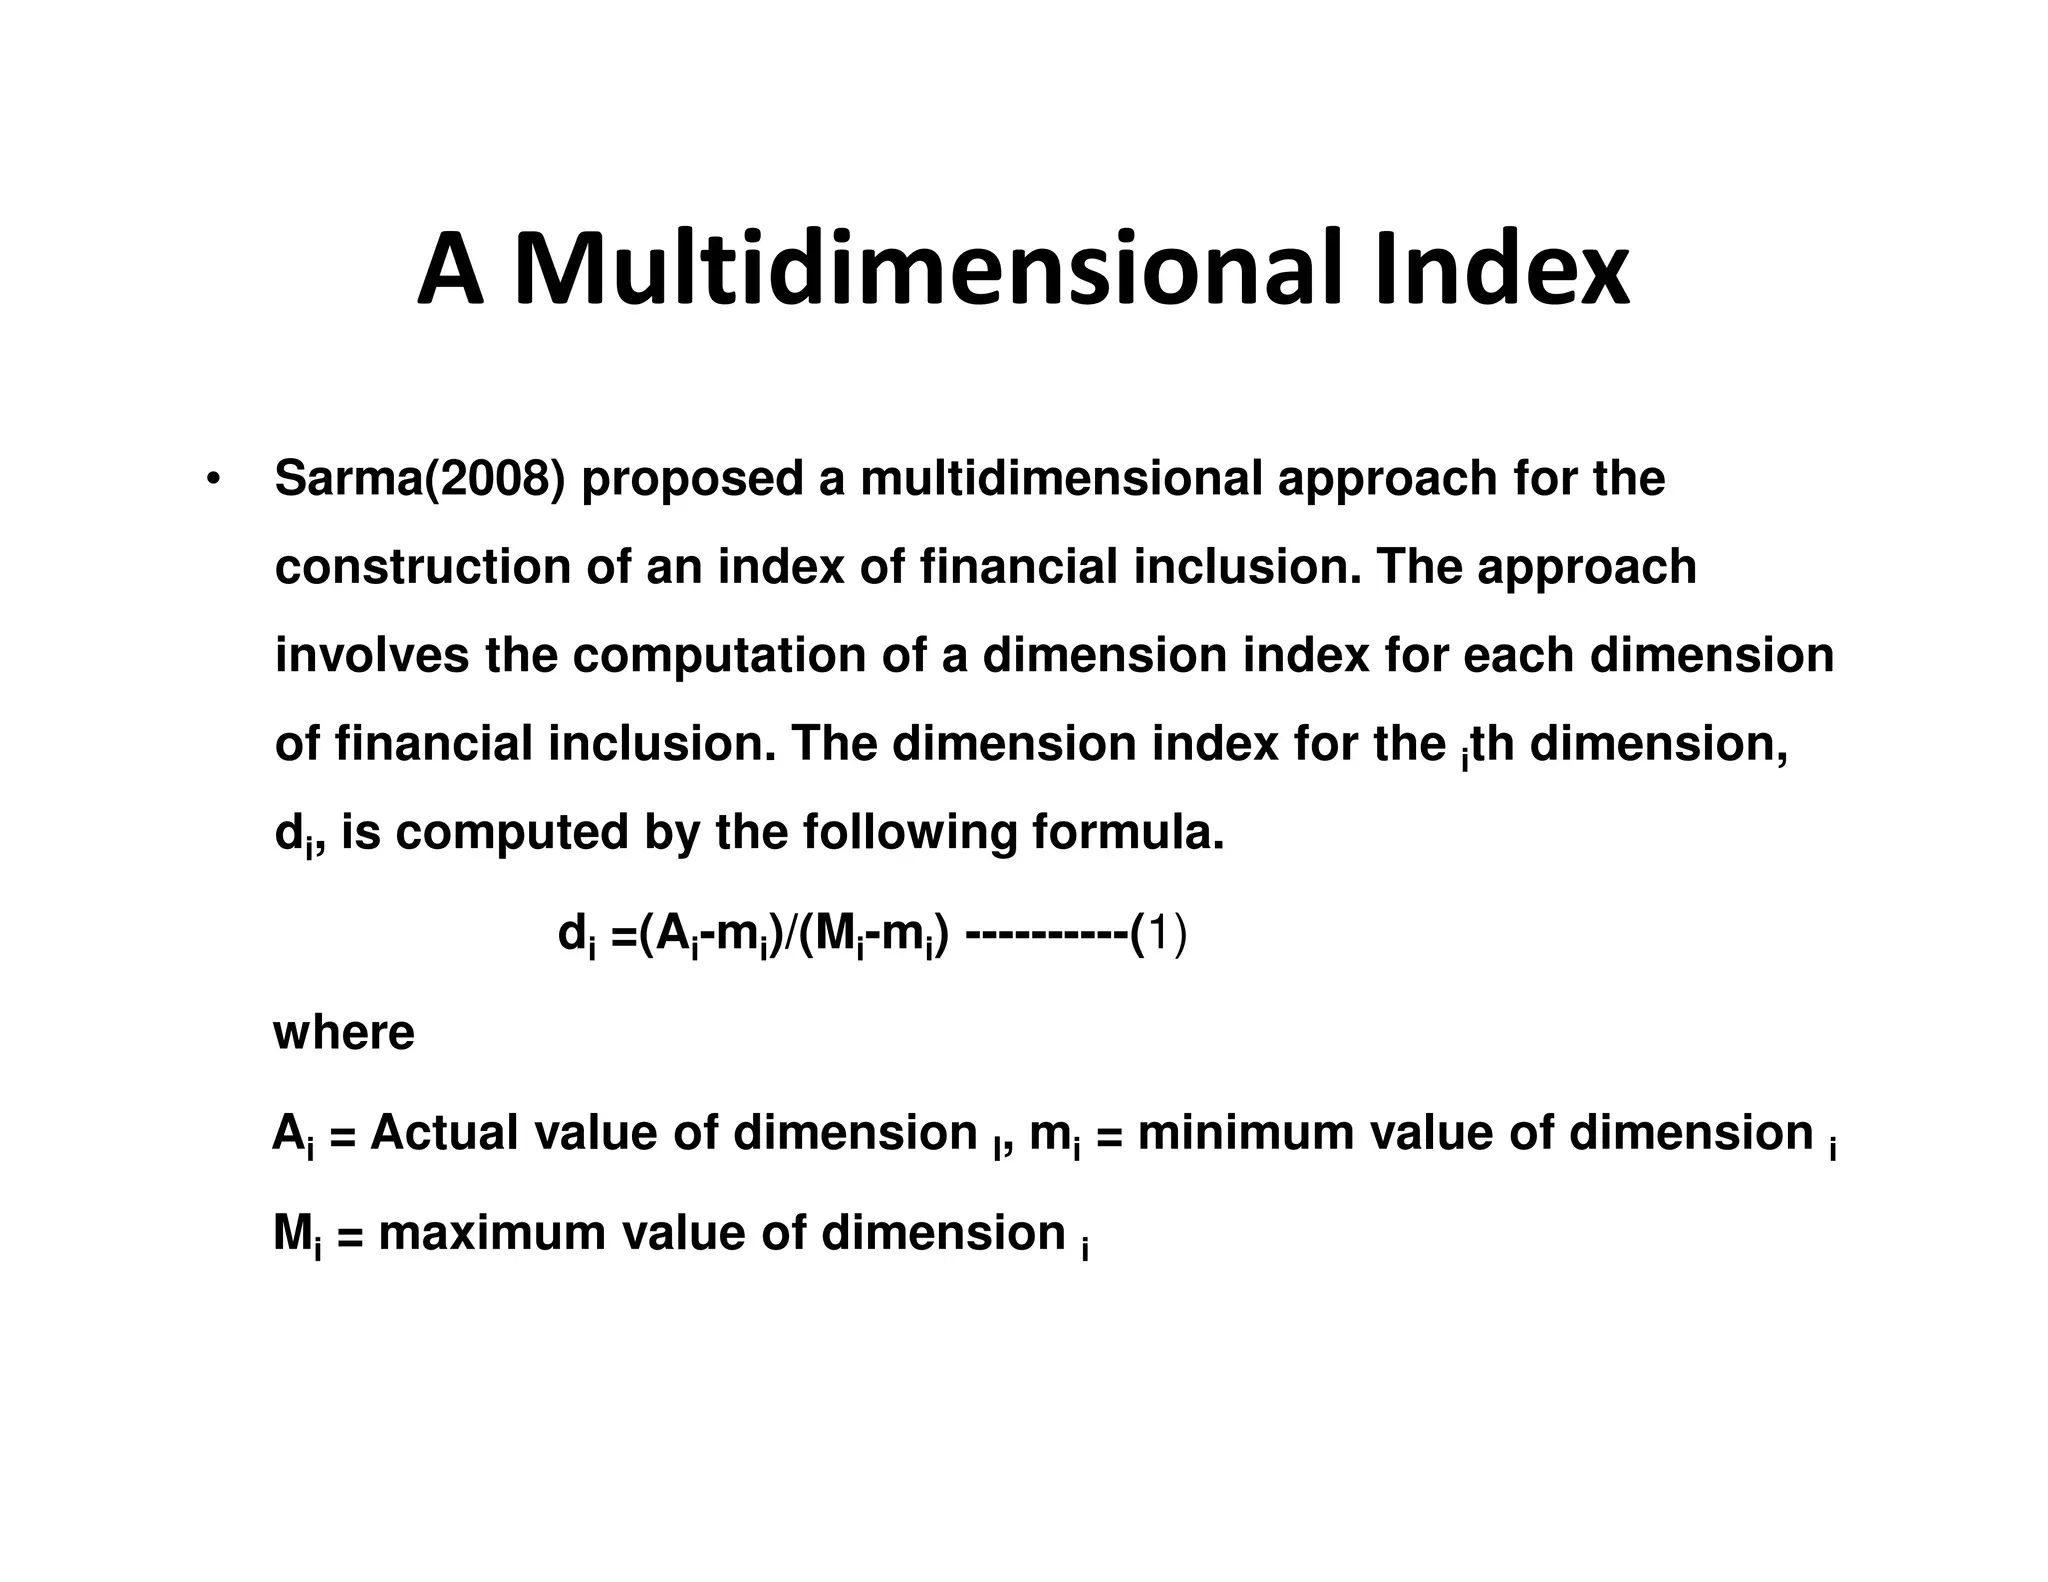
• Formula (1) ensures that 0 ≤ di ≤ 1. Higher the value of di, higher the
country’s achievement in dimension i. If n dimensions of financial
inclusion are considered, then, a country i will be represented by a
point Di = (d1, d2, d3, ….dn) on the n dimensional Cartesian space.
• Then the Index of Financial Inclusion (IFI) for entity i is computed as:
IFIi =1-√[(1-d1)2+(1-d2)2+-----+(1-dn)2]/√n](https://image.slidesharecdn.com/regionaldisparityinfinancialinclusioncompatibilitymode-130604043828-phpapp02/75/Regional-disparity-in-financial-inclusion-compatibility-mode-8-2048.jpg)

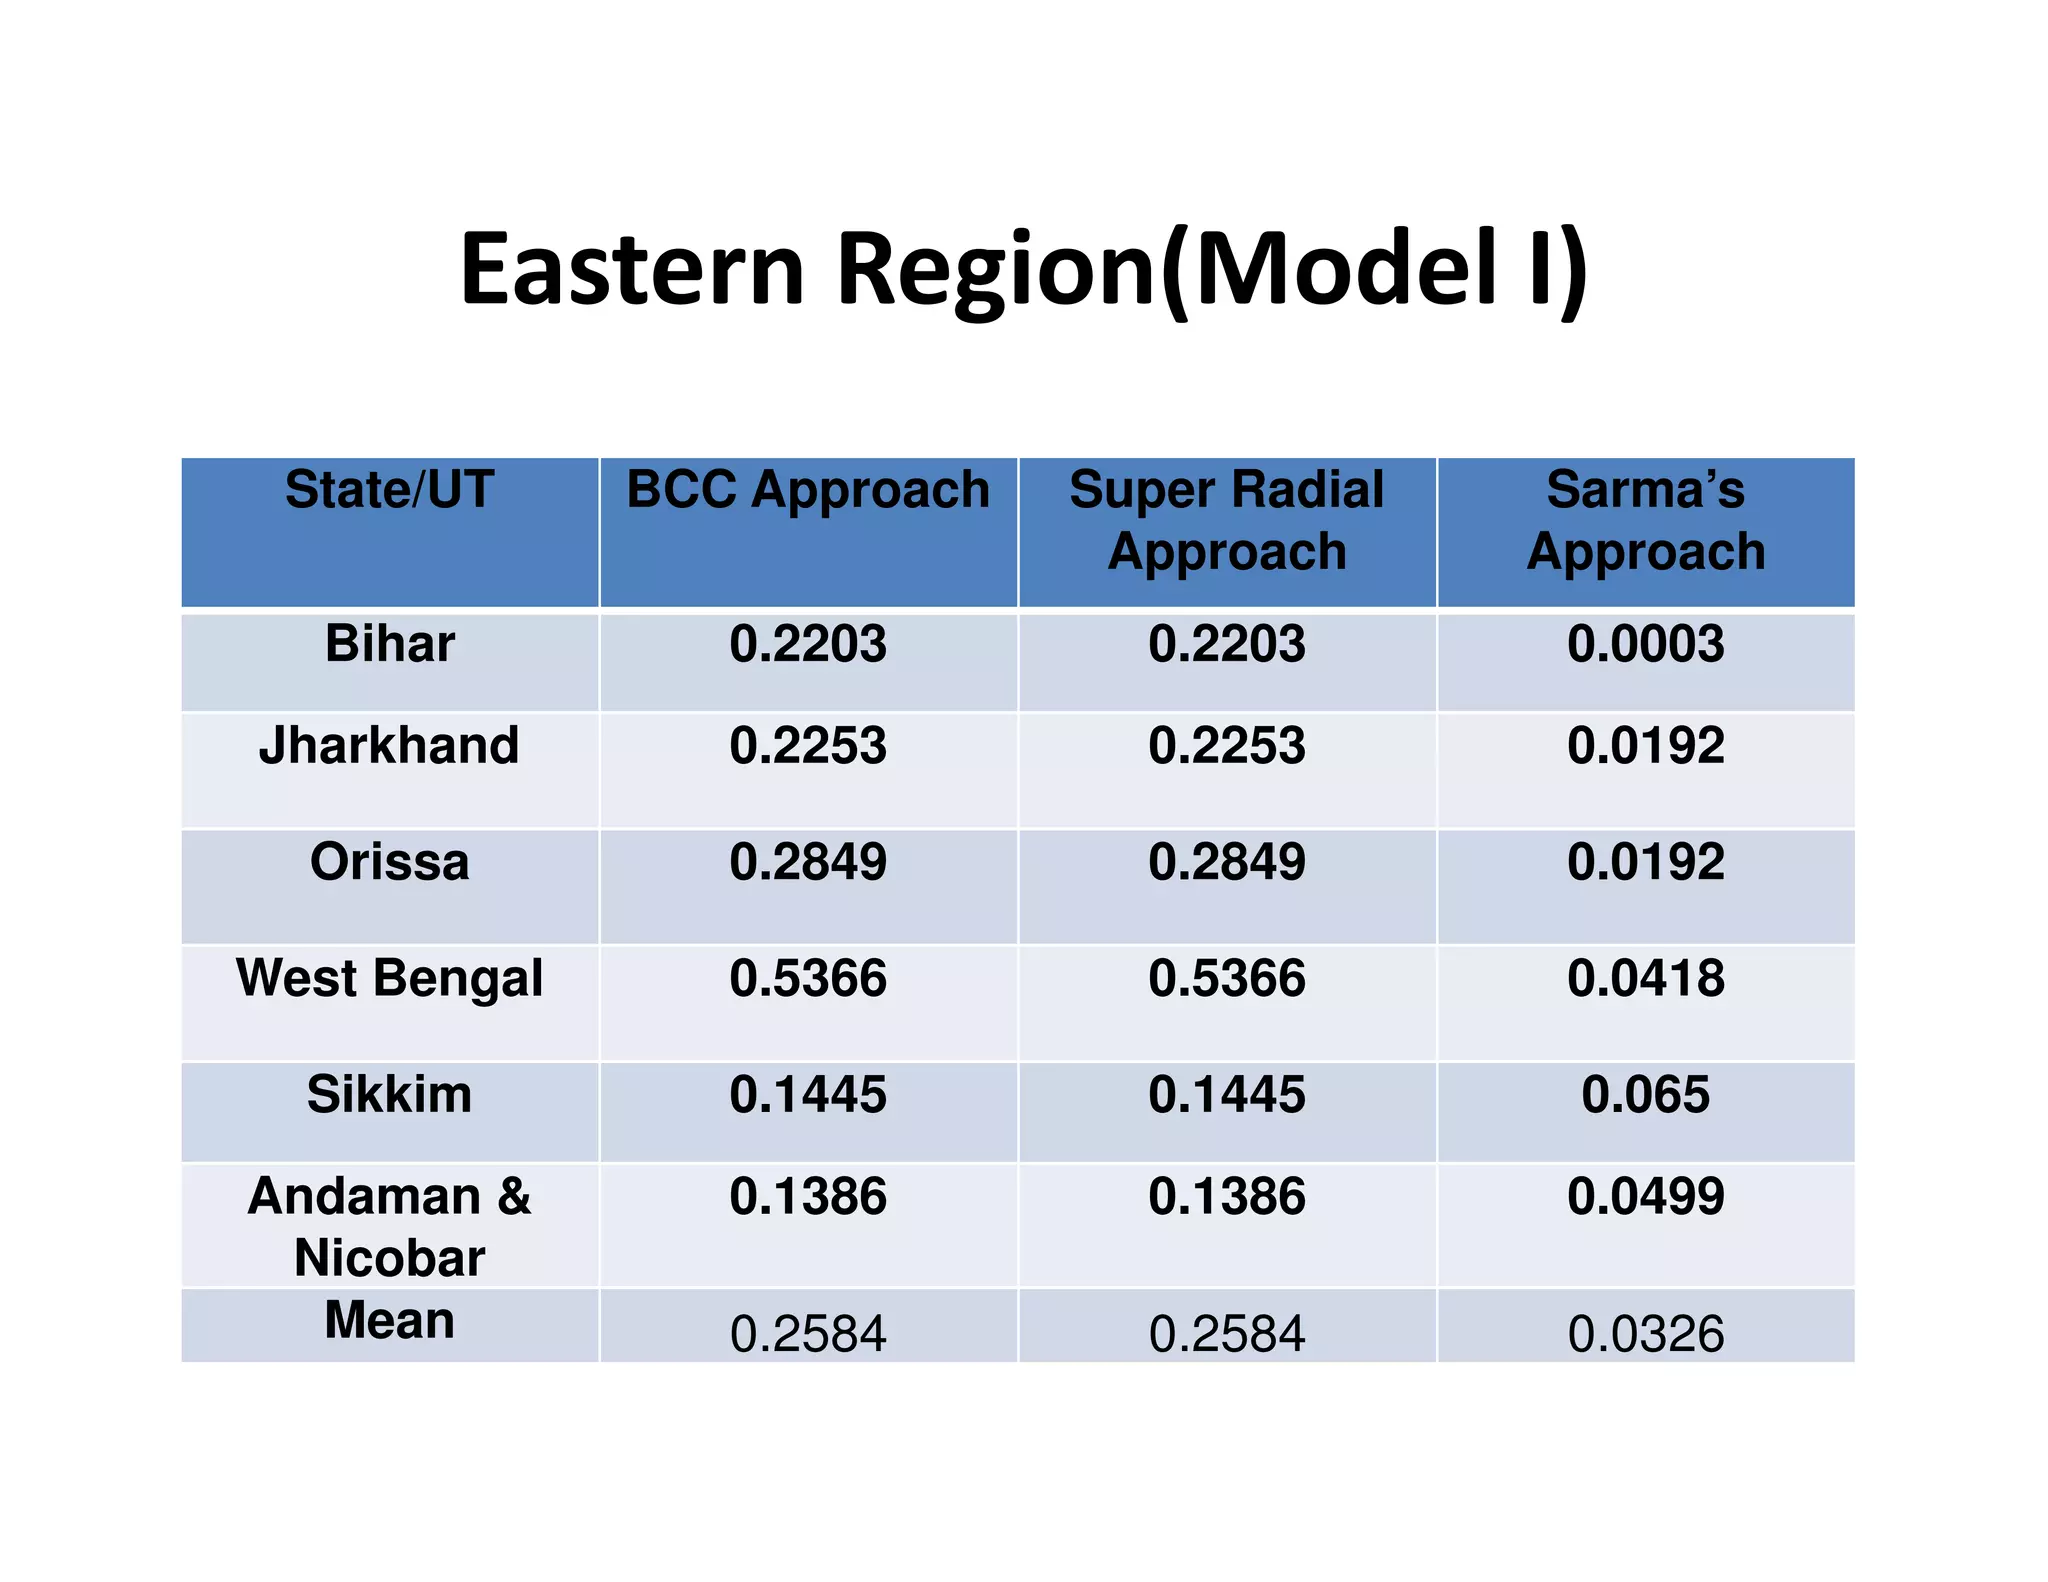
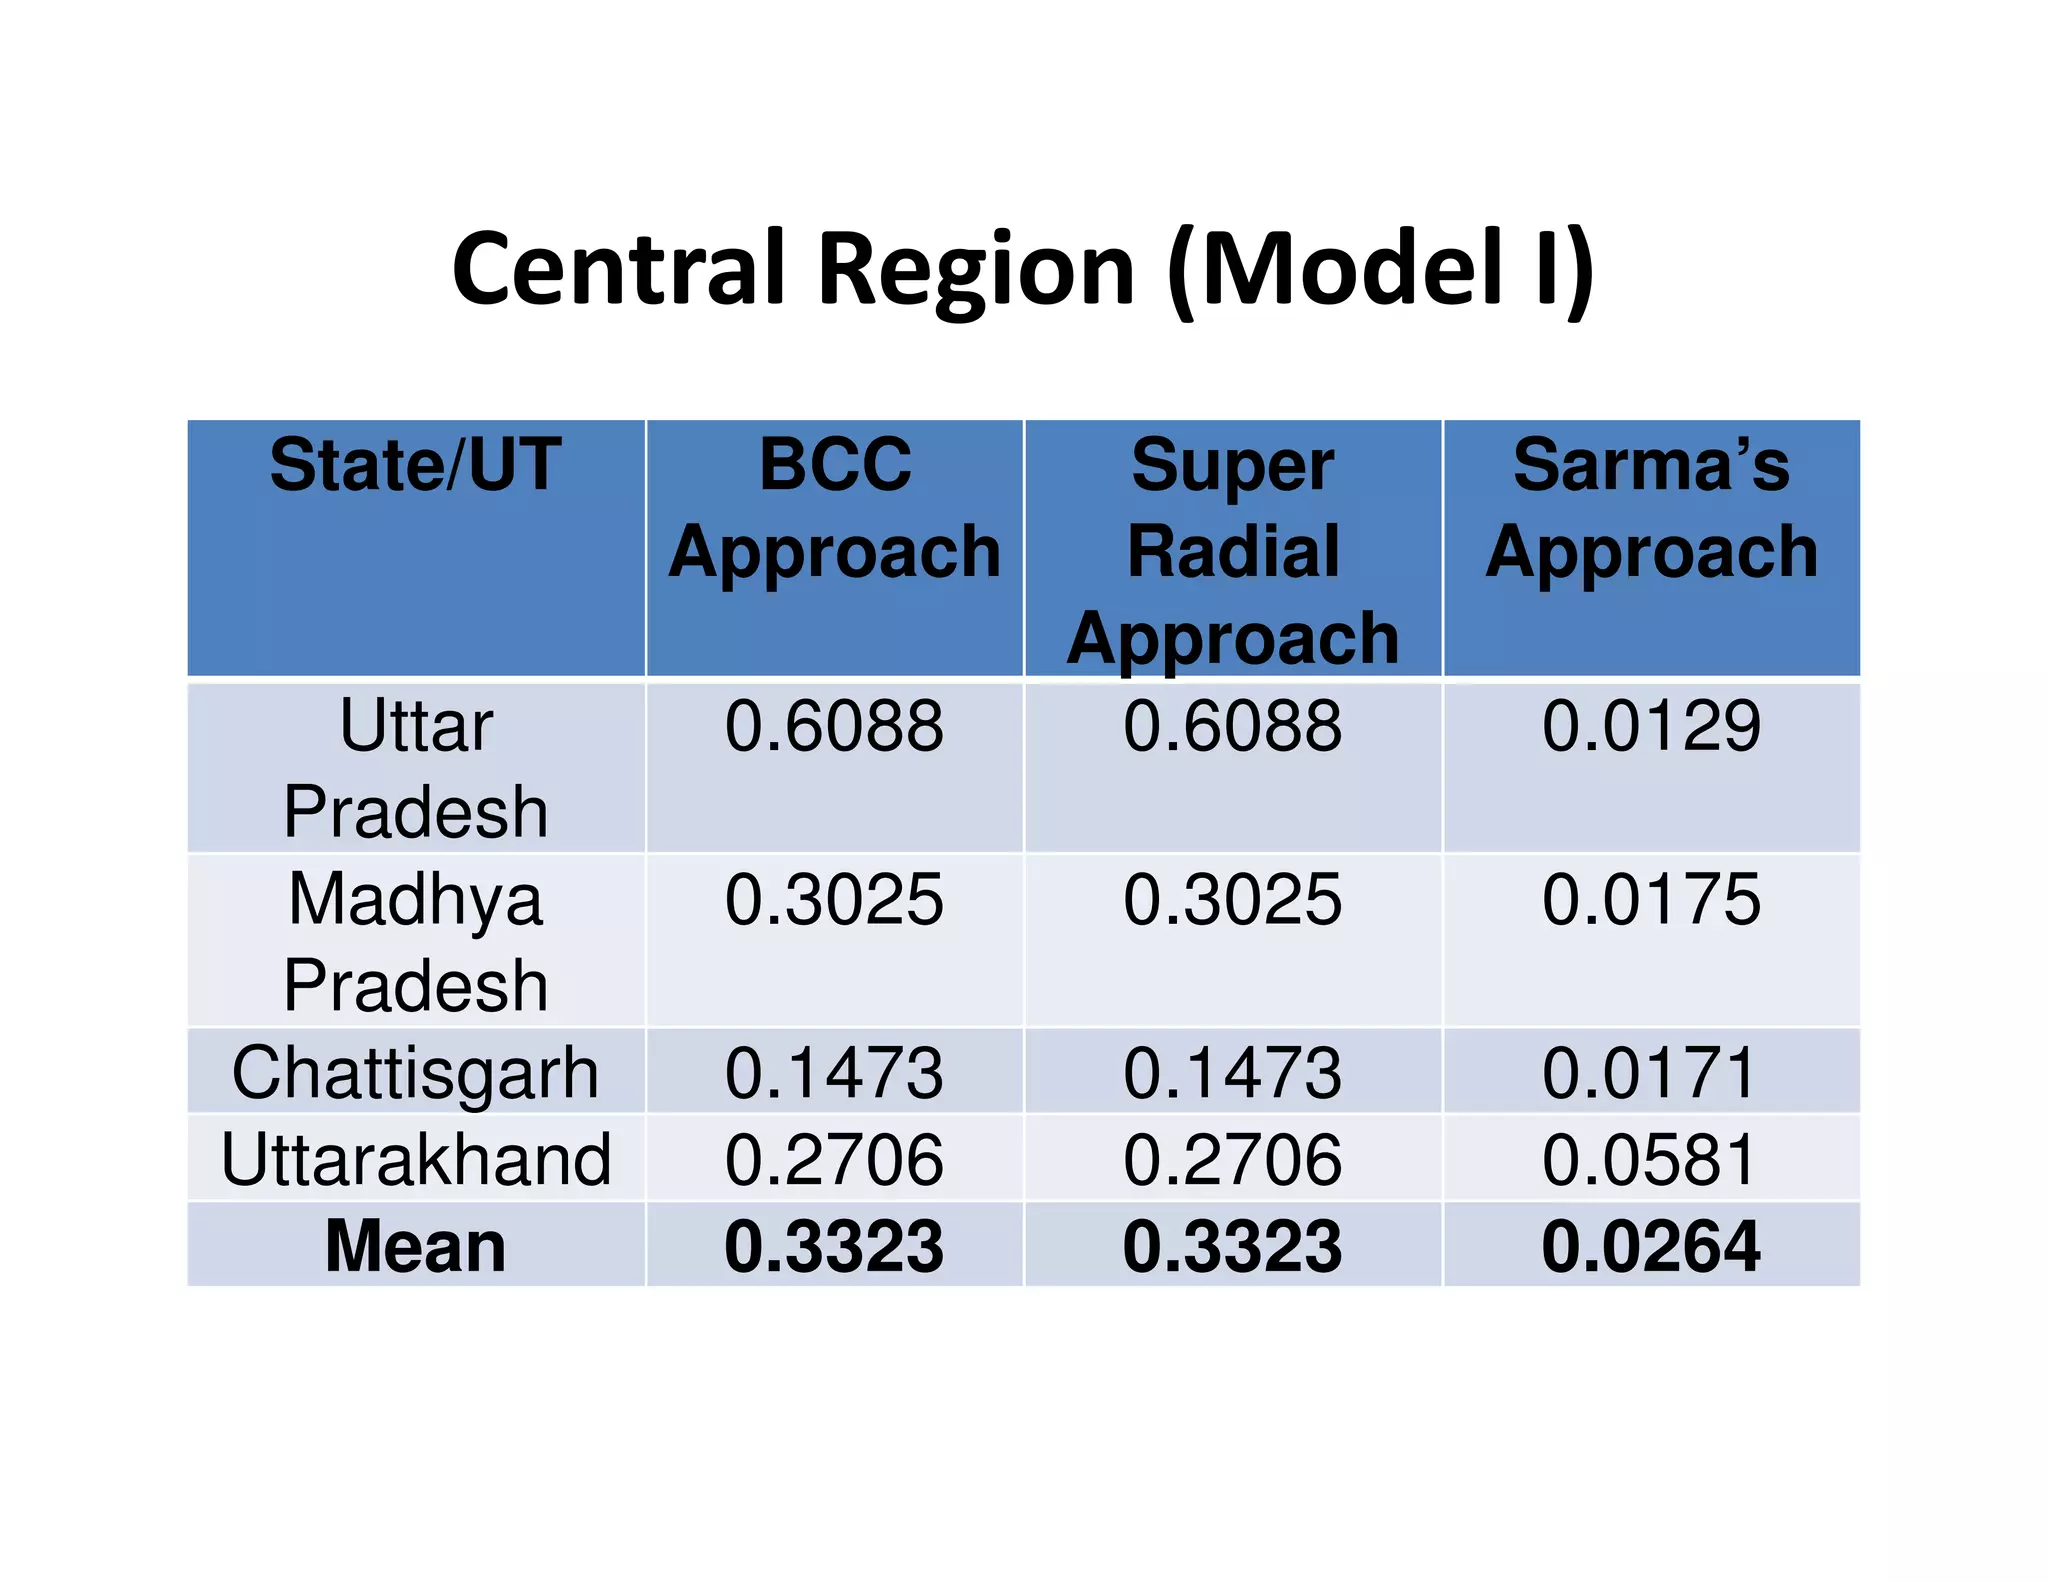
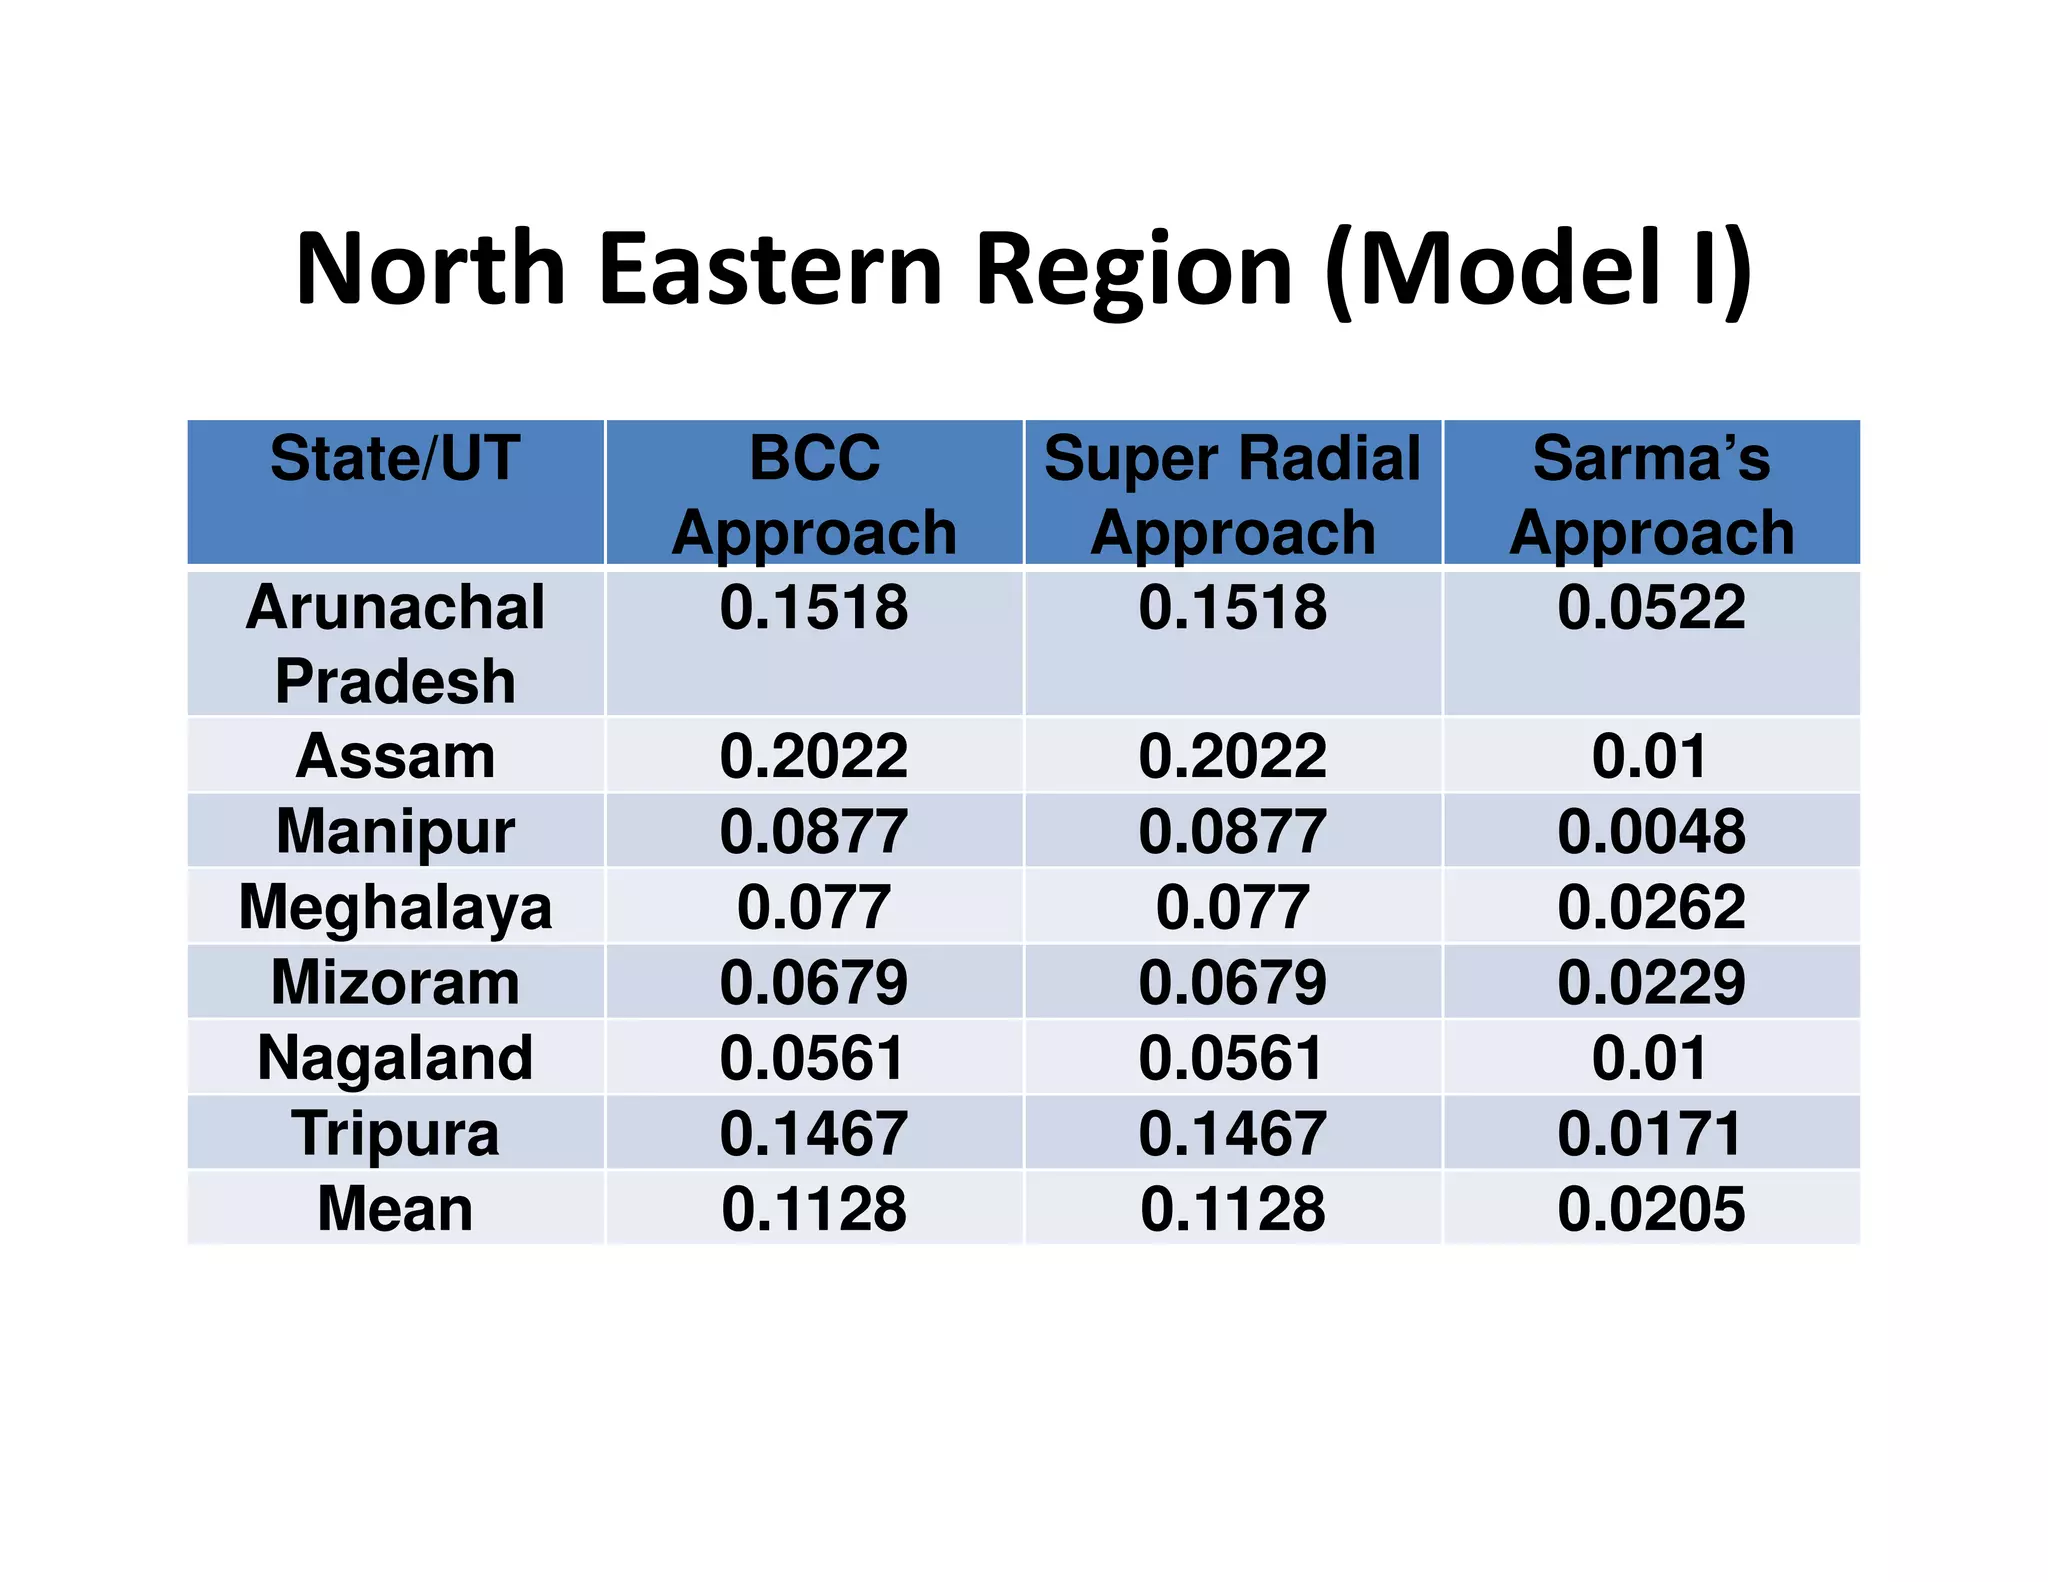
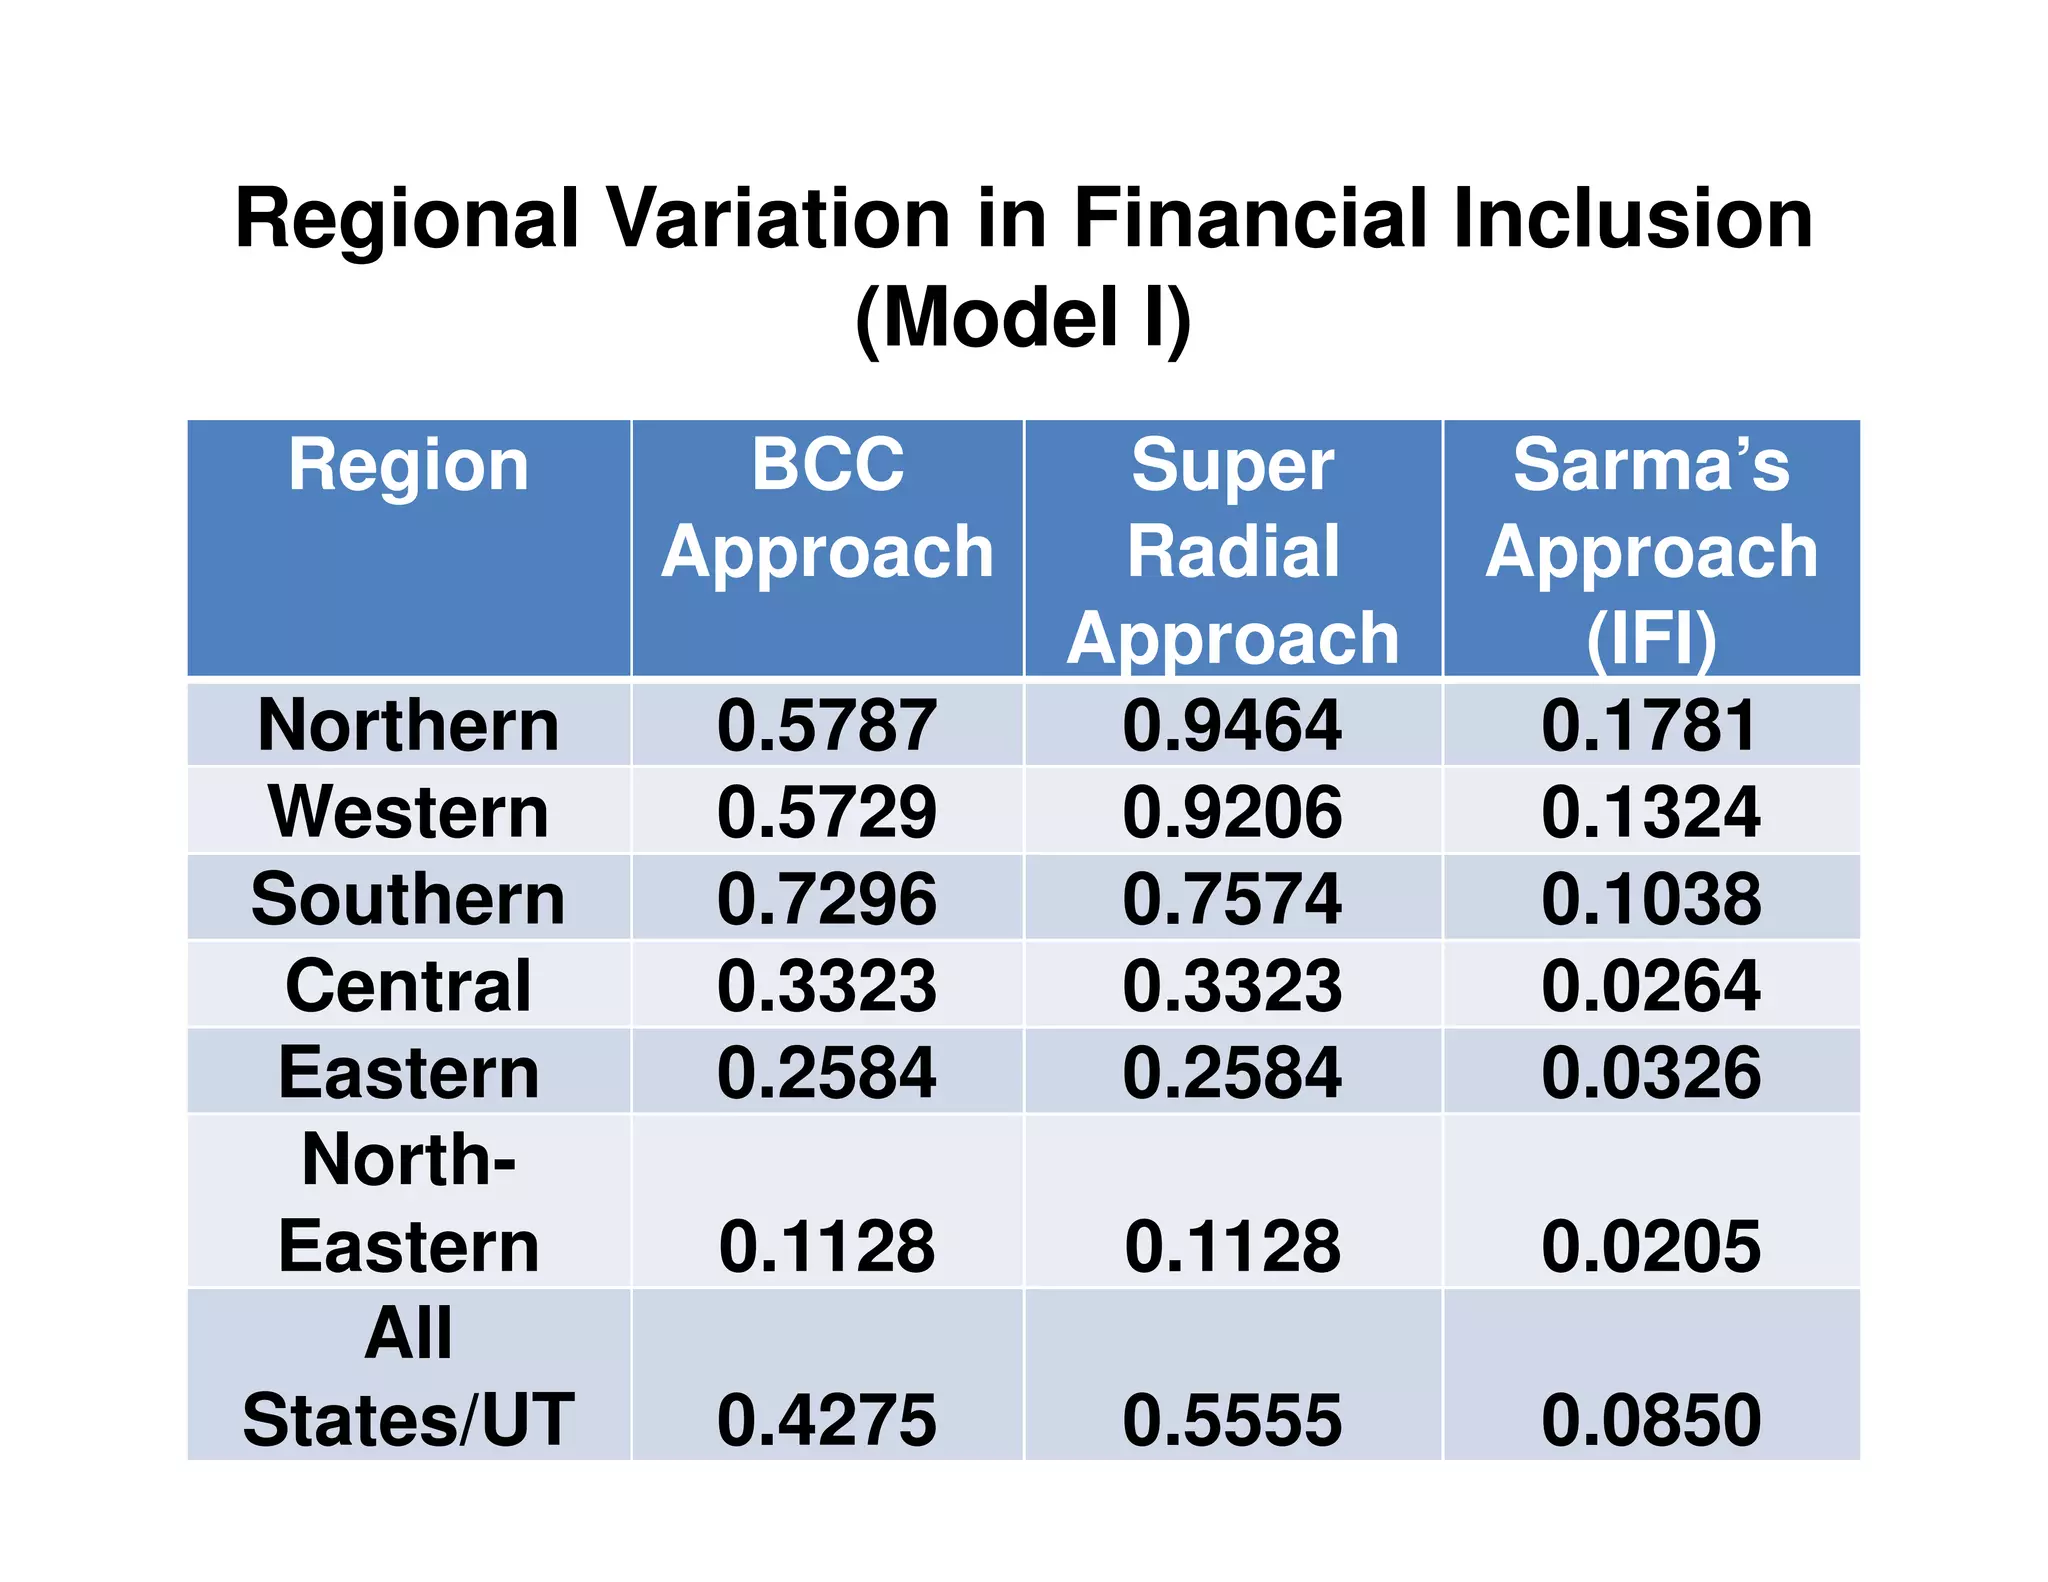
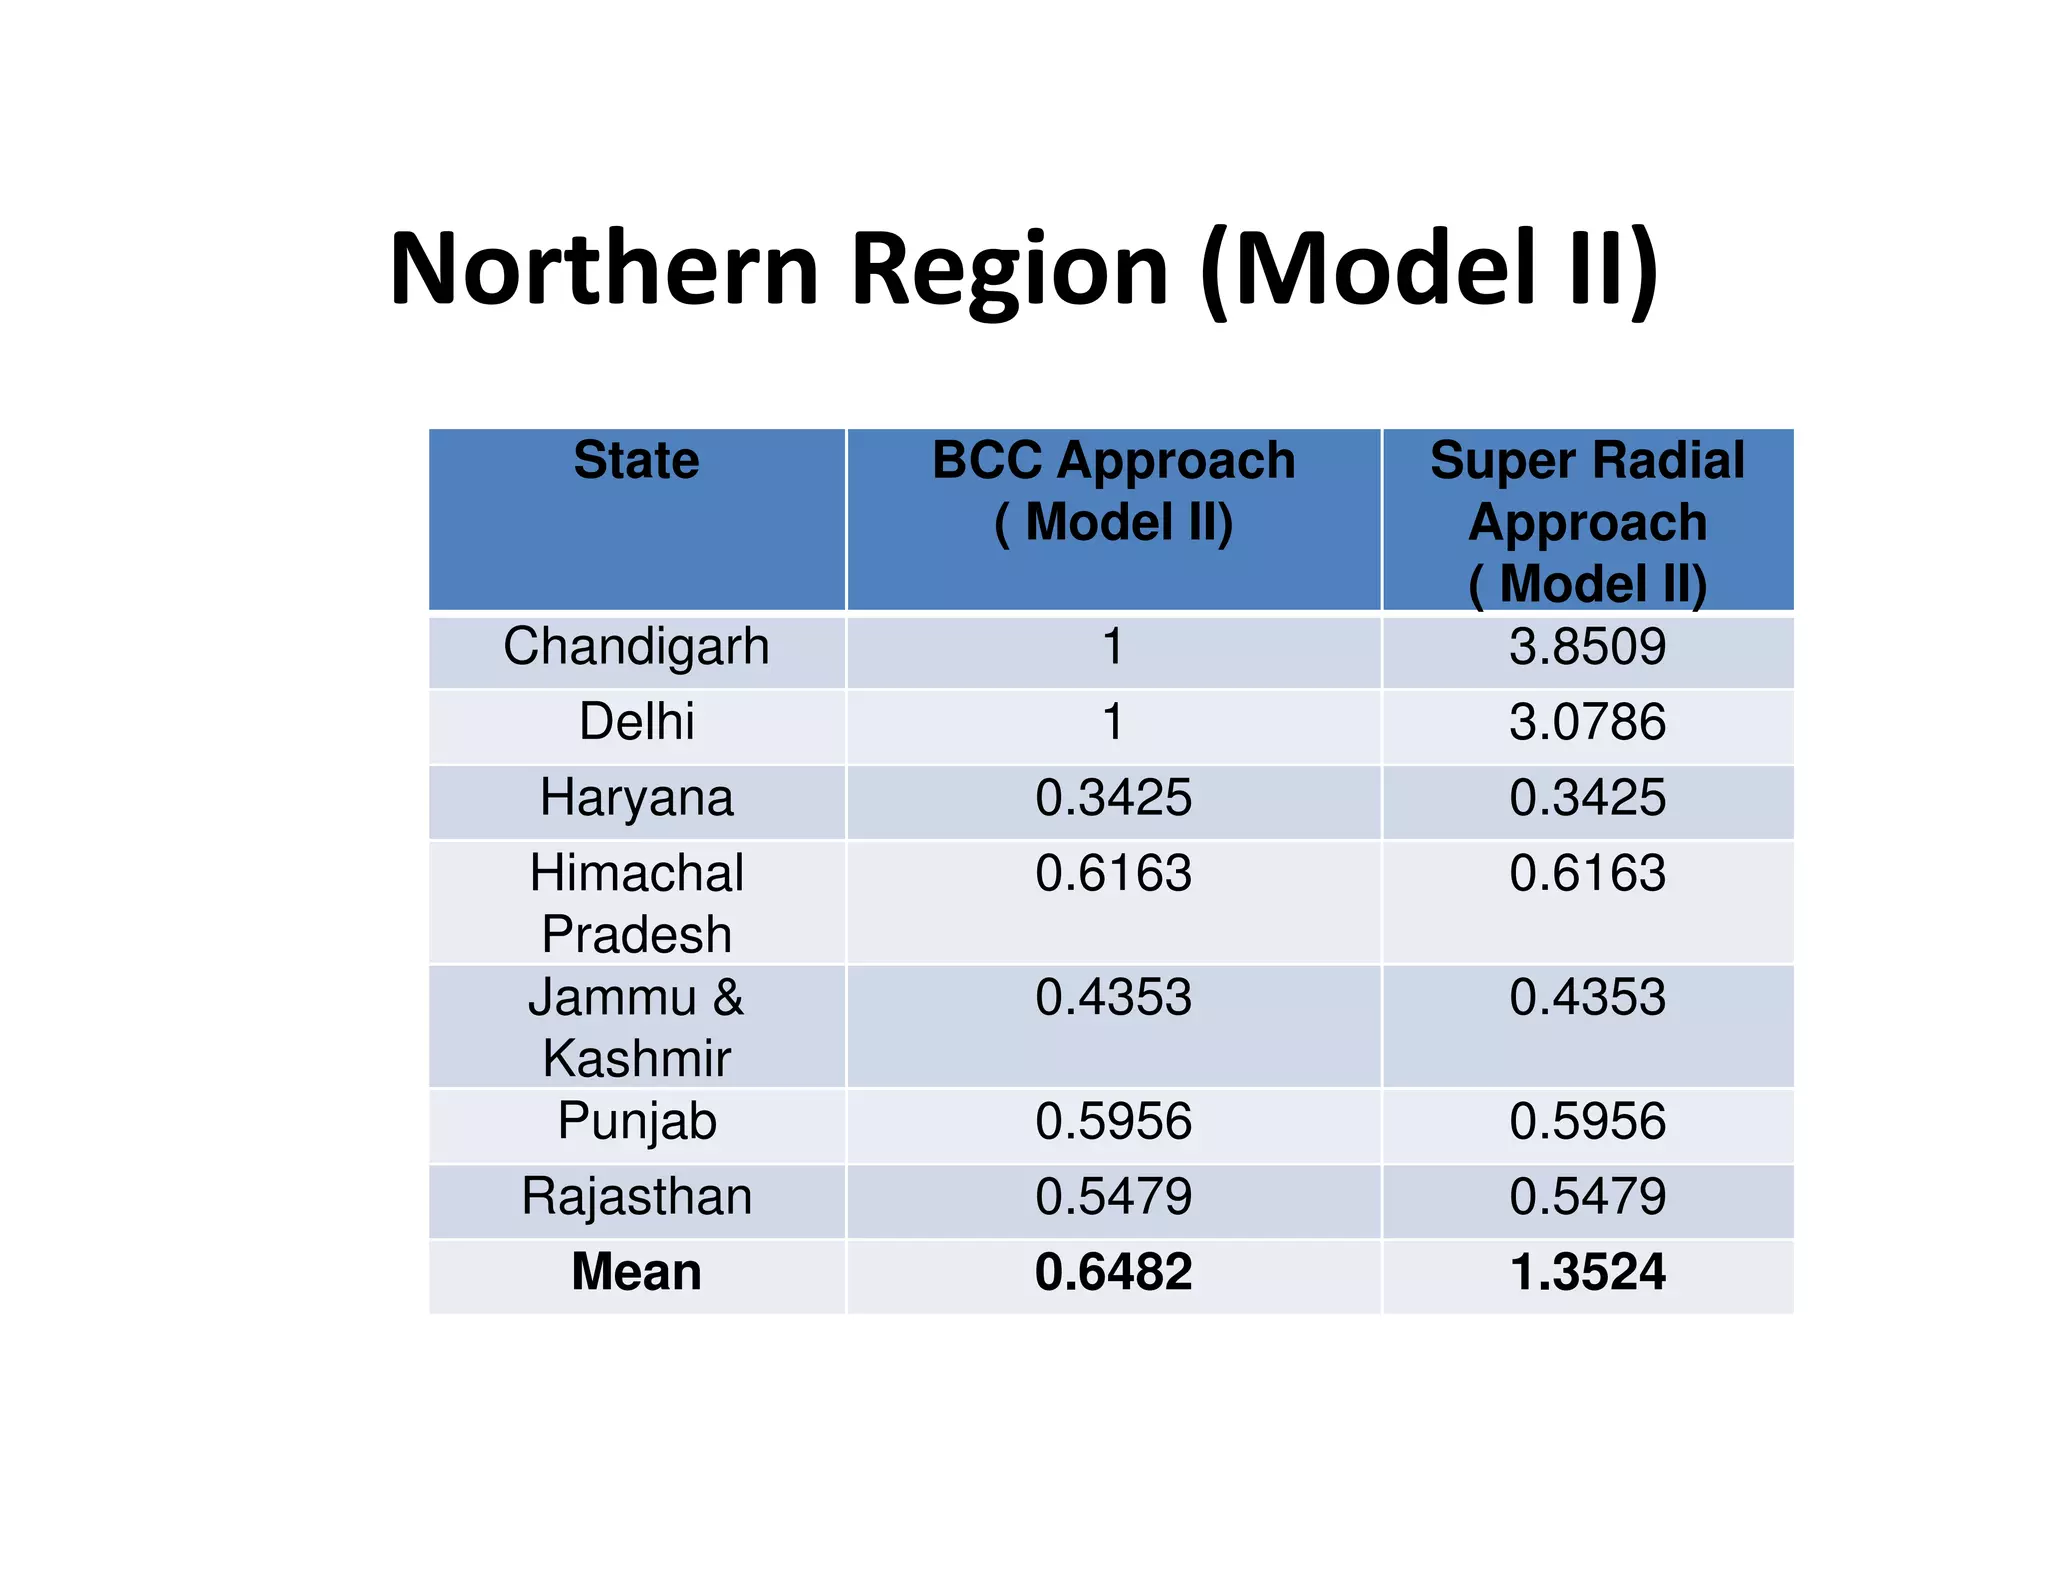
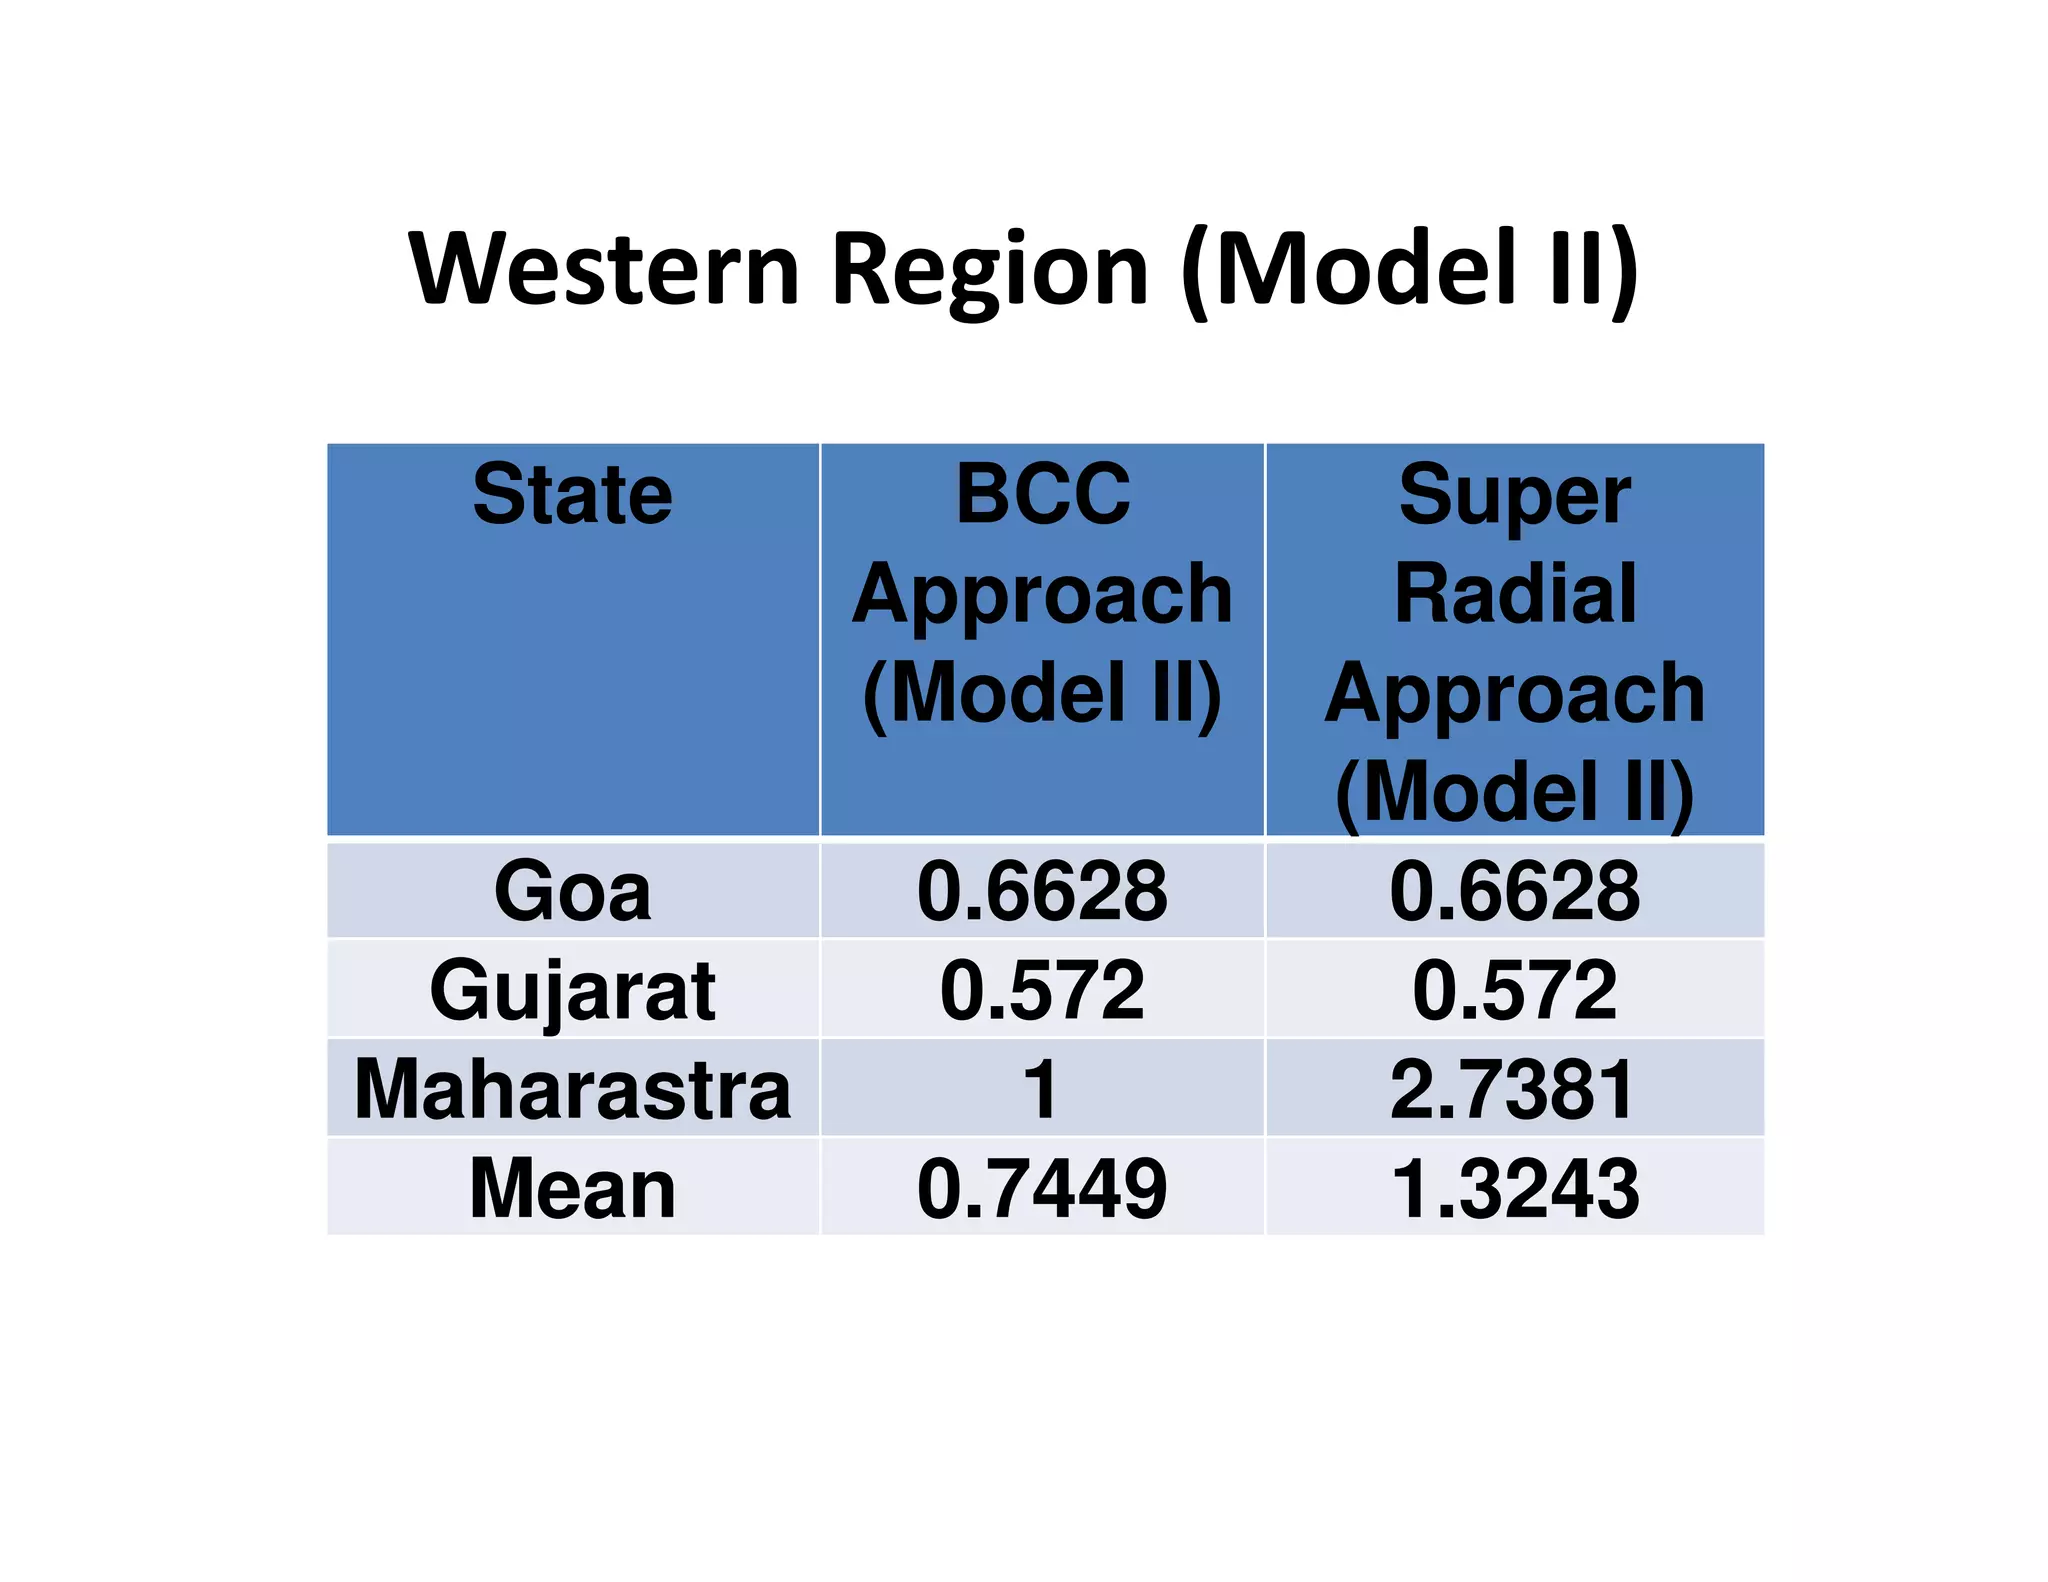
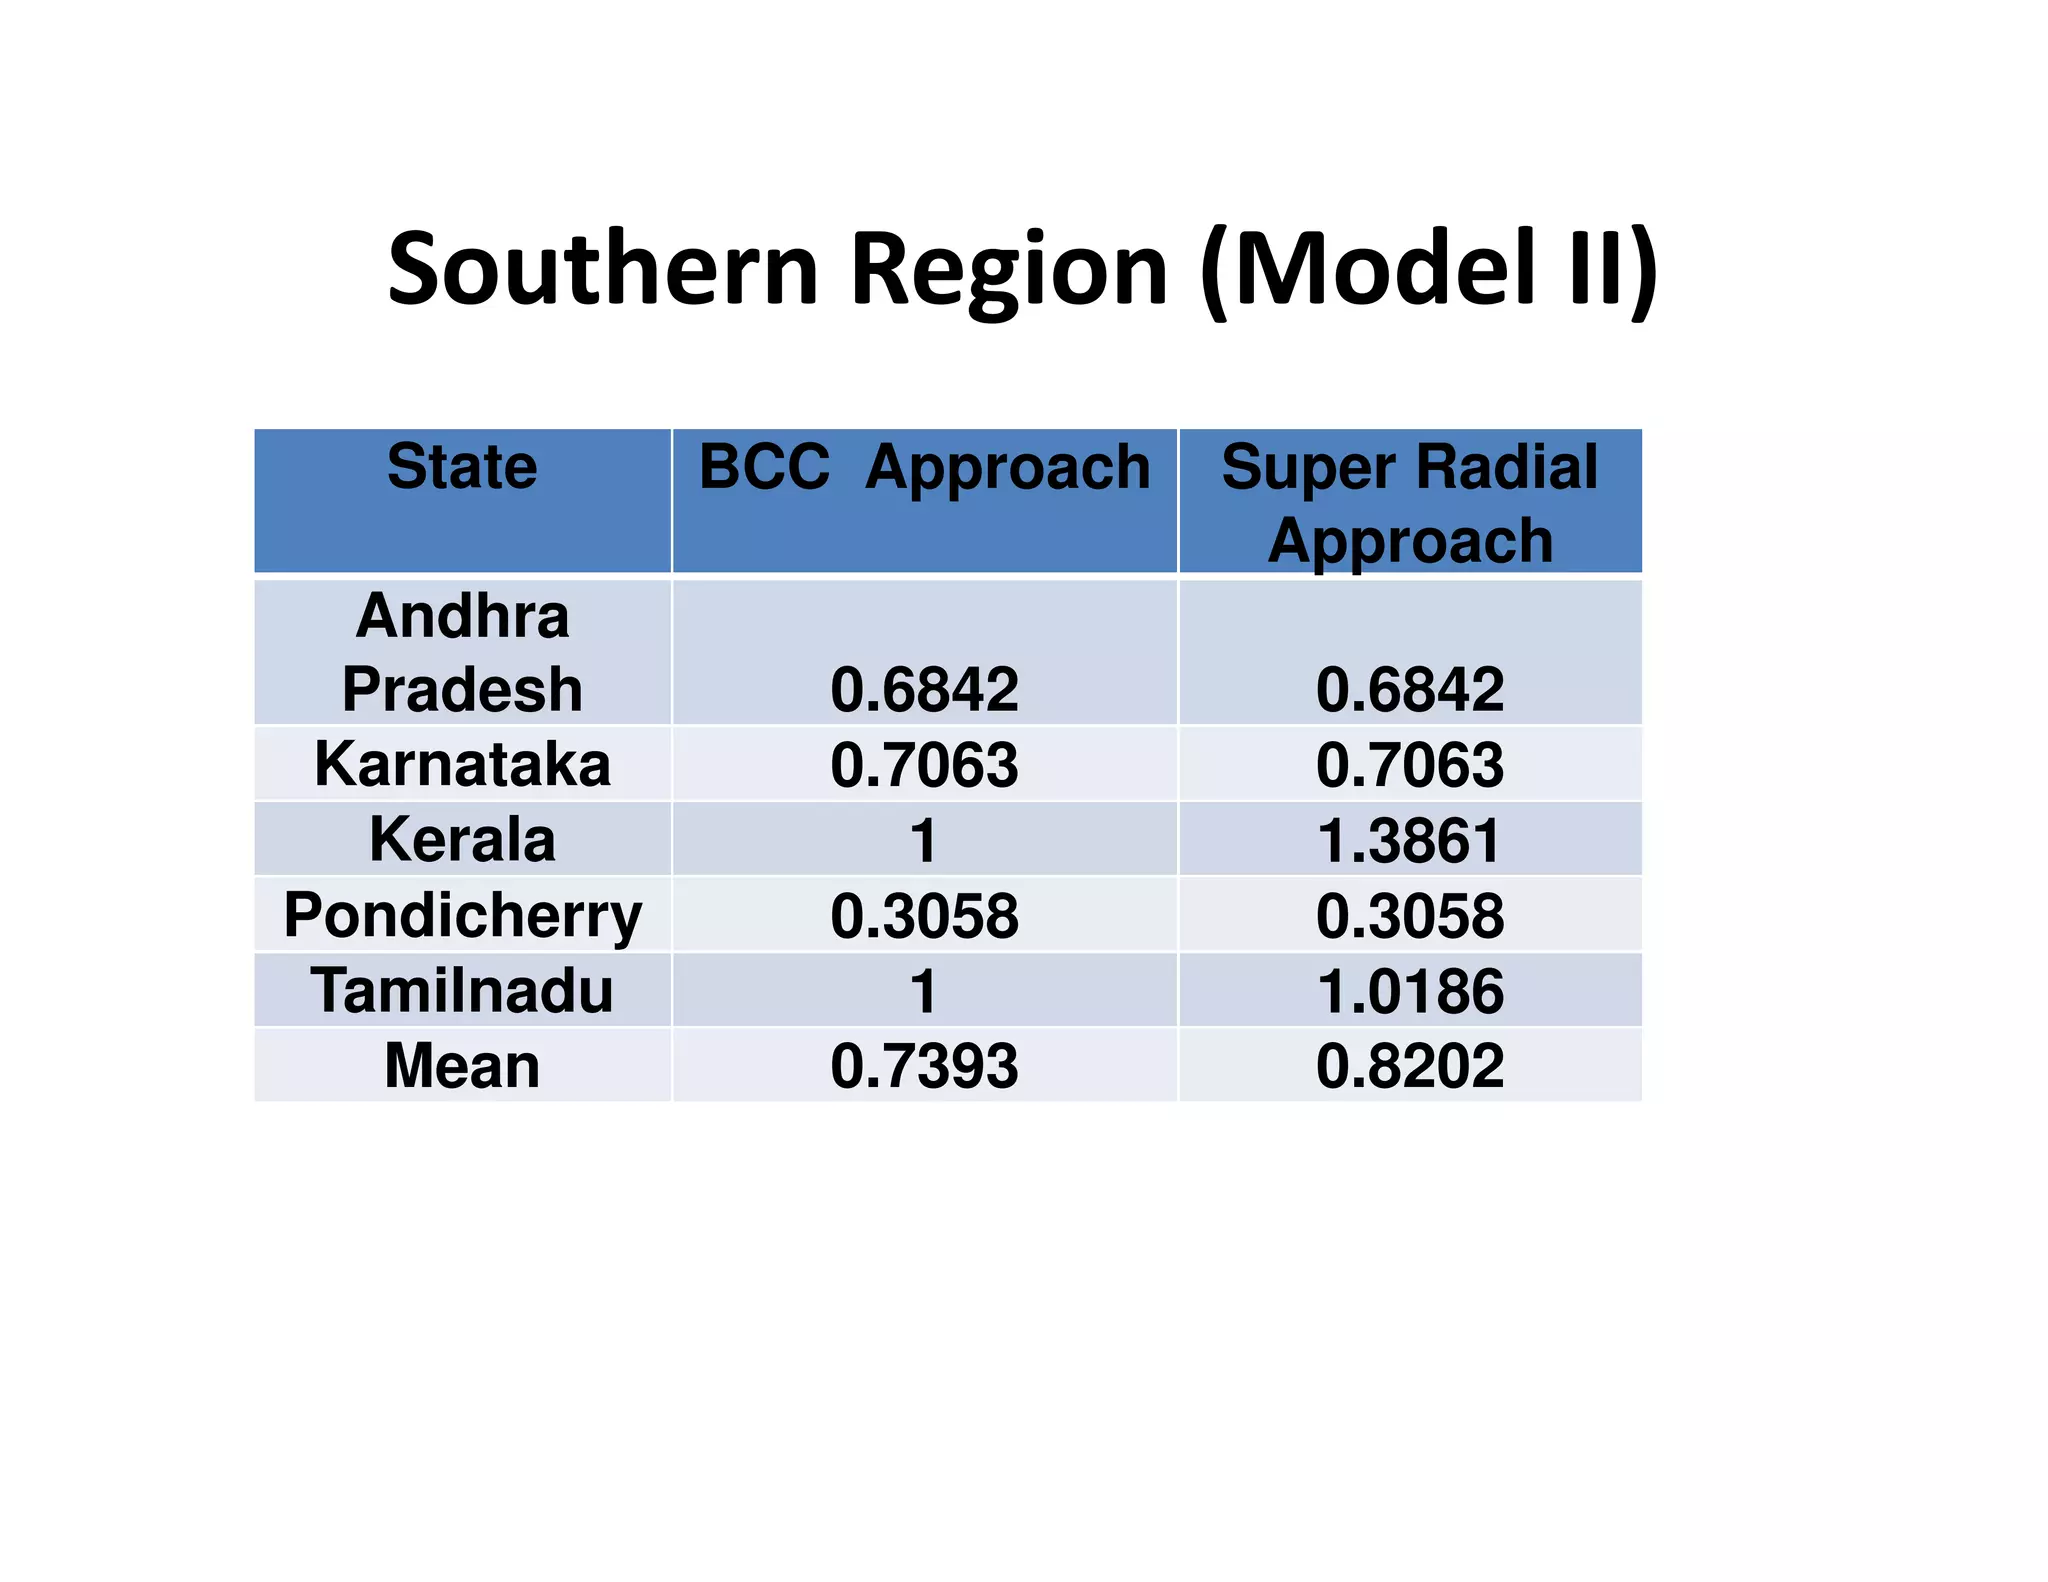
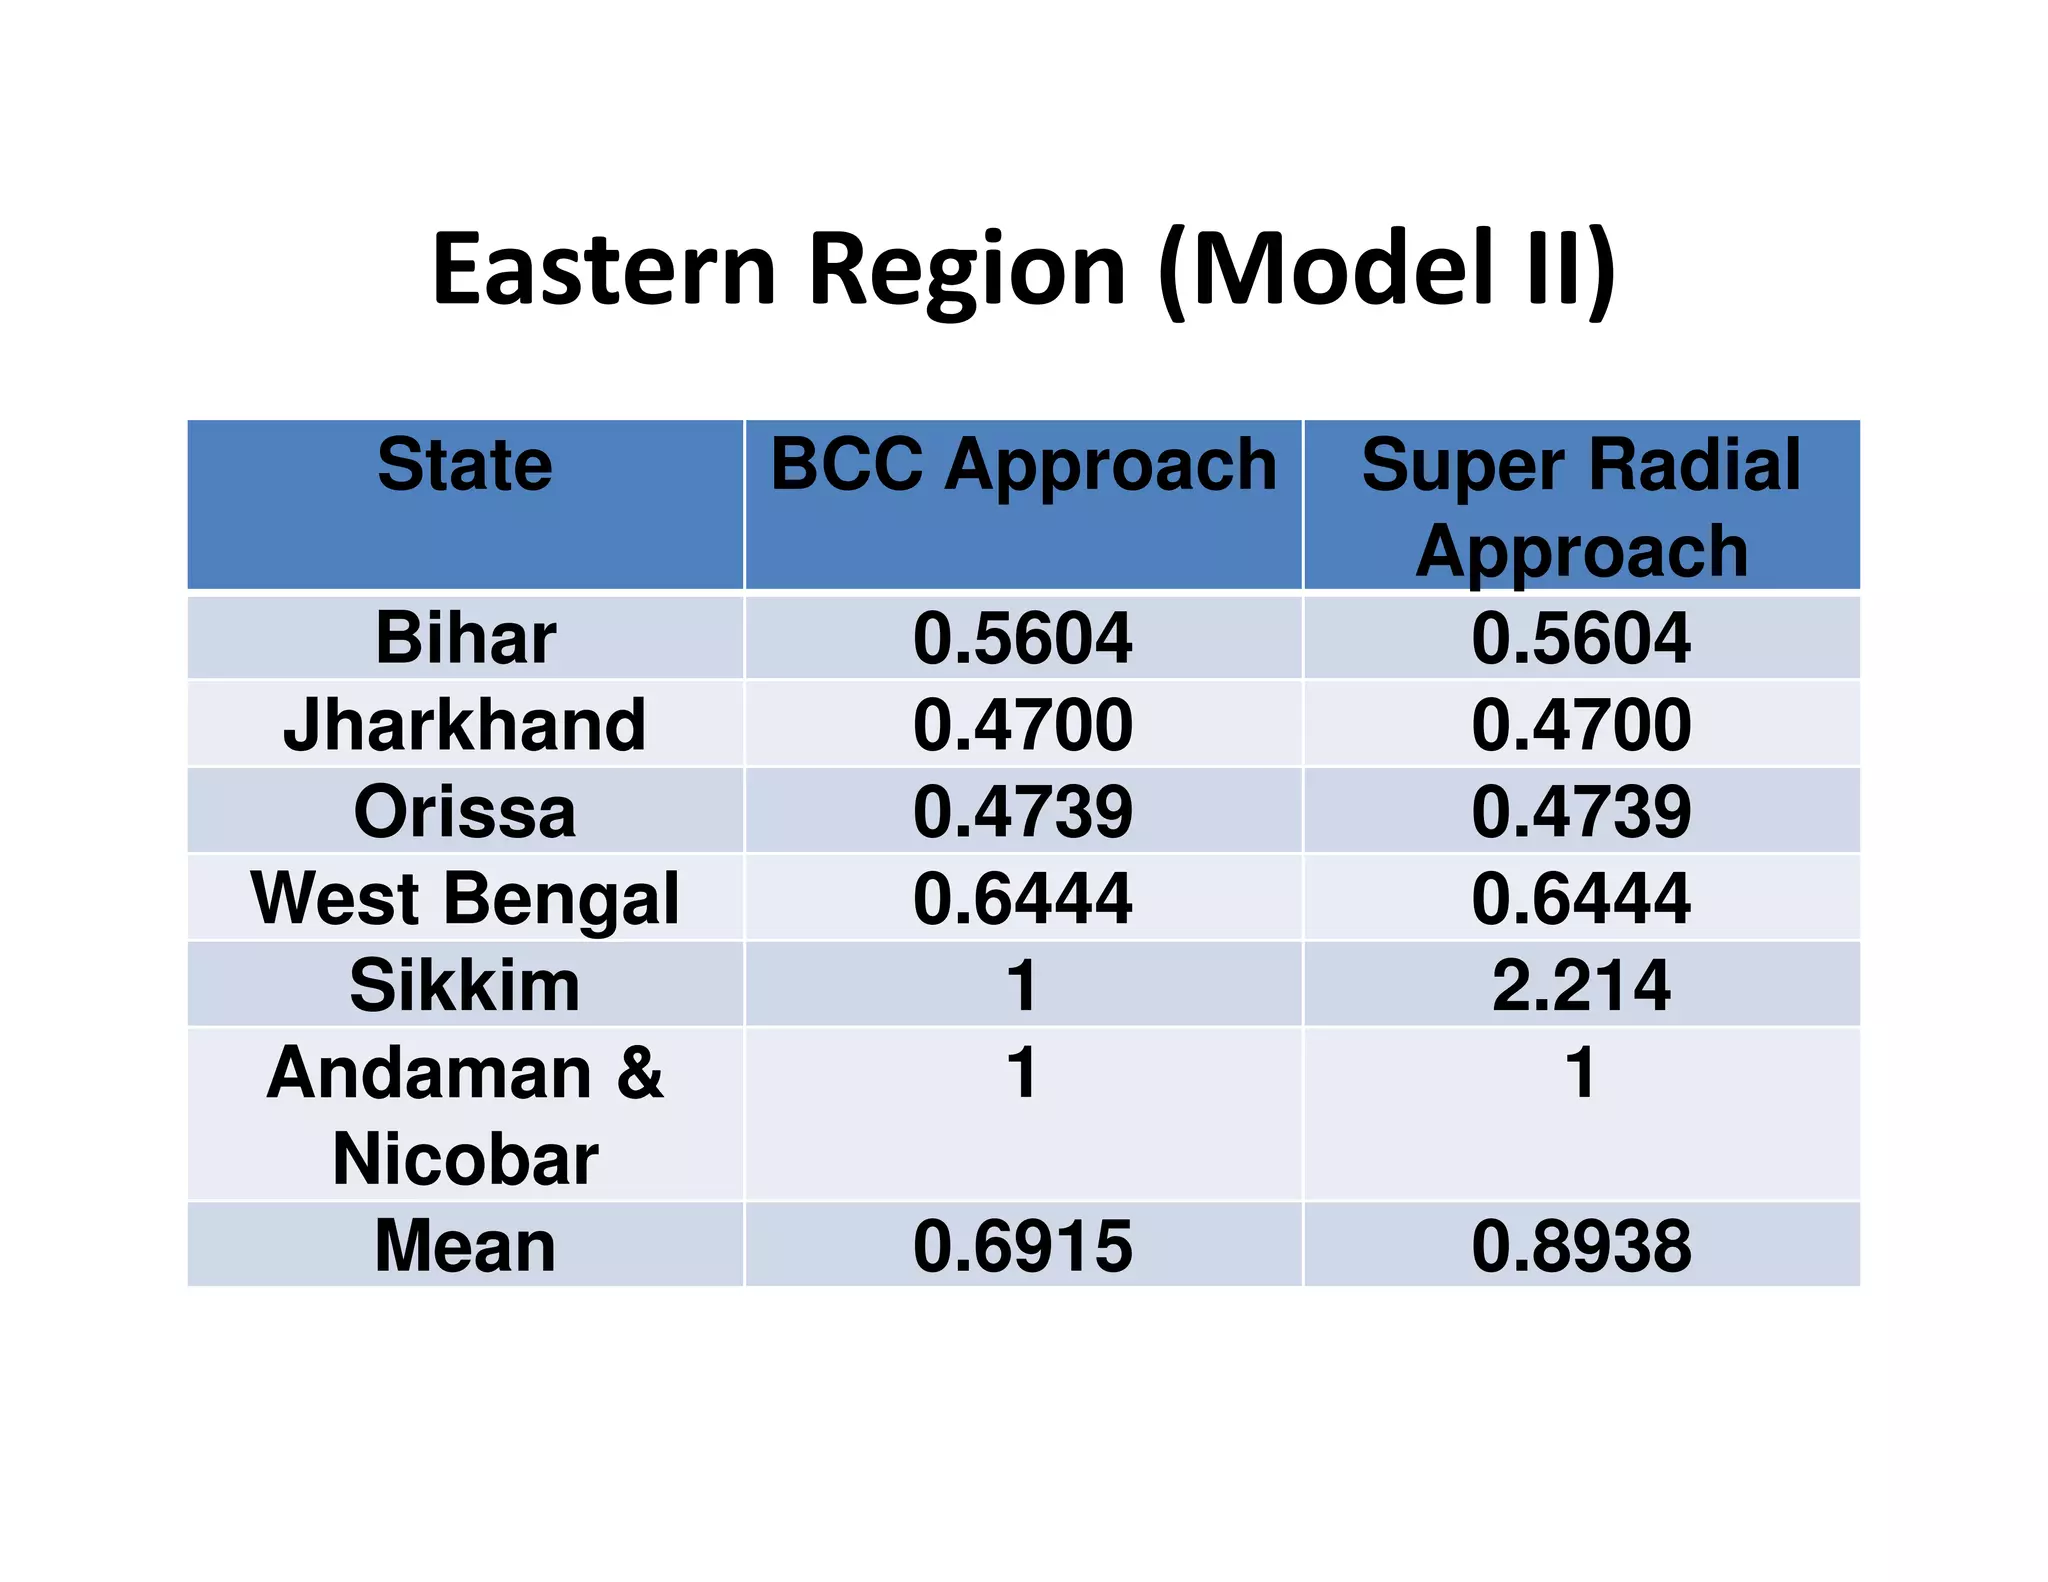
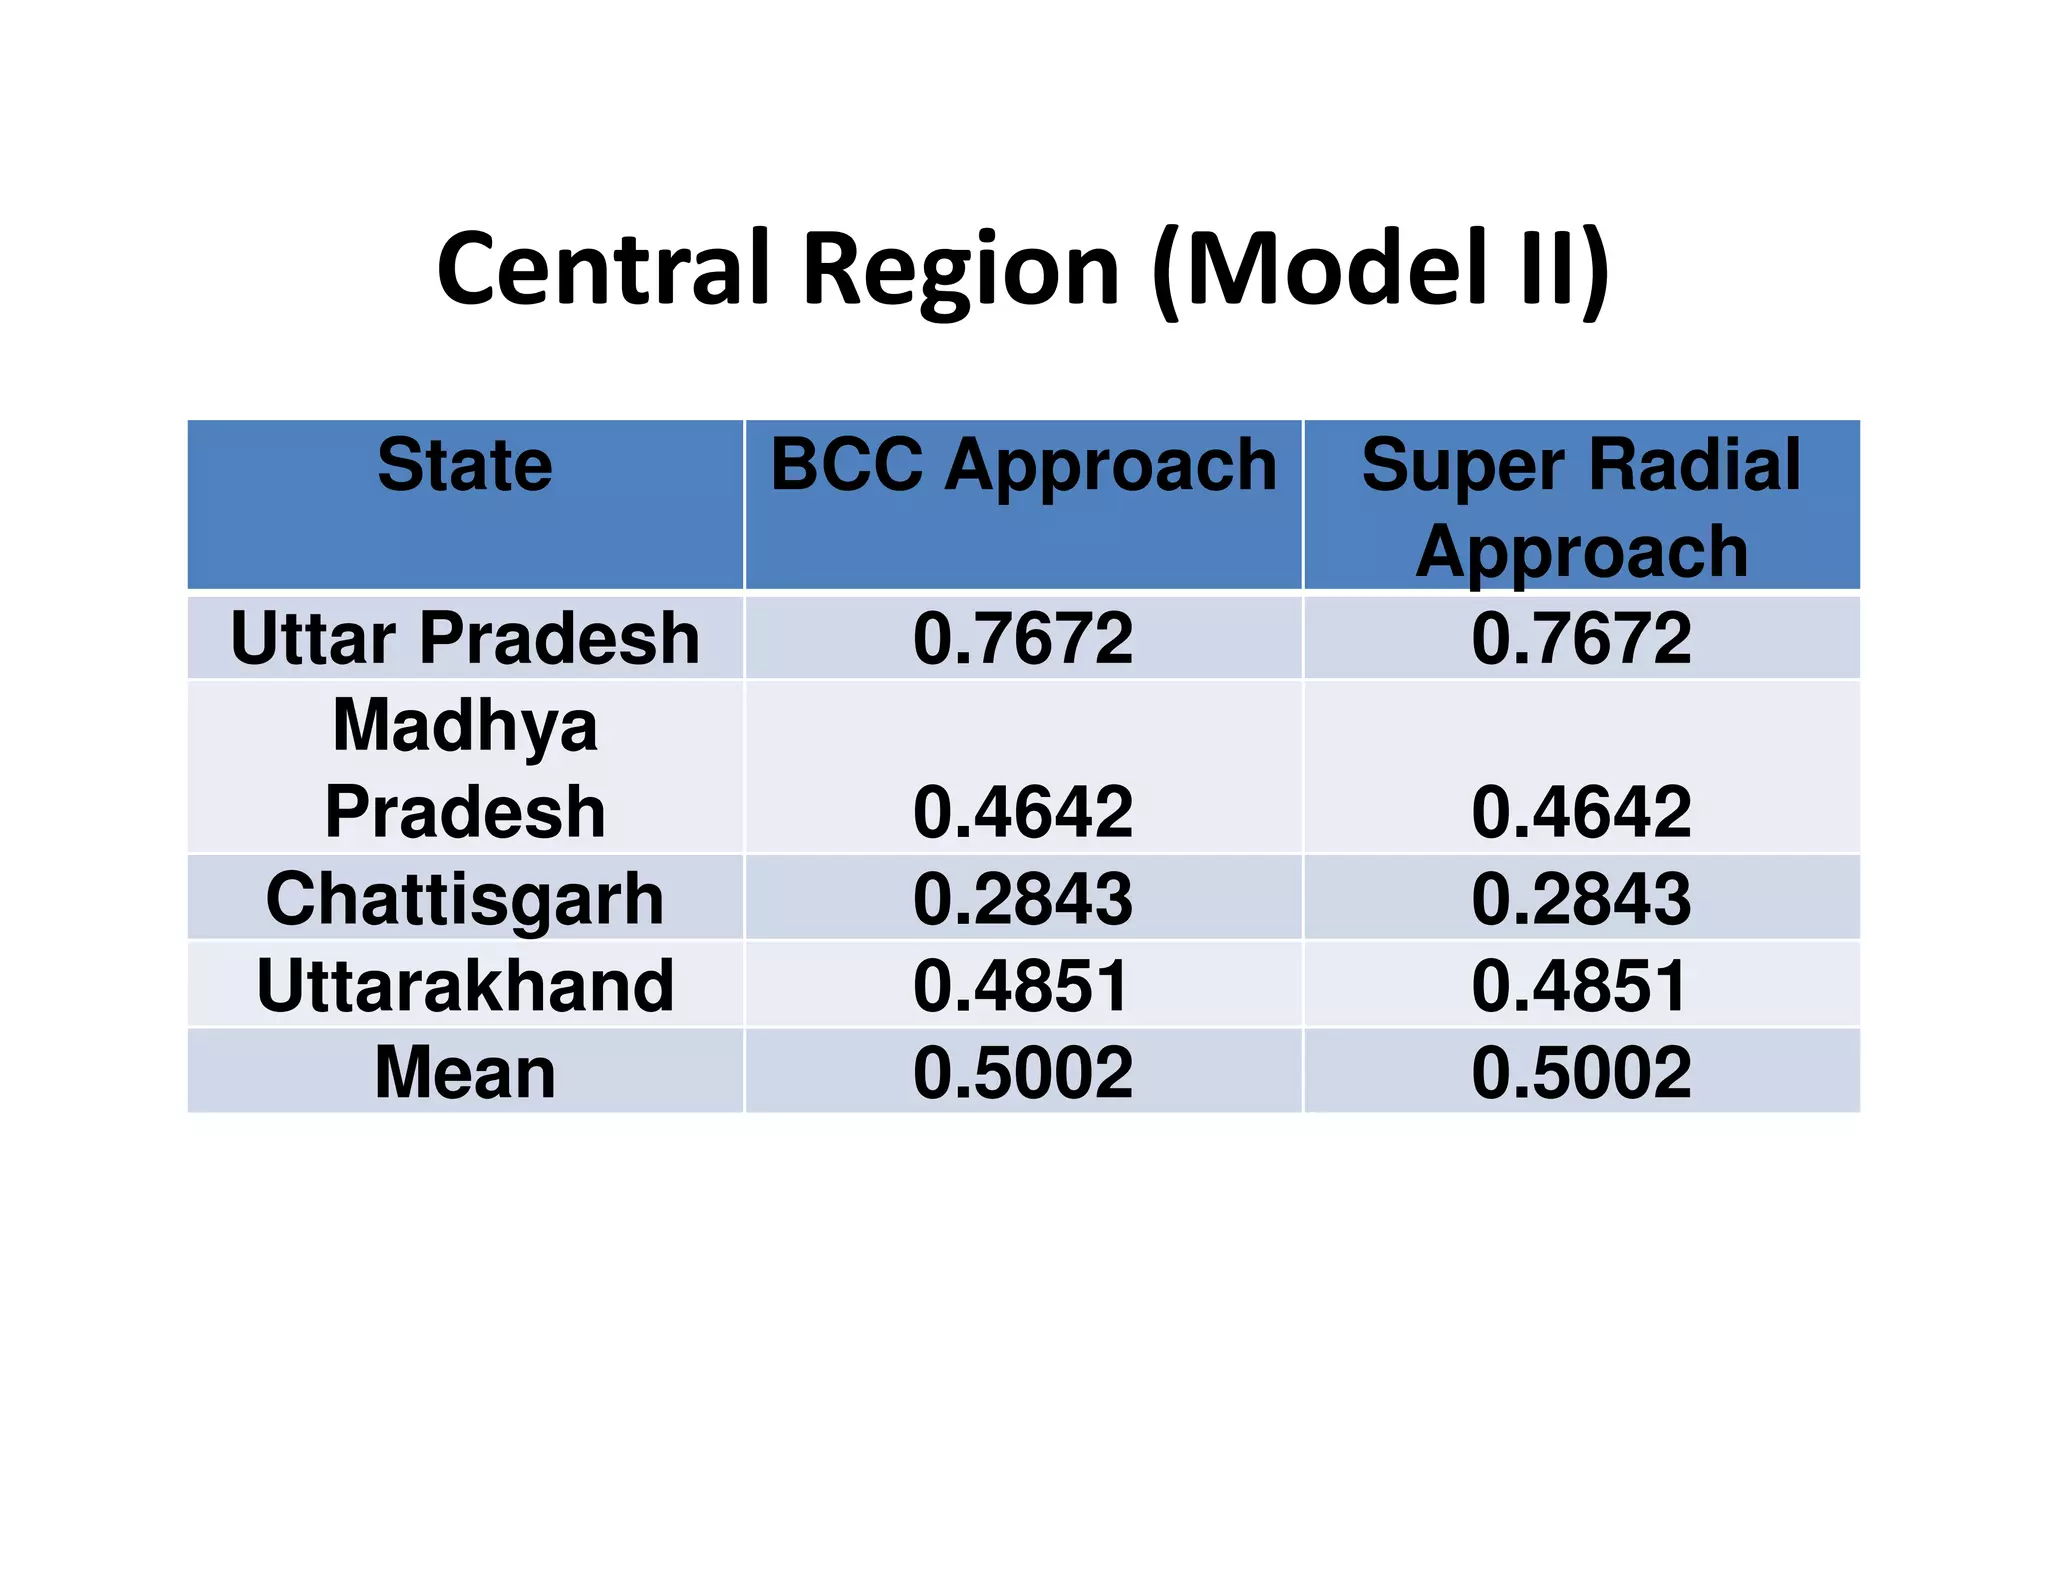
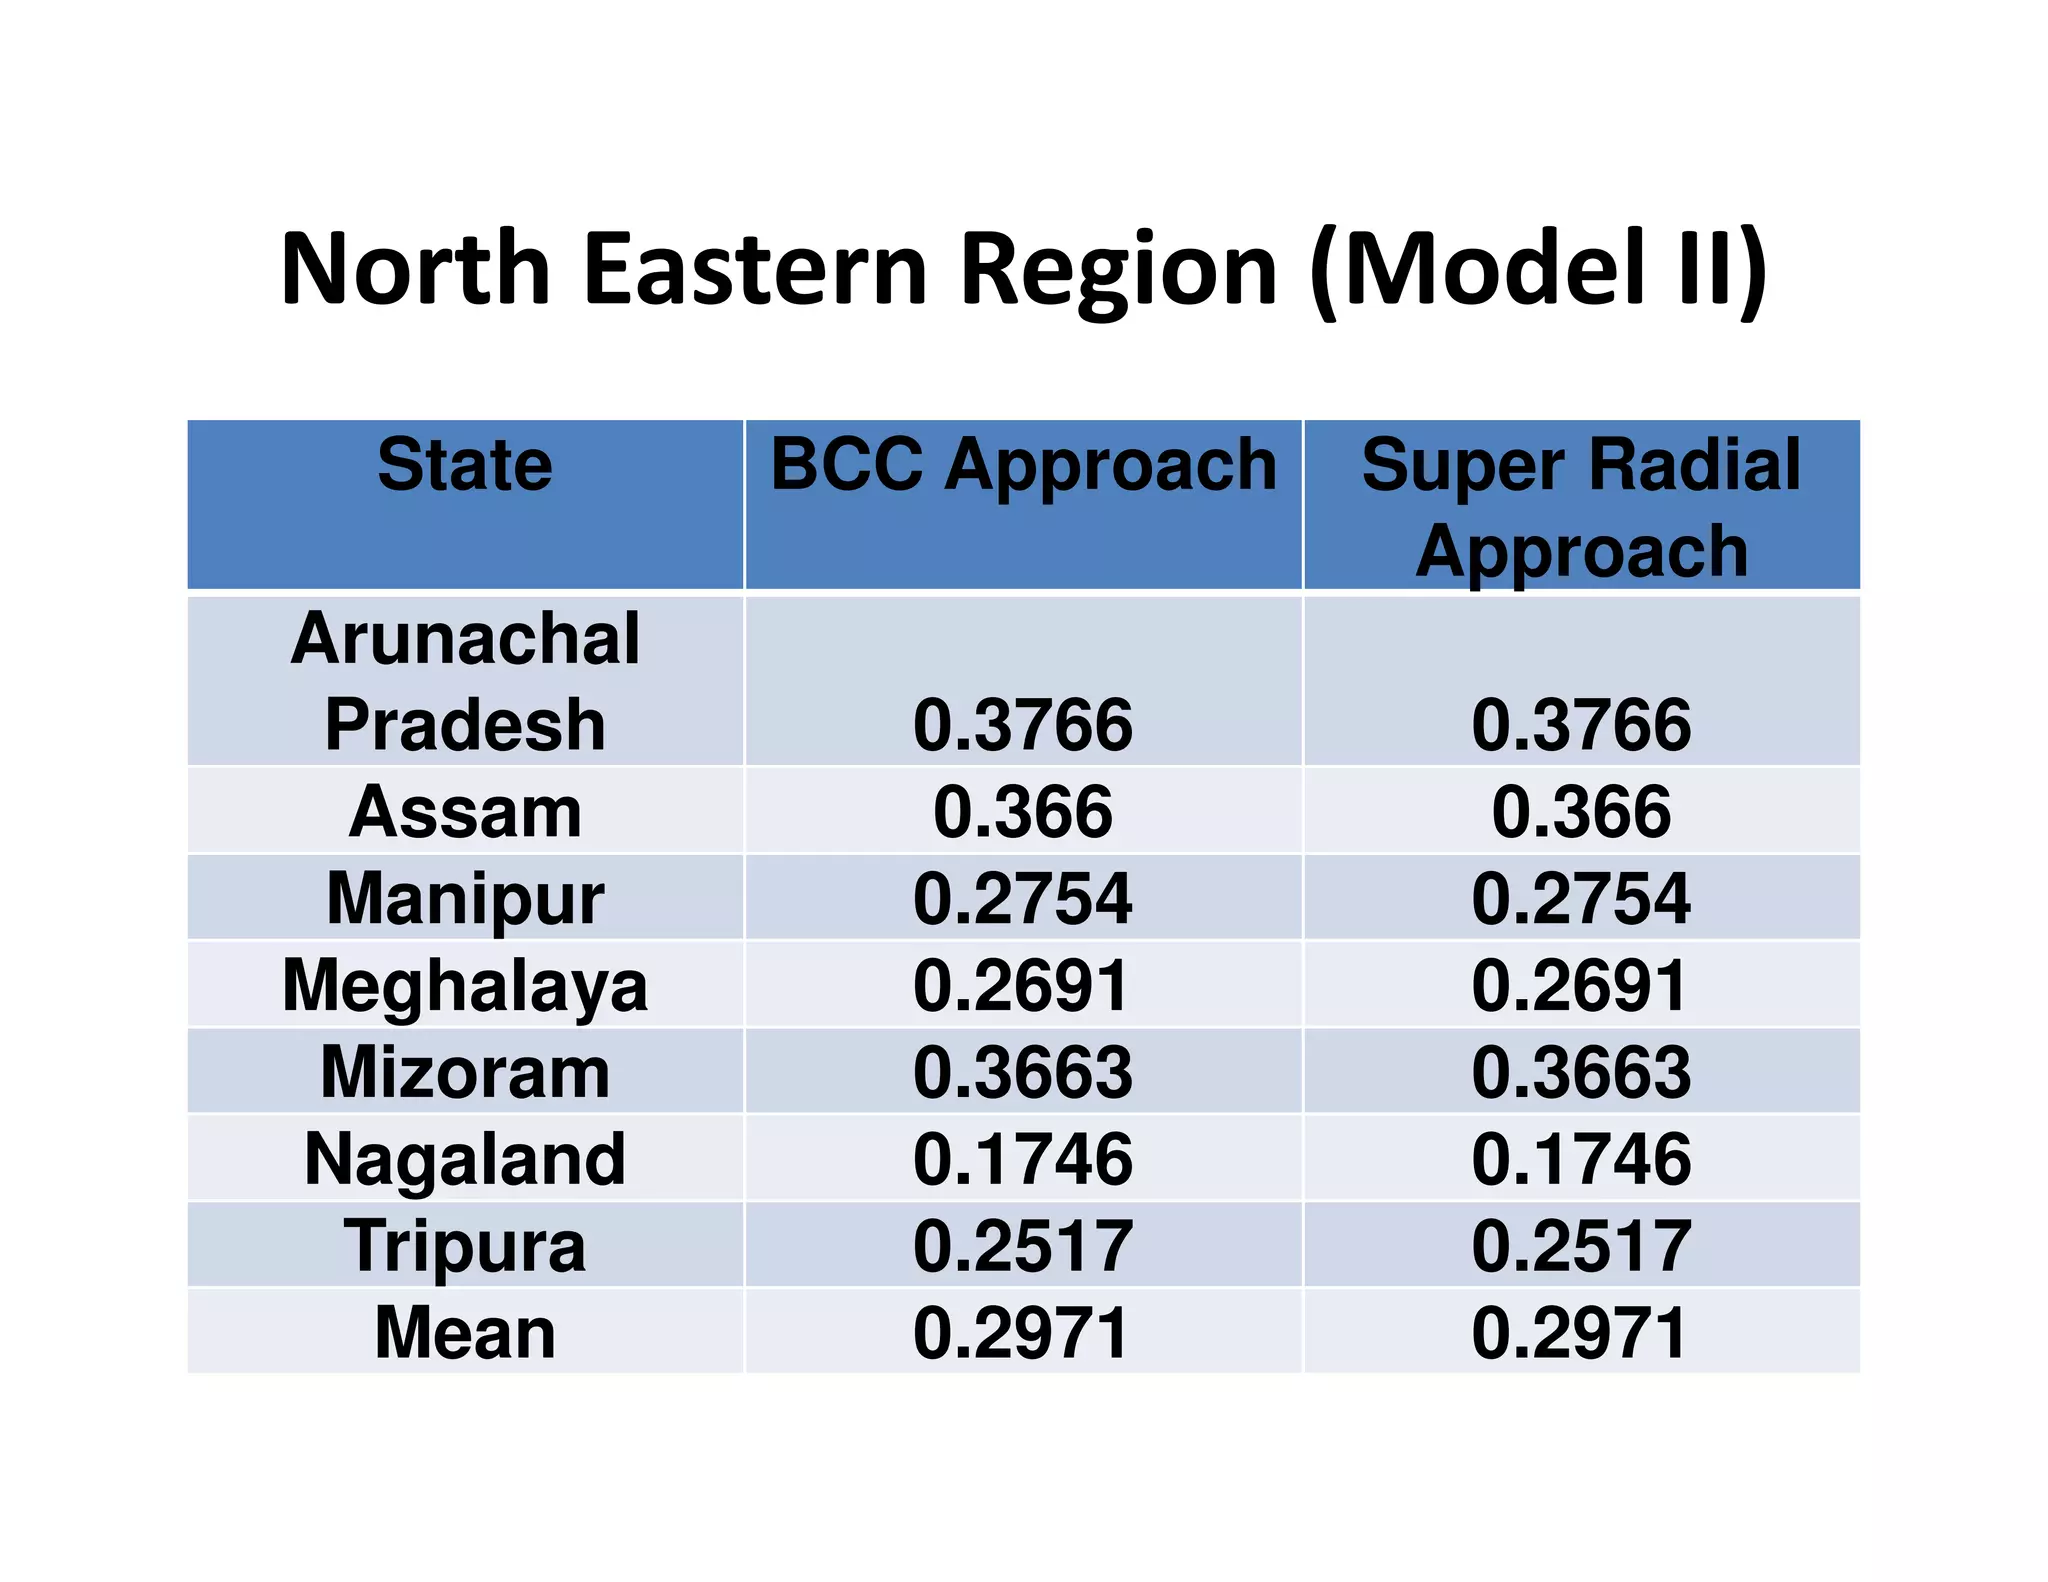
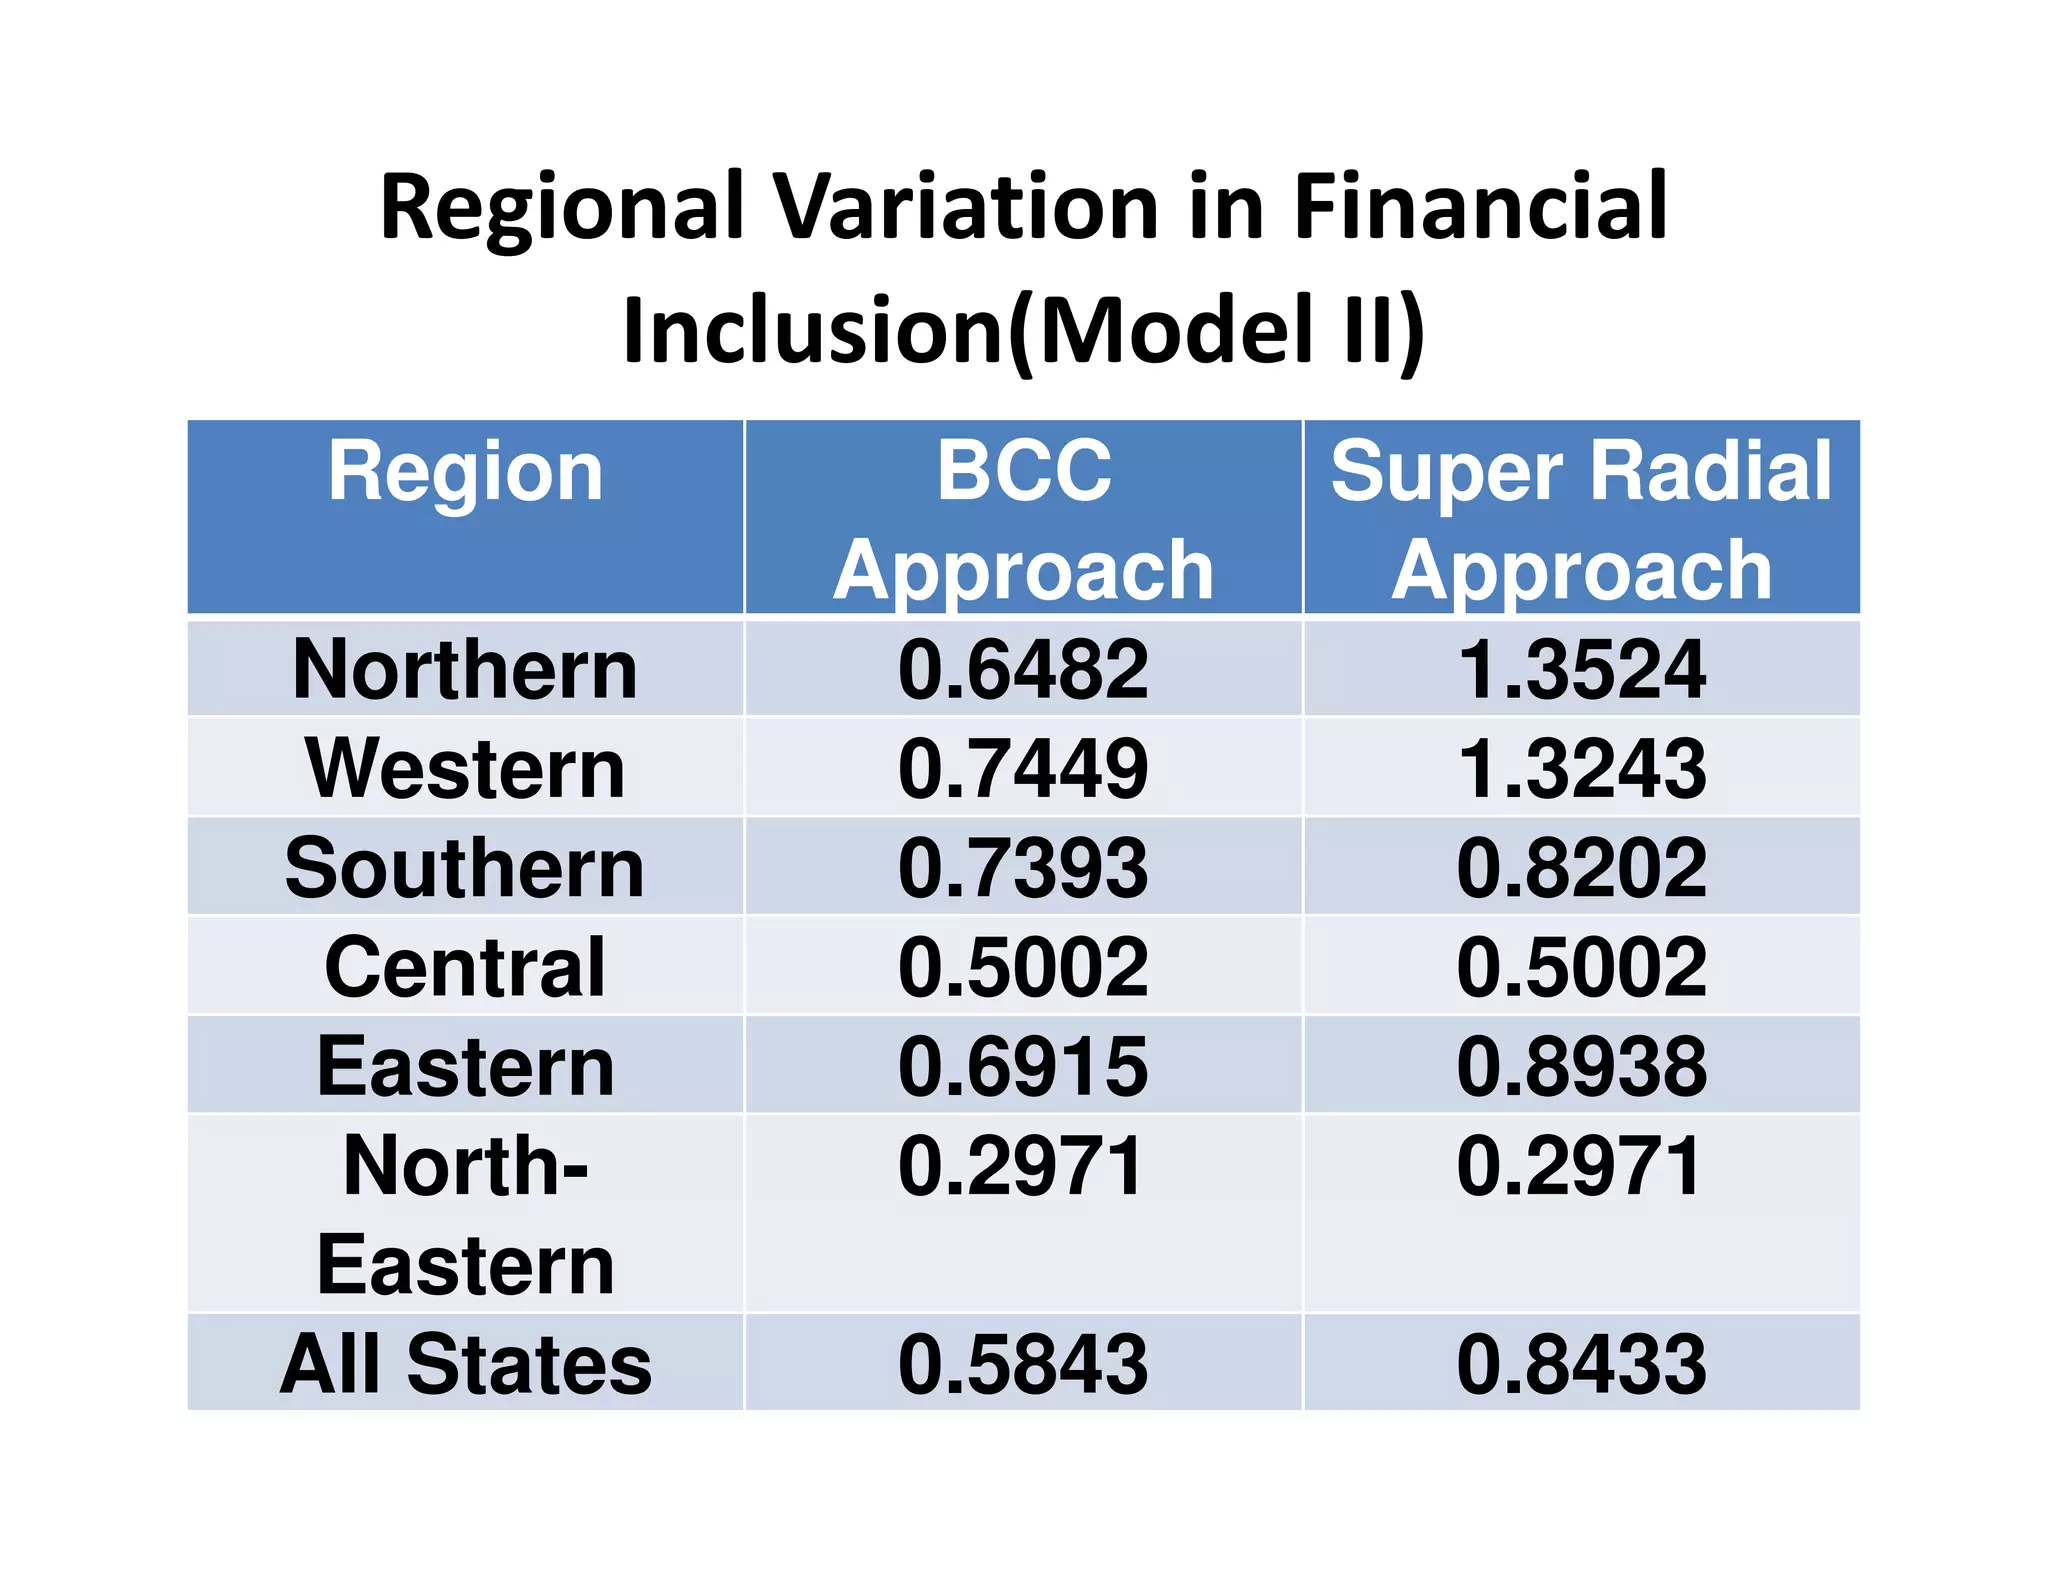

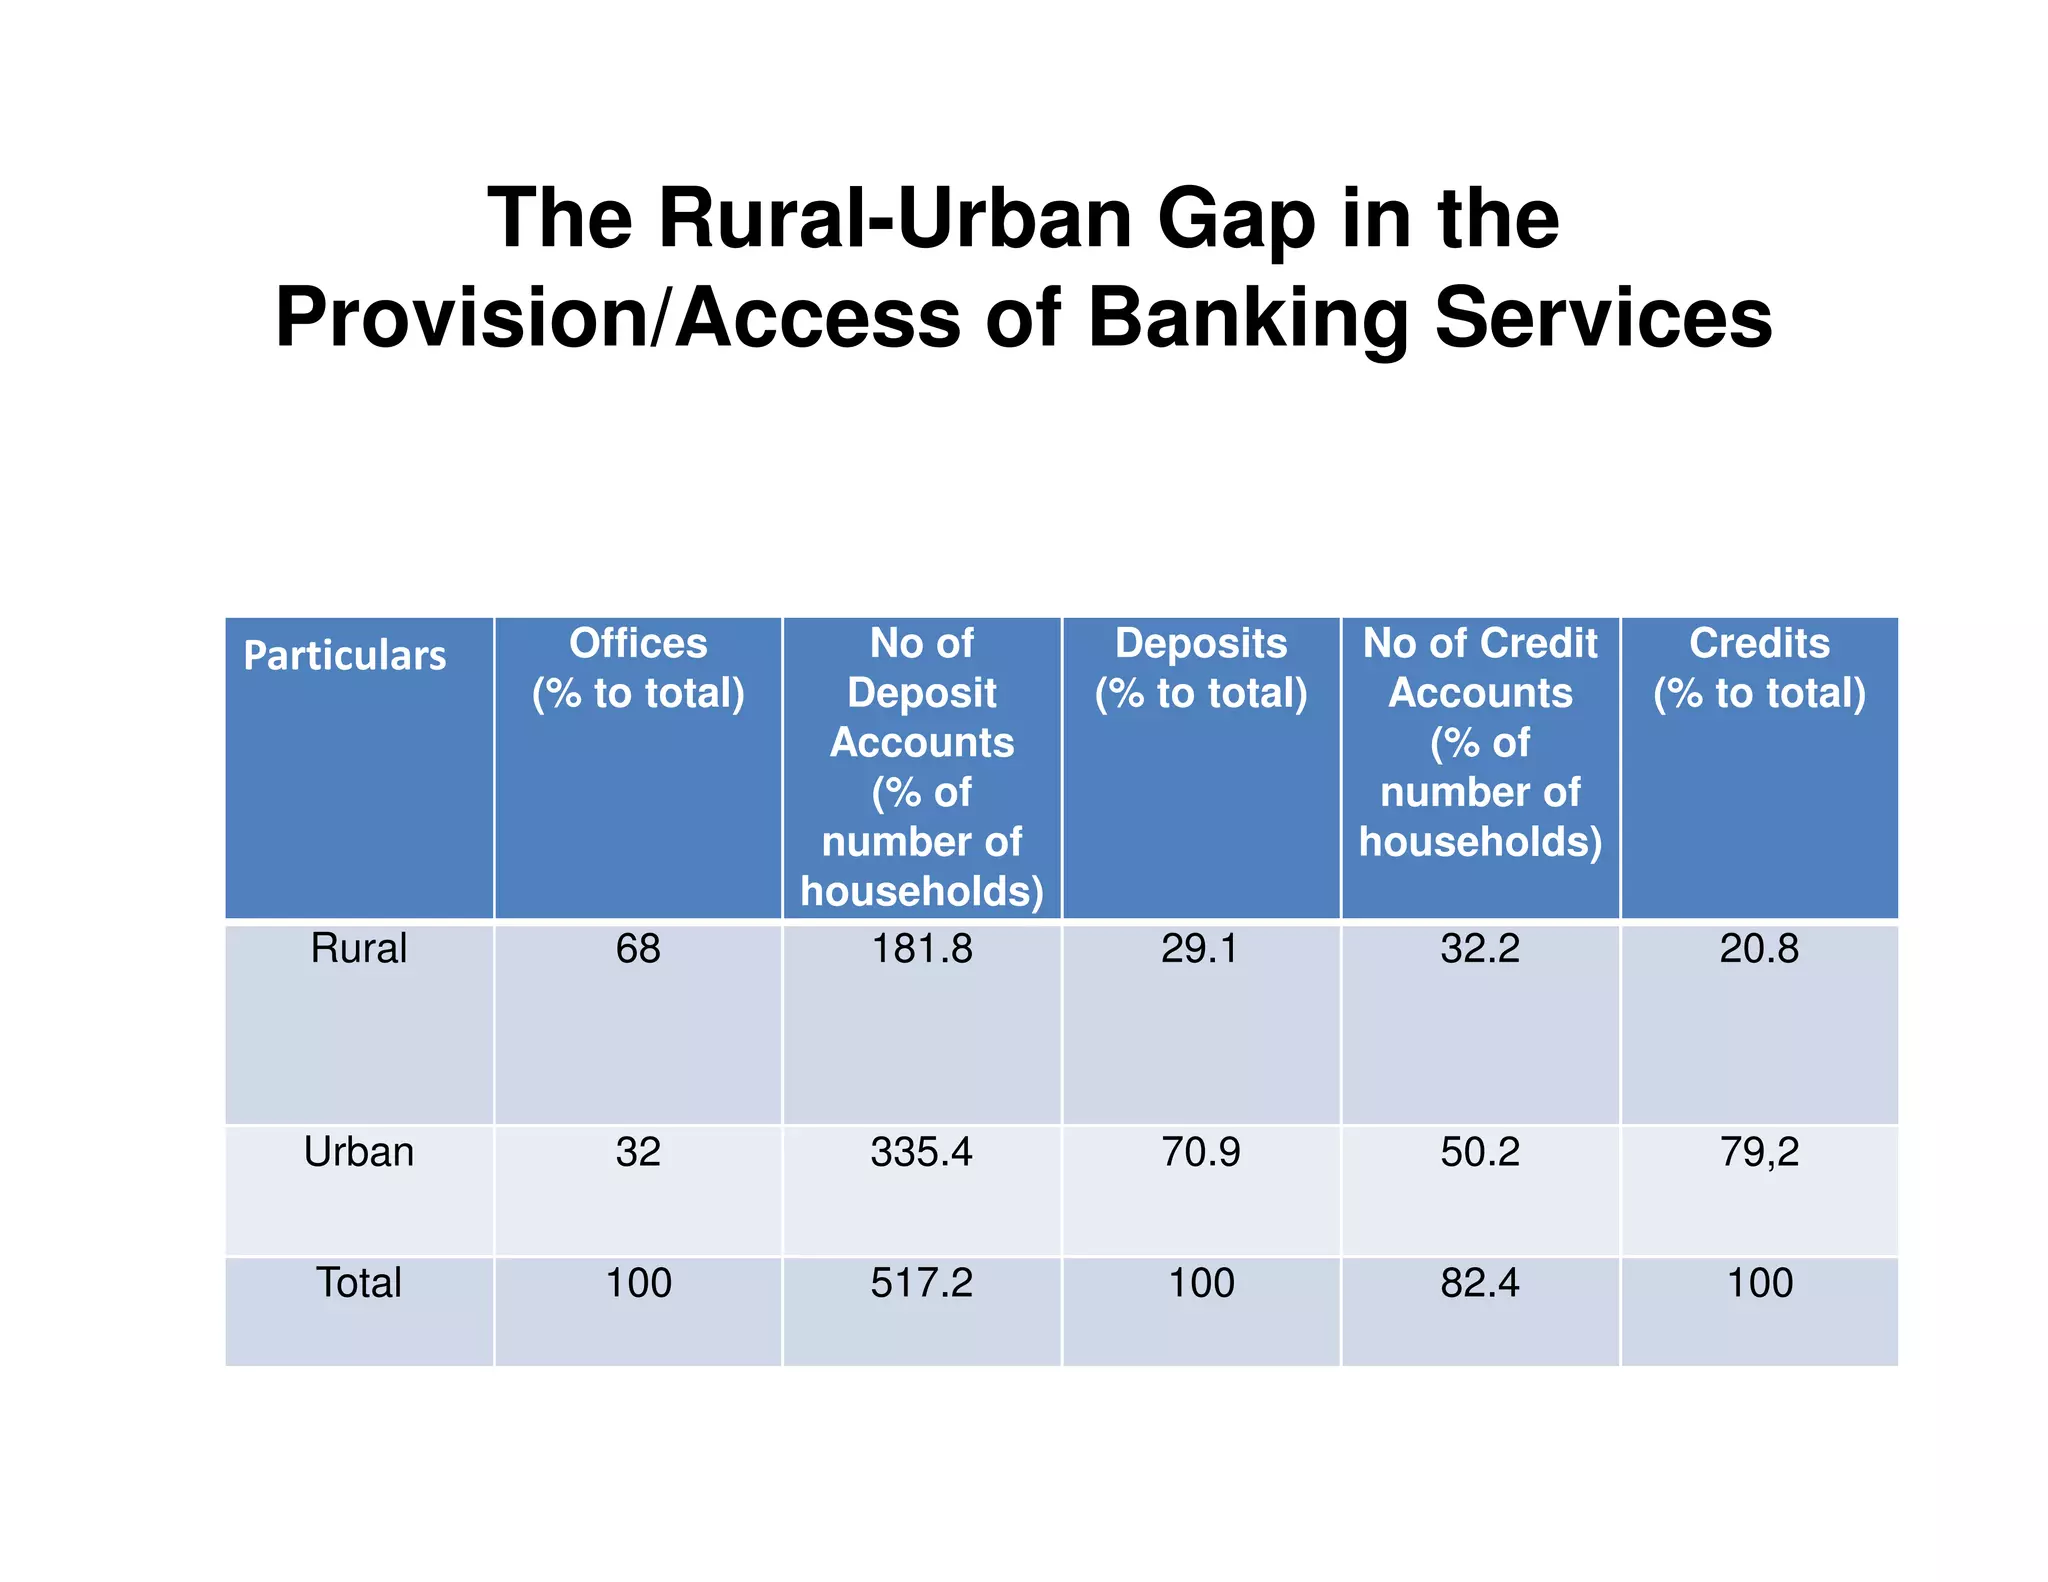
This document analyzes regional disparity in financial inclusion in India using two models. Model I uses a multidimensional index approach to compare states based on deposits, credits, and insurance across regions. The Southern region had the highest index value, while the Eastern region was the lowest. Model II uses a data envelopment analysis approach, finding higher index values for Western and Northern regions compared to the North-Eastern region having the lowest values. Overall, the study finds significant regional variation in financial inclusion across Indian states.


![11.[38 46]the aid of banking sectors in supporting financial inclusion - an i...](https://cdn.slidesharecdn.com/ss_thumbnails/11-38-46theaidofbankingsectorsinsupportingfinancialinclusion-animplementationperspectivefromtamilnadustateindia-120512235803-phpapp02-thumbnail.jpg?width=640&height=640&fit=bounds)


