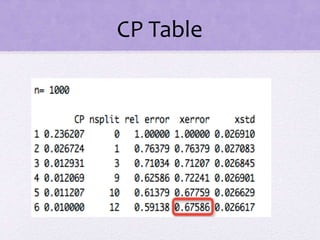
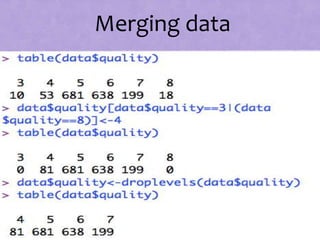
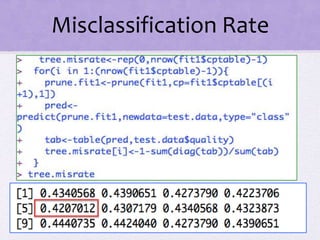
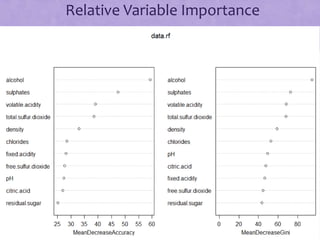
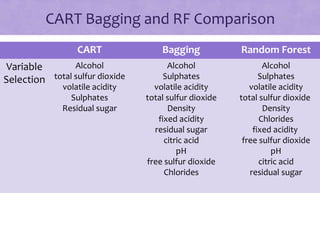
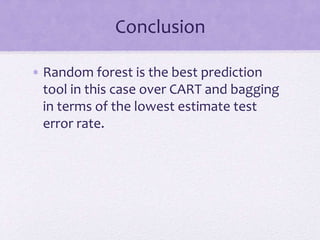
The document evaluates the quality of red wine from the 'vinho verde' region using a dataset with physicochemical and sensory variables. Three methods were applied for analysis: CART, bagging, and random forest, with random forest proving to be the most effective in minimizing test error rates. Key attributes influencing wine quality include alcohol, total sulfur dioxide, volatile acidity, and sulfates.

![Dataset
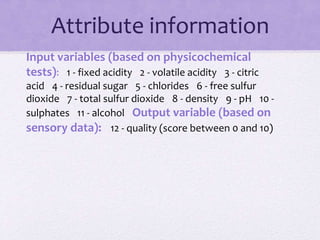
> nrow(data[!complete.cases(data),])
[1] 0
Missing values check](https://image.slidesharecdn.com/teamprojectexst7142classification-160625205605/85/Red-Wine-Quality-Assessment-4-320.jpg)

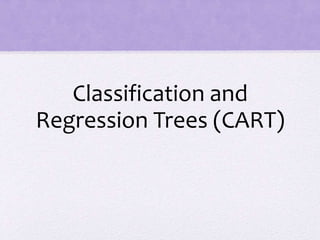
![R code for training set
and test set
B<-20
for(i in 1:B){
set.seed(i)
indexes<-sample(1:nrow(data),size=1000,replace=F)
train<-data[indexes[1:1000],]
test<-data[-indexes[1:1000],]
}](https://image.slidesharecdn.com/teamprojectexst7142classification-160625205605/85/Red-Wine-Quality-Assessment-7-320.jpg)


![[DSC Europe 25] Danilo Djukanovic - From Vibes to KPIs: Turning Culture Into ...](https://cdn.slidesharecdn.com/ss_thumbnails/inqestws5wf0cik2glgv-3-danilo-djukanovic-from-vibes-to-kpis-presentation-260114111931-dacff81f-thumbnail.jpg?width=640&height=640&fit=bounds)
![[DSC Europe 25] Stefan Brankovic - #ResumeIsDead. AI-Powered Interviews and C...](https://cdn.slidesharecdn.com/ss_thumbnails/qnmbsv0xq3uysdrq3sev-2-stefan-brankovic-job-bolt-260114111931-a065aa3d-thumbnail.jpg?width=640&height=640&fit=bounds)
![[DSC Europe 25] Nikola Vasiljevic - Player segmentation by combat playstyles ...](https://cdn.slidesharecdn.com/ss_thumbnails/mnvbf0yvrwaqsipzrrv3-2-nikola-vasiljevic-player-segmentation-by-playstyles-in-action-shooter-games-260114111931-b4d766cd-thumbnail.jpg?width=640&height=640&fit=bounds)


![[DSC Europe 25] Ivica Milaric - The Future of Gaming and AI Tools.pptx](https://cdn.slidesharecdn.com/ss_thumbnails/tijgzsmgse2kj2y5pzzp-5-ivica-milaric-the-future-of-gaming-x-ai-tools-260114111931-87c2b3ac-thumbnail.jpg?width=640&height=640&fit=bounds)
![[DSC Europe 25] Dragan Jerosimovic - The Anatomy of a Narrative Simulation.pdf](https://cdn.slidesharecdn.com/ss_thumbnails/vzputuprdqr6zwbrwdcw-1-dragan-jerosimovic-the-anatomy-of-a-narrative-simulation-260114111931-9d04fba2-thumbnail.jpg?width=640&height=640&fit=bounds)


