Download to read offline


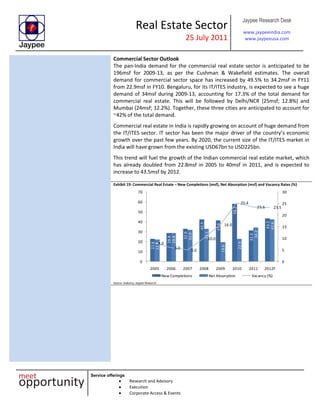


The document provides an analysis of the Indian real estate sector by Jaypee Research Desk. It initiates coverage on 4 real estate companies (Puravankara, Sobha Developers, Prestige Estates, DLF) and updates coverage on 4 others (Orbit, Oberoi Realty, Anant Raj, Godrej Properties). Key recommendations include 'Buy' ratings for Puravankara, Sobha Developers, Prestige Estates, Orbit, Oberoi Realty, and Anant Raj. A 'Neutral' rating is given to DLF and Godrej Properties. The commercial real estate segment is expected to outperform residential due to an IT/ITES recovery and rising salaries, though residential demand will improve due


![India Real Estate Market [2029]: Size, Share, and Competitive Intelligence R...](https://cdn.slidesharecdn.com/ss_thumbnails/indiarealestatemarket-240326095046-e64392ae-thumbnail.jpg?width=640&height=640&fit=bounds)
