Download as PDF, PPTX
![The
Peak
of
Data
Integration
20
23
‘A map says to you. Read me
carefully, follow me closely,
doubt me not …… […]’
Beryl Markham](https://image.slidesharecdn.com/rapidvisualizationofemergencydata-231011213208-5efe0c58/85/Rapid-Visualization-of-Emergency-Data-5-320.jpg)
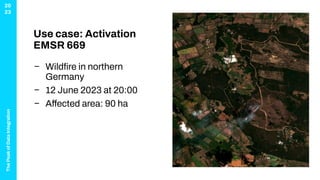
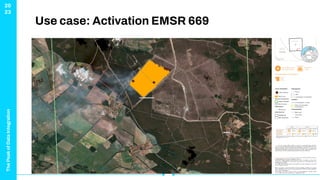
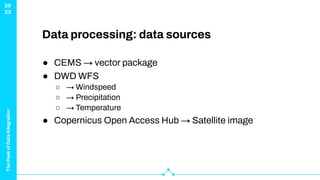

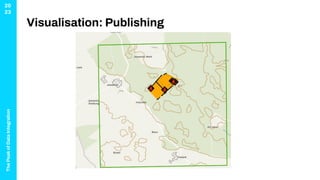

The document outlines the importance of data integration and visualization for emergency management, emphasizing the use of heterogeneous data sources to create comprehensive and timely information. It discusses a specific use case involving the Copernicus Emergency Management Service during a wildfire, illustrating data processing and visualization techniques. Key takeaways highlight the necessity for standardization to improve data reliability and confidence in the displayed information.


![5G Explained! A High Level Overview [Introduction]](https://cdn.slidesharecdn.com/ss_thumbnails/5gexplainedahighleveloverview-260119165306-cc137a3e-thumbnail.jpg?width=640&height=640&fit=bounds)


