SlideShare a Scribd company logo
1 of 3
Rajshree Ltd Case.                     2/7/2011
Project Life                                    5   Years
Units manufacture Per Year               150000
Sale Price                                   118              17700000
Contribution to Sale ratio 1st year           64    %         11328000
Fixed Cost excluding depreciation       2328000     per annum
Initial Insvestment                   18000000
Rate of Depreciation                          15    %
Dep. 1st year                           2700000
Dep. 2nd year                           2295000
Dep. 3rd Year                           1950750
Dep. 4th Year                           1658138
Dep. 5th Year                           1409417
Depreciated Value after 5 years         7986696
Salvage Value of the plant and M/c            30    %             5400000
Tax Rate                                      0.3
                                      1st year      2nd year 3rd Year 4th Year 5th Year
PBT                                     6300000      6705000 7049250 7341863 7590583
Tax                                     1890000      2011500 2114775 2202559 2277175
PAT                                     4410000      4693500 4934475 5139304 5313408
PAT +Dep (Cash Flow)                    7110000      6988500 6885225 6797441 6722825
PV                                      6236842      5377424 4647331 4024631 3491625
NPV                                     8985369

                                                    lacs
Sales Proceed (slavage Value)         180*.3                   54 2804591
Less WDV for 5 years                                        79.86
Short Term Capital loss                                    -25.86
Tax Advantage                                               7.758 402926.2
Rajshree Ltd Case.                     2/7/2011
Project Life                                   5   Years
Units manufacture Per Year               150000
Sale Price                                 112.1             16815000
Contribution to Sale ratio 1st year           64   %         10761600
Fixed Cost excluding depreciation       2328000    per annum
Initial Insvestment                   18000000
Rate of Depreciation                          15   %
Dep. 1st year                           2700000
Dep. 2nd year                           2295000
Dep. 3rd Year                           1950750
Dep. 4th Year                           1658138
Dep. 5th Year                           1409417
Depreciated Value after 5 years         7986696
Salvage Value of the plant and M/c            30   %             5400000
Tax Rate                                     0.3
                                      1st year     2nd year 3rd Year 4th Year 5th Year
PBT                                     5733600     6138600 6482850 6775463 7024183
Tax                                     1720080     1841580 1944855 2032639 2107255
PAT                                     4013520     4297020 4537995 4742824 4916928
PAT +Dep (Cash Flow)                    6713520     6592020 6488745 6400961 6326345
PV                                      5889053     5072345 4379718 3789883 3285705
NPV                                     7624221

                                                   lacs
Sales Proceed (slavage Value)         180*.3                  54 2804591
Less WDV for 5 years                                       79.86
Short Term Capital loss                                   -25.86
Tax Advantage                                              7.758 402926.2
Rajshree Ltd Case.                     2/7/2011
Project Life                                    5   Years
Units manufacture Per Year               150000
Sale Price                                   118              17700000
Contribution to Sale ratio 1st year           64    %         11328000
Fixed Cost excluding depreciation       2328000     per annum
Initial Insvestment                   19980000
Rate of Depreciation                          15    %
Dep. 1st year                           2997000
Dep. 2nd year                           2547450
Dep. 3rd Year                           2165333
Dep. 4th Year                           1840533
Dep. 5th Year                           1564453
Depreciated Value after 5 years         8865232
Salvage Value of the plant and M/c            30    %             5994000
Tax Rate                                      0.3
                                      1st year      2nd year 3rd Year 4th Year 5th Year
PBT                                     6003000      6452550 6834668 7159467 7435547
Tax                                     1800900      1935765 2050400 2147840 2230664
PAT                                     4202100      4516785 4784267 5011627 5204883
PAT +Dep (Cash Flow)                    7199100      7064235 6949600 6852160 6769336
PV                                      6315000      5435699 4690782 4057029 3515781
NPV                                     7594719

                                                    lacs
Sales Proceed (slavage Value)                               59.94 3113096
Less WDV for 5 years                                        88.65
Short Term Capital loss                                    -28.71
Tax Advantage                                               8.613 447332.2

More Related Content

Similar to Rajshree case

Example Presentation Of Financial Reports PowerPoint Presentation Slides
Example Presentation Of Financial Reports PowerPoint Presentation Slides Example Presentation Of Financial Reports PowerPoint Presentation Slides
Example Presentation Of Financial Reports PowerPoint Presentation Slides SlideTeam
 
Press Release 3 Q99 Tele Celular Sul En
Press Release 3 Q99   Tele Celular Sul EnPress Release 3 Q99   Tele Celular Sul En
Press Release 3 Q99 Tele Celular Sul EnTIM RI
 
Example Presentation Of Financial Reports Powerpoint Presentation Slides
Example Presentation Of Financial Reports Powerpoint Presentation SlidesExample Presentation Of Financial Reports Powerpoint Presentation Slides
Example Presentation Of Financial Reports Powerpoint Presentation SlidesSlideTeam
 
Voltas Q4FY15: Firstcall recommend 'Buy'
Voltas Q4FY15: Firstcall recommend 'Buy'Voltas Q4FY15: Firstcall recommend 'Buy'
Voltas Q4FY15: Firstcall recommend 'Buy'IndiaNotes.com
 
Third Quarter of Fiscal Year Ending March 2021 (FY2020) Financial Highlights
Third Quarter of Fiscal Year Ending March 2021 (FY2020) Financial HighlightsThird Quarter of Fiscal Year Ending March 2021 (FY2020) Financial Highlights
Third Quarter of Fiscal Year Ending March 2021 (FY2020) Financial HighlightsRicohLease
 
Excel Model for Valuation of Natural Gas Firm
Excel Model for Valuation of Natural Gas FirmExcel Model for Valuation of Natural Gas Firm
Excel Model for Valuation of Natural Gas FirmFlevy.com Best Practices
 
Webcast 3Q10
Webcast 3Q10Webcast 3Q10
Webcast 3Q10TIM RI
 
Webcast 3 q10 eng
Webcast 3 q10 engWebcast 3 q10 eng
Webcast 3 q10 engTIM RI
 
Welspun Corp's net jumps to Rs163.80 mn in Q1FY16; Maintain buy
Welspun Corp's net jumps to Rs163.80 mn in Q1FY16; Maintain buyWelspun Corp's net jumps to Rs163.80 mn in Q1FY16; Maintain buy
Welspun Corp's net jumps to Rs163.80 mn in Q1FY16; Maintain buyIndiaNotes.com
 

Similar to Rajshree case (20)

Results Tracker 16.08.2012,
Results Tracker 16.08.2012,Results Tracker 16.08.2012,
Results Tracker 16.08.2012,
 
Example Presentation Of Financial Reports PowerPoint Presentation Slides
Example Presentation Of Financial Reports PowerPoint Presentation Slides Example Presentation Of Financial Reports PowerPoint Presentation Slides
Example Presentation Of Financial Reports PowerPoint Presentation Slides
 
Press Release 3 Q99 Tele Celular Sul En
Press Release 3 Q99   Tele Celular Sul EnPress Release 3 Q99   Tele Celular Sul En
Press Release 3 Q99 Tele Celular Sul En
 
Q1FY12 Results Tracker 17th August
 Q1FY12 Results Tracker 17th August Q1FY12 Results Tracker 17th August
Q1FY12 Results Tracker 17th August
 
Week 5
Week 5Week 5
Week 5
 
Results Tracker 13.07.2012,
Results Tracker 13.07.2012,Results Tracker 13.07.2012,
Results Tracker 13.07.2012,
 
Results Tracker 19.07.2012,
Results Tracker 19.07.2012,Results Tracker 19.07.2012,
Results Tracker 19.07.2012,
 
Example Presentation Of Financial Reports Powerpoint Presentation Slides
Example Presentation Of Financial Reports Powerpoint Presentation SlidesExample Presentation Of Financial Reports Powerpoint Presentation Slides
Example Presentation Of Financial Reports Powerpoint Presentation Slides
 
Dpr
DprDpr
Dpr
 
Results tracker 18th August 2011
Results tracker 18th August 2011Results tracker 18th August 2011
Results tracker 18th August 2011
 
Voltas Q4FY15: Firstcall recommend 'Buy'
Voltas Q4FY15: Firstcall recommend 'Buy'Voltas Q4FY15: Firstcall recommend 'Buy'
Voltas Q4FY15: Firstcall recommend 'Buy'
 
Third Quarter of Fiscal Year Ending March 2021 (FY2020) Financial Highlights
Third Quarter of Fiscal Year Ending March 2021 (FY2020) Financial HighlightsThird Quarter of Fiscal Year Ending March 2021 (FY2020) Financial Highlights
Third Quarter of Fiscal Year Ending March 2021 (FY2020) Financial Highlights
 
Results Tracker 16.07.2012,
Results Tracker 16.07.2012,Results Tracker 16.07.2012,
Results Tracker 16.07.2012,
 
Results Tracker 23.07.2012,
Results Tracker 23.07.2012,Results Tracker 23.07.2012,
Results Tracker 23.07.2012,
 
Q2FY12 Results Tracker 13.10.11
Q2FY12 Results Tracker 13.10.11Q2FY12 Results Tracker 13.10.11
Q2FY12 Results Tracker 13.10.11
 
Excel Model for Valuation of Natural Gas Firm
Excel Model for Valuation of Natural Gas FirmExcel Model for Valuation of Natural Gas Firm
Excel Model for Valuation of Natural Gas Firm
 
Results Tracker 02.08.2012,
Results Tracker 02.08.2012,Results Tracker 02.08.2012,
Results Tracker 02.08.2012,
 
Webcast 3Q10
Webcast 3Q10Webcast 3Q10
Webcast 3Q10
 
Webcast 3 q10 eng
Webcast 3 q10 engWebcast 3 q10 eng
Webcast 3 q10 eng
 
Welspun Corp's net jumps to Rs163.80 mn in Q1FY16; Maintain buy
Welspun Corp's net jumps to Rs163.80 mn in Q1FY16; Maintain buyWelspun Corp's net jumps to Rs163.80 mn in Q1FY16; Maintain buy
Welspun Corp's net jumps to Rs163.80 mn in Q1FY16; Maintain buy
 

More from Kinshook Chaturvedi (20)

Working and functions_of_rbi[1]
Working and functions_of_rbi[1]Working and functions_of_rbi[1]
Working and functions_of_rbi[1]
 
Role of idfc_in_infrastucture_finance
Role of idfc_in_infrastucture_financeRole of idfc_in_infrastucture_finance
Role of idfc_in_infrastucture_finance
 
Mutual funds
Mutual fundsMutual funds
Mutual funds
 
Iifcl ppt
Iifcl pptIifcl ppt
Iifcl ppt
 
Basel ii norms.ppt
Basel ii norms.pptBasel ii norms.ppt
Basel ii norms.ppt
 
Retail banking pres
Retail banking presRetail banking pres
Retail banking pres
 
Presentation on lic of india
Presentation on lic of indiaPresentation on lic of india
Presentation on lic of india
 
Mfi dfi
Mfi dfiMfi dfi
Mfi dfi
 
Management of np as imt
Management of np as imtManagement of np as imt
Management of np as imt
 
Life insurance in india final raja
Life insurance in india final rajaLife insurance in india final raja
Life insurance in india final raja
 
Financial inclusion
Financial inclusionFinancial inclusion
Financial inclusion
 
Corporate banking v2
Corporate banking v2Corporate banking v2
Corporate banking v2
 
Corporate banking latest
Corporate banking latestCorporate banking latest
Corporate banking latest
 
Financial mgt exercises
Financial mgt exercisesFinancial mgt exercises
Financial mgt exercises
 
Csac10[1].p
Csac10[1].pCsac10[1].p
Csac10[1].p
 
Csac08[1].p
Csac08[1].pCsac08[1].p
Csac08[1].p
 
Csac05[1].p
Csac05[1].pCsac05[1].p
Csac05[1].p
 
Csac14[1].p
Csac14[1].pCsac14[1].p
Csac14[1].p
 
Csac06[1].p
Csac06[1].pCsac06[1].p
Csac06[1].p
 
Xyber001 16 12_09 (2)
Xyber001 16 12_09 (2)Xyber001 16 12_09 (2)
Xyber001 16 12_09 (2)
 

Rajshree case

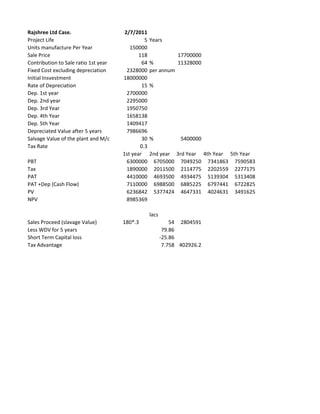
  • 1. Rajshree Ltd Case. 2/7/2011 Project Life 5 Years Units manufacture Per Year 150000 Sale Price 118 17700000 Contribution to Sale ratio 1st year 64 % 11328000 Fixed Cost excluding depreciation 2328000 per annum Initial Insvestment 18000000 Rate of Depreciation 15 % Dep. 1st year 2700000 Dep. 2nd year 2295000 Dep. 3rd Year 1950750 Dep. 4th Year 1658138 Dep. 5th Year 1409417 Depreciated Value after 5 years 7986696 Salvage Value of the plant and M/c 30 % 5400000 Tax Rate 0.3 1st year 2nd year 3rd Year 4th Year 5th Year PBT 6300000 6705000 7049250 7341863 7590583 Tax 1890000 2011500 2114775 2202559 2277175 PAT 4410000 4693500 4934475 5139304 5313408 PAT +Dep (Cash Flow) 7110000 6988500 6885225 6797441 6722825 PV 6236842 5377424 4647331 4024631 3491625 NPV 8985369 lacs Sales Proceed (slavage Value) 180*.3 54 2804591 Less WDV for 5 years 79.86 Short Term Capital loss -25.86 Tax Advantage 7.758 402926.2
  • 2. Rajshree Ltd Case. 2/7/2011 Project Life 5 Years Units manufacture Per Year 150000 Sale Price 112.1 16815000 Contribution to Sale ratio 1st year 64 % 10761600 Fixed Cost excluding depreciation 2328000 per annum Initial Insvestment 18000000 Rate of Depreciation 15 % Dep. 1st year 2700000 Dep. 2nd year 2295000 Dep. 3rd Year 1950750 Dep. 4th Year 1658138 Dep. 5th Year 1409417 Depreciated Value after 5 years 7986696 Salvage Value of the plant and M/c 30 % 5400000 Tax Rate 0.3 1st year 2nd year 3rd Year 4th Year 5th Year PBT 5733600 6138600 6482850 6775463 7024183 Tax 1720080 1841580 1944855 2032639 2107255 PAT 4013520 4297020 4537995 4742824 4916928 PAT +Dep (Cash Flow) 6713520 6592020 6488745 6400961 6326345 PV 5889053 5072345 4379718 3789883 3285705 NPV 7624221 lacs Sales Proceed (slavage Value) 180*.3 54 2804591 Less WDV for 5 years 79.86 Short Term Capital loss -25.86 Tax Advantage 7.758 402926.2
  • 3. Rajshree Ltd Case. 2/7/2011 Project Life 5 Years Units manufacture Per Year 150000 Sale Price 118 17700000 Contribution to Sale ratio 1st year 64 % 11328000 Fixed Cost excluding depreciation 2328000 per annum Initial Insvestment 19980000 Rate of Depreciation 15 % Dep. 1st year 2997000 Dep. 2nd year 2547450 Dep. 3rd Year 2165333 Dep. 4th Year 1840533 Dep. 5th Year 1564453 Depreciated Value after 5 years 8865232 Salvage Value of the plant and M/c 30 % 5994000 Tax Rate 0.3 1st year 2nd year 3rd Year 4th Year 5th Year PBT 6003000 6452550 6834668 7159467 7435547 Tax 1800900 1935765 2050400 2147840 2230664 PAT 4202100 4516785 4784267 5011627 5204883 PAT +Dep (Cash Flow) 7199100 7064235 6949600 6852160 6769336 PV 6315000 5435699 4690782 4057029 3515781 NPV 7594719 lacs Sales Proceed (slavage Value) 59.94 3113096 Less WDV for 5 years 88.65 Short Term Capital loss -28.71 Tax Advantage 8.613 447332.2