
More Related Content
Recently uploaded
Recently uploaded (20)
Featured
Featured (20)
Quaterly fund review q4 2010
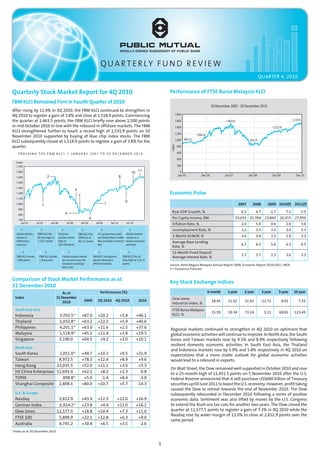
- 1. QUARTERLY FUND REVIEW QUARTER 4, 2010 Quarterly Stock Market Report for 4Q 2010 Performance of FTSE Bursa Malaysia KLCI FBM KLCI Remained Firm in Fourth Quarter of 2010 30 December 2005 - 30 December 2010 After rising by 11.4% in 3Q 2010, the FBM KLCI continued to strengthen in 4Q 2010 to register a gain of 3.8% and close at 1,518.9 points. Commencing 1,800 the quarter at 1,463.5 points, the FBM KLCI briefly rose above 1,500 points 1,600 1,445.03 1,518.91 in mid-October 2010 in line with the rebound in offshore markets. The FBM 1,400 1,272.78 KLCI strengthened further to touch a record high of 1,531.9 points on 10 1,200 November 2010 supported by buying of blue chip index stocks. The FBM 1,096.24 1,000 899.79 KLCI subsequently closed at 1,518.9 points to register a gain of 3.8% for the 876.75 quarter. 800 Index TRACKING THE FBM KLCI: 1 JANUARY 2007 TO 30 DECEMBER 2010 600 400 Index 1,700 200 1,600 11 10 0 2 8 Dec-05 Dec-06 Dec-07 Dec-08 Dec-09 Dec-10 1,500 1,400 1,300 3 1,200 5 Economic Pulse 1,100 7 9 1,000 1 2007 2008 2009 2010(f) 2011(f) 900 4 Real GDP Growth, % 6.5 4.7 -1.7 7.1 5.5 800 6 Per Capita Income, RM 23,033 25,784 23,842 26,355 27,950 700 Jan 07 Jul 07 Jan 08 Jul 08 Jan 09 Jul 09 Jan 10 Jul 10 Inflation Rate, % 2.0 5.4 0.6 2.0 3.0 1 2 3 4 5 6 Unemployment Rate, % 3.2 3.3 3.5 3.4 3.3 ...................... ...................... ...................... ...................... ...................... ...................... Global markets FBM KLCI hits Oil prices FBM KLCI hits U.S. government bails Global markets retreat on all time high of touches record 2008 low of out Fannie Mae, Freddie retreat on a 3-Month KLIBOR, % 3.6 3.4 2.2 2.9 3.3 in ationary 1,524.7 points high of 801.27 points Mac and takes control of slower economic Average Base Lending concerns US$146/barrel AIG activities 6.7 6.5 5.6 6.3 6.5 Rate, % ...................... ...................... ...................... ...................... ...................... 7 8 9 10 11 12-Month Fixed Deposit 3.7 3.7 2.5 3.0 3.3 FBM KLCI breaks FBM KLCI breaks Global markets retreat FBM KLCI strengthens FBM KLCI hits all Average Interest Rate, % 1,000 points 1,300 points on concerns over the admist rebound in time high of 1,531.9 European sovereign o shore markets points Source: Bank Negara Malaysia Annual Report 2009, Economic Report 2010/2011, MOF. debt crisis f = Consensus Forecast Comparison of Stock Market Performance as at Key Stock Exchange Indices 31 December 2010 As at Performance (%) 6-month 1-year 2-year 3-year 5-year 10-year Index 31 December Dow Jones 2010 2009 3Q 2010 4Q 2010 2010 18.45 11.02 31.92 -12.72 8.02 7.33 Industrial Index, % South East Asia FTSE Bursa Malaysia 15.59 19.34 73.24 5.11 68.81 123.49 Indonesia 3,703.5^ +87.0 +20.2 +5.8 +46.1 KLCI, % Thailand 1,032.8^ +63.2 +22.3 +5.9 +40.6 Philippines 4,201.1^ +63.0 +21.6 +2.5 +37.6 Regional markets continued to strengthen in 4Q 2010 on optimism that Malaysia 1,518.9^ +45.2 +11.4 +3.8 +19.3 global economic activities will continue to improve. In North Asia, the South Singapore 3,190.0 +64.5 +9.2 +3.0 +10.1 Korea and Taiwan markets rose by 9.5% and 8.9% respectively following resilient domestic economic activities. In South East Asia, the Thailand North Asia and Indonesia markets rose by 5.9% and 5.8% respectively in 4Q 2010 on South Korea 2,051.0^ +49.7 +10.3 +9.5 +21.9 expectations that a more stable outlook for global economic activities Taiwan 8,972.5 +78.3 +12.4 +8.9 +9.6 would lead to a rebound in exports. Hong Kong 23,035.5 +52.0 +11.1 +3.0 +5.3 On Wall Street, the Dow remained well supported in October 2010 and rose HS China Enterprises 12,692.4 +62.1 +8.2 +2.3 -0.8 to a 25-month high of 11,451.5 points on 5 November 2010 after the U.S. TOPIX 898.8^ +5.6 -1.4 +8.4 -1.0 Federal Reserve announced that it will purchase US$600 billion of Treasury Shanghai Composite 2,808.1 +80.0 +10.7 +5.7 -14.3 securities up till June 2011 to boost the U.S. economy. However, profit taking caused the Dow to retreat towards the end of November 2010. The Dow U.S. & Europe subsequently rebounded in December 2010 following a series of positive Nasdaq 2,652.9 +43.9 +12.3 +12.0 +16.9 economic data. Sentiment was also lifted by moves by the U.S. Congress German Index 6,914.2^ +23.8 +4.4 +11.0 +16.1 to extend the Bush-era tax cuts for another two years. The Dow closed the Dow Jones 11,577.5 +18.8 +10.4 +7.3 +11.0 quarter at 11,577.5 points to register a gain of 7.3% in 4Q 2010 while the Nasdaq rose by wider margin of 12.0% to close at 2,652.9 points over the FTSE 100 5,899.9 +22.1 +12.8 +6.3 +9.0 same period. Australia 4,745.2 +30.8 +6.5 +3.5 -2.6 ^Index as at 30 December 2010 1
- 2. Economic Review On the local front, the normalisation of Bank Negara’s overnight policy rate is expected to continue with a potential 25 to 50 basis points hike to On the domestic front, Malaysia’s GDP growth eased to 5.3% in 3Q 2010 3% - 3.25% in 2011 after the 75 basis points hike this year. This auger well from 8.9% in 2Q 2010 due to slower growth in the manufacturing and for domestic demand as real interest rates, after accounting for a projected services sector. For the first nine months of 2010, Malaysia’s GDP expanded inflation rate of 3%, will continue to remain low. by 8.0% compared to a decline of 1.7% in 2009 amidst a rebound in exports and private investment. At the KLCI’s closing level of 1,518.9 points on 30 December 2010, the local stock market is trading at a prospective P/E of 16.5x on 2011 earnings, which is comparable to its 10-year average P/E ratio of 16.7x. The local Malaysia’s GDP Growth by Sector market is supported by a gross dividend yield of about 3.5%, which exceeds Quarterly Annual the current 12-month fixed deposit rate of 2.85%. (%) YoY 3Q 4Q 1Q 2Q 3Q 2009 2009 2010 2010 2010 2009 2010f 2011f Bond Market Review & Outlook Agriculture -0.4 5.9 6.8 2.4 2.7 0.4 3.1 3.8 For the quarter ended 31 December 2010, the U.S. Treasury market weakened as better-than-expected U.S. economic data reduced trading interest in U.S. Mining -3.6 -2.8 2.1 1.1 -1.1 -3.8 0.4 1.4 Treasury bonds. The 3, 5 and 10-year Treasury yields rose by between 36 basis points (bps) and 75 bps to 0.99%, 2.01% and 3.29% respectively for the Manufacturing -8.6 5.0 17.0 16.0 7.5 -9.4 11.0 4.9 quarter. Construction 7.9 9.3 8.7 4.2 2.8 5.8 4.8 4.3 Looking ahead, U.S. Treasury bond prices are expected to remain supported Services 3.4 5.2 8.5 7.3 5.4 2.6 6.8 6.0 amidst the extension of the Federal Reserve’s continued accommodative monetary policies and sustained demand for safe-haven assets. Real GDP Growth -1.2 4.4 10.1 8.9 5.3 -1.7 7.1 5.5 Malaysian Government Securities (MGS) closed generally lower on f = Consensus Forecast expectations of higher government bond issuance in 2011 following a larger-than-expected budget deficit of 5.4% projected for 2011 by the Malaysia’s export growth rose to 5.3% in November from 1.3% in October government. The 5 and 10-year MGS yields rose by 10 bps and 38 bps to on higher exports of commodities. Meanwhile, import growth slowed to 3.34% and 4.00% respectively in 4Q 2010 while the 3-year MGS yield fell by 6.1% from 12.5% over the same period. As imports outpaced exports, the 4 bps to 3.11% over the same period. cumulative trade surplus for the first eleven months of 2010 narrowed by 5.4% to RM100.5 billion compared to the same period last year. The local corporate bond market strengthened with the 5 and 10-year AAA corporate bond yields declining by 3 bps and 9 bps to 4.16% and 4.88% On the regional front, the People’s Bank of China raised the reserve respectively over the quarter. Meanwhile, the 3-year AAA corporate bond requirement ratio by 150 basis points in 4Q 2010 to 18.5% to curb inflationary yields remained unchanged at 3.85% over the same period. pressures and excess liquidity in the market. Furthermore, the 1-year lending In the money market, the spread of the 3-month Kuala Lumpur Interbank rate and 1-year fixed deposit rate were increased by 50 basis points to 5.81% Offer Rate (KLIBOR) over the 3-month U.S. Treasury bill rate widened from and 2.75% respectively in 4Q 2010. 278 bps in September 2010 to 286 bps in December 2010 as the 3-month In the U.S., the manufacturing sector expanded with the Institute of Supply KLIBOR rose by 5 bps to 2.98% while the 3-month U.S. Treasury bill fell by 3 Management’s Purchasing Managers Index (PMI) rising to a 7-month high bps to 0.12% over the quarter. of 57.0 in December from 56.6 in November as new orders and employment remained resilient. Monthly Interest Rates & Bond Yields Meanwhile, the U.S. labour market continued to strengthen as non-farm Tenor/ Date 31 December 2010 30 September 2010 Change* jobs rose for the second consecutive month by 39,000 jobs in November (%) (%) (bps) compared to 172,000 jobs created in October as firms in the services sector continued to hire. 3 Months KLIBOR 2.98^ 2.93 +5.0 On 7 December 2010, the U.S. Congress agreed to extend the Bush-era income tax cuts for another two years to help bolster consumer and investment U.S. Treasury bill 0.12 0.15 -3.0 spending. The tax cut package is estimated to cost the government US$857.8 3 Year Bonds billion over the next 10 years with 43.6% of the total amount expected to be incurred in 2011. As a result, U.S. GDP growth for 2011 is revised up to 3.0% ‘AAA’ Corporate 3.85^ 3.85 - from earlier estimates of 1.5% - 2.0% as the extension of tax cuts is expected MGS 3.11^ 3.15 -4.0 to boost consumer and investment spending and increase 2011 real GDP U.S. Treasury bond 0.99 0.63 +36.0 growth by between 0.5% and 1.2%. 5 Year Bonds After rising by 5.7% in 3Q 2010, crude oil prices rose to a 26-month high of US$91.49/barrel on 28 December 2010 on expectations that a recovery in ‘AAA’ Corporate 4.16^ 4.19 -3.0 economic activities will fuel global demand for energy. Oil prices closed at MGS 3.34^ 3.24 +10.0 US$91.38/barrel to register a gain of 14.3% in 4Q 2010. U.S. Treasury bond 2.01 1.26 +75.0 10 Year Bonds Stock Market Outlook ‘AAA’ Corporate 4.88^ 4.97 -9.0 Most global and regional markets strengthened in 4Q 2010 on expectations MGS 4.00^ 3.62 +38.0 that the global and regional economies will continue to register resilient growth in 2011. To some extent, the recent increase in government bond U.S. Treasury bond 3.29 2.51 +78.0 yields in developed countries such as the U.S. and Germany reflect investors’ * in basis points ^ as at 30 December 2010 expectations of sustained recovery in their economies. However, central banks’s policy interest rates remain low and combined with quantitative On the domestic front, the MGS market is expected to be supported by easing policies in the U.S., may cause potential inflationary pressures in the continued demand for sovereign bonds, moderate inflationary pressures and future. Bank Negara’s supportive monetary policy to sustain economic growth. Over the longer term, the local bond market is projected to benefit from resilient On the regional front, inflationary pressures in several regional economies demand for quality corporate bonds and sustained liquidity in the domestic continue to build up on the back of higher food prices, rents and wages. economy. Despite two recent interest rate hikes by the Chinese central bank, China’s real interest rates remain negative and monetary conditions continue to be Note: Q = Quarter accommodative. In general, nominal interest rates in regional economies are expected to continue to trend up in the year ahead to contain both consumer and asset price inflationary pressures. 2
- 3. PUBLIC SAvINGS FUND (PSF) Fund Objective To achieve long-term capital appreciation while at the same time producing a reasonable level of income. (1) 3-year Investor’s Risk Profile Fund Volatility 15.8 high Lipper Analytics Moderate 15 Dec 10 Lipper Leaders (Overall Ratings) : Morningstar RatingTM (Overall) : 5 4 5 [Lipper Equity Malaysia Funds Classification Morningstar CategoryTM : Malaysia Equity calculated out of 125 funds] Consistent Preservation Total Return Return Financial Year End : 31 December Asset Allocation as at 30 December 2010 Money Market Instruments Launch Date : 29.03.1981 & Others 12.64% Approved Fund Size : 1.5 Billion Units Equities & Derivatives 87.36% Current Fund Size : NAv : RM963.49 Million (Cum Distribution) Asset Allocation by Country UNITS : 1,295.21 Million Malaysia 68.63% Singapore 9.13% Performance of Public Savings Fund vs its Benchmark Index China 4.55% Over the Following Periods Ended 30 December 2010 Hong Kong 2.65% United States of America 0.77% PSF Benchmark PSF Benchmark Australia 0.75% (%) (%) (%) (%) Indonesia 0.48% Taiwan 0.40% Total Total Annualised Annualised Return Return Return Return 1-year 16.40 19.34 16.40 19.34 Top 5 Sectors as at 30 December 2010 3-year 20.07 5.11 6.29 1.68 Sector Name % NAv 5-year 104.02 68.81 15.32 11.03 Financial 33.56 10-year 214.45 123.49 12.12 8.36 Consumer, Non-cyclical 18.06 Industrial 11.61 Performances of PSF and Benchmark Index Consumer, Cyclical 9.22 (Since Fund Commencement* to 30 December 2010) Communications 6.00 1000% PSF Benchmark 900% 800% 700% Top 5 Holdings as at 30 December 2010 Total Returns 600% 500% Security Name 400% 300% Public Bank Berhad 200% CIMB Group Holdings Berhad 100% 0% Malayan Banking Berhad -100% Apr-81 Apr-87 Mar-93 Feb-99 Jan-05 Dec-10 IOI Corporation Berhad Benchmark: Kuala Lumpur Composite Index (prior to 6 July 2009). Indofood Agri Resources Limited FTSE Bursa Malaysia KLCI (w.e.f. 6 July 2009). Index data are sourced from Lipper. * Commencement Date - 27 April 1981 Annual Returns for Financial Years Ended December 31 Year 2001 2002 2003 2004 2005 2006 2007 2008 2009 2010 PSF (%) 3.59 2.72 22.65 13.91 3.67 24.24 36.77 -28.32 43.90 16.40 Benchmark Index (%) 2.42 -7.15 22.84 14.29 -0.84 21.83 31.82 -39.33 45.17 19.34 Unit Split 1 for 20 1 for 10 1 for 6 - - - - - - - Distribution (Sen) 3.00 1.00 1.50 4.00 5.00 6.50 10.00 7.50 8.00 9.00 Distribution Yield (%) 4.7 1.7 2.3 6.6 8.6 9.6 12.6 14.7 12.4 13.6 12-Month FD Average (%) 4.0 4.0 3.7 3.7 3.7 3.7 3.7 3.7 2.5 3.0 EPF Dividend Rate (%) 5.0 4.25 4.5 4.75 5.0 5.15 5.8 4.5 5.65 - Note: (1) Based on the fund’s portfolio returns as at 15 December 2010, the volatility Factor (vF) for this fund is 15.8 and is classified as “High” (source : Lipper). 3
- 4. PUBLIC GROWTH FUND (PGF) Fund Objective To achieve long-term capital appreciation with income considered incidental. (1) 3-year Investor’s Risk Profile Fund Volatility 20.4 very high Lipper Analytics Moderate 15 Dec 10 Lipper Leaders (Overall Ratings) : Morningstar RatingTM (Overall) : 4 3 4 [Lipper Equity Malaysia Funds Classification Morningstar CategoryTM : Malaysia Equity calculated out of 125 funds] Consistent Preservation Total Return Return Financial Year End : 31 July Asset Allocation as at 30 December 2010 Launch Date : 11.12.1984 Fixed Income Securities Money Market Instruments & Others 2.14% 2.66% Approved Fund Size : 4.5 Billion Units Equities & Derivatives 95.20% Current Fund Size : NAv : RM873.09 Million Asset Allocation by Country UNITS : 1,599.99 Million Malaysia 66.69% China 13.35% Performance of Public Growth Fund vs its Benchmark Index United States of America 6.88% Over the Following Periods Ended 30 December 2010 Taiwan 2.91% Indonesia 2.32% PGF Benchmark PGF Benchmark Japan 1.44% (%) (%) (%) (%) Hong Kong 1.12% Total Total Annualised Annualised Korea 0.49% Return Return Return Return Top 5 Sectors as at 30 December 2010 1-year 17.79 19.34 17.79 19.34 3-year 14.59 5.11 4.64 1.68 Sector Name % NAv 5-year 101.21 68.81 15.00 11.03 Financial 36.55 10-year 201.32 123.49 11.64 8.36 Communications 17.17 Performances of PGF and Benchmark Index Industrial 13.01 (Since Fund Commencement* to 30 December 2010) Consumer, Cyclical 10.64 1000% Utilities 7.47 PGF Benchmark 900% 800% Top 5 Holdings as at 30 December 2010 700% Total Returns 600% 500% Security Name 400% 300% Public Bank Berhad 200% Tenaga Nasional Berhad 100% 0% CIMB Group Holdings Berhad -100% RHB Capital Berhad Jan-85 Mar-90 May-95 Aug-00 Oct-05 Dec-10 Benchmark: Kuala Lumpur Composite Index (prior to 6 July 2009). Malaysia Airports Holdings Berhad FTSE Bursa Malaysia KLCI (w.e.f. 6 July 2009). Index data are sourced from Lipper. * Commencement Date - 9 January 1985 Annual Returns for Financial Years Ended July 31 Year 2001 2002 2003 2004 2005 2006 2007 2008 2009 2010 PGF (%) -13.88 12.16 2.16 14.33 11.74 4.78 51.85 -7.75 5.29 14.26 Benchmark Index (%) -17.45 9.43 -0.14 15.74 12.40 -0.16 46.79 -15.33 1.02 15.83 Unit Split 1 for 20 1 for 10 1 for 20 - - - - - - - Distribution (Sen) 1.00 1.50 - 2.50 3.50 4.00 9.00 10.00 4.00 5.00 Distribution Yield (%) 2.1 3.1 - 5.3 7.1 8.4 14.7 20.9 8.5 10.4 12-Month FD Average (%) 4.0 4.0 3.7 3.7 3.7 3.7 3.7 3.7 2.5 3.0 EPF Dividend Rate (%) 5.0 4.25 4.5 4.75 5.0 5.15 5.8 4.5 5.65 - Note: (1) Based on the fund’s portfolio returns as at 15 December 2010, the volatility Factor (vF) for this fund is 20.4 and is classified as “very High” (source : Lipper). 4
- 5. PUBLIC INDEX FUND (PIX) Fund Objective To achieve long-term capital appreciation while at the same time attempting to outperform the FTSE Bursa Malaysia Top 100 Index. (1) 3-year Investor’s Risk Profile Fund Volatility 18.0 high Lipper Analytics Moderate 15 Dec 10 Lipper Leaders (Overall Ratings) : Morningstar RatingTM (Overall) : 4 3 3 [Lipper Equity Malaysia Funds Classification Morningstar CategoryTM : Malaysia Equity calculated out of 125 funds] Consistent Preservation Total Return Return Financial Year End : 31 January Asset Allocation as at 30 December 2010 Money Market Instruments Launch Date : 02.03.1992 & Others 4.24% Approved Fund Size : 2.25 Billion Units Equities & Derivatives 95.76% Current Fund Size : NAv : RM1,003.46 Million Asset Allocation by Country UNITS : 1,289.52 Million Malaysia 95.76% Performance of Public Index Fund vs its Benchmark Index Over the Following Periods Ended 30 December 2010 PIX Benchmark PIX Benchmark (%) (%) (%) (%) Total Total Annualised Annualised Top 5 Sectors as at 30 December 2010 Return Return Return Return 1-year 21.09 21.76 21.09 21.76 Sector Name % NAv 3-year 8.29 7.05 2.69 2.30 Financial 35.16 5-year 86.06 71.92 12.97 11.44 Consumer, Non-cyclical 13.72 10-year 178.88 127.60 10.78 8.56 Consumer, Cyclical 12.99 Industrial 9.15 Performances of PIX and Benchmark Index Diversified 8.21 (Since Fund Commencement* to 30 December 2010) 600% PIX Benchmark 540% 480% Top 5 Holdings as at 30 December 2010 420% Security Name Total Returns 360% 300% Public Bank Berhad 240% 180% CIMB Group Holdings Berhad 120% Malayan Banking Berhad 60% 0% Sime Darby Berhad -60% Mar-92 Dec-95 Sep-99 Jun-03 Mar-07 Dec-10 Genting Berhad Benchmark: Kuala Lumpur Composite Index (prior to 6 July 2009). FTSE Bursa Malaysia Top 100 Index (w.e.f. 6 July 2009). Underlying index data are sourced from Lipper. * Commencement Date - 31 March 1992 Annual Returns for Financial Years Ended January 31 Year 2001 2002 2003 2004 2005 2006 2007 2008 2009 2010 PIX (%) -17.70 3.96 -1.73 20.78 11.02 7.49 33.29 19.82 -36.07 45.02 Benchmark Index (%) -21.08 -1.22 -7.52 23.19 11.88 -0.25 30.12 17.14 -36.52 42.62 Unit Split - 1 for 10 1 for 10 - - - 1 for 10 - - - Distribution (Sen) - - - - 6.00 5.00 7.50 20.00 5.00 5.00 Distribution Yield (%) - - - - 7.9 6.5 7.9 23.9 10.5 7.8 12-Month FD Average (%) 4.0 4.0 3.7 3.7 3.7 3.7 3.7 3.7 2.5 3.0 EPF Dividend Rate (%) 5.0 4.25 4.5 4.75 5.0 5.15 5.8 4.5 5.65 - Note: (1) Based on the fund’s portfolio returns as at 15 December 2010, the volatility Factor (vF) for this fund is 18.0 and is classified as “High” (source : Lipper). 5
- 6. PUBLIC INDUSTRY FUND (PIF) Fund Objective To achieve a high level of capital appreciation over the medium to long term period through investments in growth industries. (1) 3-year Investor’s Risk Profile Fund Volatility 18.8 very high Lipper Analytics Moderate 15 Dec 10 Lipper Leaders (Overall Ratings) : Morningstar RatingTM (Overall) : 2 2 2 [Lipper Equity Malaysia Funds Classification Morningstar CategoryTM : Malaysia Equity calculated out of 125 funds] Consistent Preservation Total Return Return Financial Year End : 31 October Asset Allocation as at 30 December 2010 Money Market Instruments Launch Date : 18.11.1993 & Others 5.54% Approved Fund Size : 1.0 Billion Units Equities & Derivatives 94.46% Current Fund Size : NAv : RM182.25 Million Asset Allocation by Country UNITS : 334.39 Million Malaysia 69.42% United States of America 5.88% Performance of Public Industry Fund vs its Benchmark Index China 5.30% Singapore 4.30% Over the Following Periods Ended 30 December 2010 Korea 4.18% Indonesia 2.13% PIF Benchmark PIF Benchmark Taiwan 2.13% (%) (%) (%) (%) Hong Kong 1.12% Total Total Annualised Annualised Return Return Return Return 1-year 9.94 19.34 9.94 19.34 Top 5 Sectors as at 30 December 2010 3-year -7.89 5.11 -2.70 1.68 5-year 73.11 68.81 11.59 11.03 Sector Name % NAv 10-year 175.78 123.49 10.66 8.36 Financial 26.44 Consumer, Non-cyclical 17.22 Performances of PIF and Benchmark Index Industrial 12.63 (Since Fund Commencement* to 30 December 2010) Communications 10.76 240% PIF Benchmark 200% Technology 8.98 160% Total Returns Top 5 Holdings as at 30 December 2010 120% 80% 40% Security Name 0% Public Bank Berhad -40% CIMB Group Holdings Berhad -80% Apple Incorporation Dec-93 May-97 Oct-00 Mar-04 Aug-07 Dec-10 Malaysia Airports Holdings Berhad Benchmark: Kuala Lumpur Composite Index (prior to 6 July 2009). FTSE Bursa Malaysia KLCI (w.e.f. 6 July 2009). Golden Agri-Resources Limited Index data are sourced from Lipper. * Commencement Date - 17 December 1993 Annual Returns for Financial Years Ended October 31 Year 2001 2002 2003 2004 2005 2006 2007 2008 2009 2010 PIF (%) -15.35 15.51 25.50 3.74 10.91 18.05 59.69 -40.11 35.63 14.68 Benchmark Index (%) -20.24 9.92 23.89 5.39 5.76 8.51 43.04 -38.91 43.96 21.11 Unit Split - - 1 for 6 - - - - - - - Distribution (Sen) 5.00 - - 2.50 4.50 5.00 10.00 7.50 4.50 5.00 Distribution Yield (%) 12.0 - - 4.8 8.5 8.6 12.4 17.5 8.7 9.2 12-Month FD Average (%) 4.0 4.0 3.7 3.7 3.7 3.7 3.7 3.7 2.5 3.0 EPF Dividend Rate (%) 5.0 4.25 4.5 4.75 5.0 5.15 5.8 4.5 5.65 - Note: (1) Based on the fund’s portfolio returns as at 15 December 2010, the volatility Factor (vF) for this fund is 18.8 and is classified as “very High” (source : Lipper). 6
- 7. PUBLIC AGGRESSIvE GROWTH FUND (PAGF) Fund Objective To seek high capital growth over the medium to long term period through investments in situational and high growth stocks. (1) 3-year Fund Volatility Investor’s Risk Profile 23.3 very high Lipper Analytics Aggressive 15 Dec 10 Lipper Leaders (Overall Ratings) : Morningstar RatingTM (Overall) : 4 1 4 [Lipper Equity Malaysia Funds Classification Morningstar CategoryTM : Malaysia Equity calculated out of 125 funds] Consistent Preservation Total Return Return Financial Year End : 31 March Asset Allocation as at 30 December 2010 Fixed Income Securities Money Market Instruments Launch Date : 25.04.1994 0.87% & Others 7.97% Approved Fund Size : 1.0 Billion Units Equities & Derivatives 91.16% Current Fund Size : NAv : RM447.82 Million Asset Allocation by Country UNITS : 627.05 Million Malaysia 63.29% China 13.76% Performance of Public Aggressive Growth Fund vs its Benchmark United States of America 5.94% Taiwan 2.80% Index Over the Following Periods Ended 30 December 2010 Indonesia 2.26% Japan 1.43% PAGF Benchmark PAGF Benchmark Hong Kong 1.16% (%) (%) (%) (%) Korea 0.52% Total Total Annualised Annualised Return Return Return Return 1-year 19.52 19.34 19.52 19.34 Top 5 Sectors as at 30 December 2010 3-year 6.33 5.11 2.07 1.68 Sector Name % NAv 5-year 114.91 68.81 16.52 11.03 10-year 219.06 123.49 12.28 8.36 Financial 32.83 Communications 16.64 Performances of PAGF and Benchmark Index Consumer, Cyclical 11.68 (Since Fund Commencement* to 30 December 2010) Industrial 10.25 240% Utilities 7.49 PAGF Benchmark 200% 160% Top 5 Holdings as at 30 December 2010 Total Returns 120% 80% Security Name 40% Public Bank Berhad 0% Tenaga Nasional Berhad -40% RHB Capital Berhad -80% CIMB Group Holdings Berhad May-94 Sep-97 Jan-01 May-04 Sep-07 Dec-10 Telekom Malaysia Berhad Benchmark: Kuala Lumpur Composite Index (prior to 6 July 2009). FTSE Bursa Malaysia KLCI (w.e.f. 6 July 2009). Index data are sourced from Lipper. * Commencement Date - 24 May 1994 Annual Returns for Financial Years Ended March 31 Year 2001 2002 2003 2004 2005 2006 2007 2008 2009 2010 PAGF (%) -36.93 22.46 -13.43 45.68 -3.96 12.28 42.39 9.30 -28.69 54.32 Benchmark Index (%) -33.55 16.78 -15.92 41.86 -3.38 6.34 34.56 0.05 -30.06 51.35 Unit Split - 1 for 10 1 for 10 - - - - - - - Distribution (Sen) 4.00 - - - 3.50 4.50 6.00 15.00 5.00 8.00 Distribution Yield (%) 8.0 - - - 5.9 7.3 7.5 20.6 10.5 12.2 12-Month FD Average (%) 4.0 4.0 3.7 3.7 3.7 3.7 3.7 3.7 2.5 3.0 EPF Dividend Rate (%) 5.0 4.25 4.5 4.75 5.0 5.15 5.8 4.5 5.65 - Note: (1) Based on the fund’s portfolio returns as at 15 December 2010, the volatility Factor (vF) for this fund is 23.3 and is classified as “very High” (source : Lipper). 7