


![Market Summary
Index Returns
US Stock
Market
International
Developed Stocks
Emerging
Markets
Stocks
Global
Real
Estate
US Bond
Market
Global
Bond
Market
ex US
Q2 2018 STOCKS BONDS
3.89% ‐0.75% ‐7.96% 6.05% ‐0.16% 0.48%
Since Jan. 2001
Avg. Quarterly Return 2.0% 1.5% 3.0% 2.6% 1.1% 1.1%
Best 16.8% 25.9% 34.7% 32.3% 4.6% 4.6%
Quarter
Q2 2009 Q2 2009 Q2 2009 Q3 2009 Q3 2001 Q4 2008
Worst ‐22.8% ‐21.2% ‐27.6% ‐36.1% ‐3.0% ‐2.7%
Quarter
Q4 2008 Q4 2008 Q4 2008 Q4 2008 Q4 2016 Q2 2015
Past performance is not a guarantee of future results. Indices are not available for direct investment. Index performance does not reflect the expenses associated with the management of an actual
portfolio. Market segment (index representation) as follows: US Stock Market (Russell 3000 Index), International Developed Stocks (MSCI World ex USA Index [net div.]), Emerging Markets (MSCI Emerging
Markets Index [net div.]), Global Real Estate (S&P Global REIT Index [net div.]), US Bond Market (Bloomberg Barclays US Aggregate Bond Index), and Global Bond Market ex US (Bloomberg Barclays Global
Aggregate ex-USD Bond Index [hedged to USD]). S&P data © 2018 S&P Dow Jones Indices LLC, a division of S&P Global. All rights reserved. Frank Russell Company is the source and owner of the trademarks,
service marks, and copyrights related to the Russell Indexes. MSCI data © MSCI 2018, all rights reserved. Bloomberg Barclays data provided by Bloomberg. FTSE fixed income © 2018 FTSE Fixed Income LLC,
all rights reserved.](https://image.slidesharecdn.com/2018q2qmrasi-180724211714/85/Q2-2018-Quarterly-Market-Commentary-4-320.jpg)
![World Stock Market Performance
MSCI All Country World Index with selected headlines from Q2 2018
210
220
230
240
250
260
Apr May Jun
“US Factories Report
Strong Demand, as
Tariffs, Prices Threaten
Expansion”
“Trump Pulls
US Out of Iran
Deal”
“Small Caps Set New
Highs, Outpacing Their
Multinational Peers”
“Eurozone Business
Activity Continues
to Slow for Fourth
Straight Month”
“Economic
Growth in US
Leaves World
Behind”
“China’s Trade
Surplus with US
Soars”
“Consumers Shy from
Spending, Despite
Tax Cuts”
“IMF Forecasts Global
Growth of 3.9% This
Year”
“Yield on 10‐Year US
Government Bond Hits
3% for First Time in
Years”
“Growth Cooled in
First Quarter as
Consumers Reined in
Spending”
“Oil Prices Reach
Highest Level Since
2014”
“Private Sector Adds Fewer Jobs in
May as Businesses Struggle to Fill
Openings”
“Unemployment
Rate Falls to 18‐
Year Low”
“Trump, Kim
Embark on New
Path”
“NASDAQ
Composite
Climbs to
Record”
“US, China Tariffs Hit
American‐Made
Products from Chips
to Cars”
“China Sends
Yuan to Fresh
Six‐Month
Low”
“Inflation Rate
Hits Six‐Year
High in May”
These headlines are not offered to explain market returns. Instead, they serve as a reminder that investors should view daily
events from a long‐term perspective and avoid making investment decisions based solely on the news.
Graph Source: MSCI ACWI Index [net div.]. MSCI data © MSCI 2018, all rights reserved.
It is not possible to invest directly in an index. Performance does not reflect the expenses associated with management of an actual portfolio. Past performance is not a guarantee of future results.](https://image.slidesharecdn.com/2018q2qmrasi-180724211714/85/Q2-2018-Quarterly-Market-Commentary-5-320.jpg)


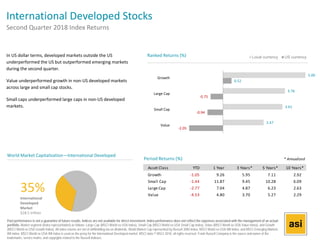

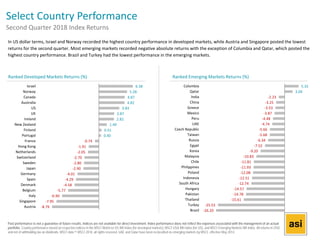


The Q2 2018 quarterly market review provides an overview of global capital market performance, including the returns of various stock and bond asset classes. It highlights that the US equity market outperformed non-US developed and emerging markets, with small cap stocks outperforming large cap in the US but underperforming internationally. The report emphasizes the impact of diversification and contains key market events and index returns from the quarter.


