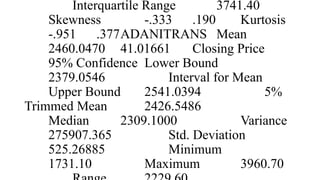
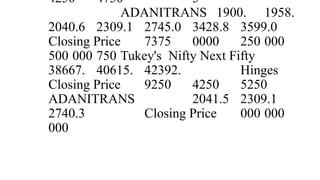
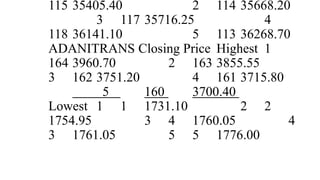
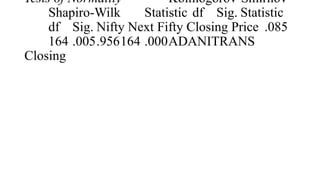
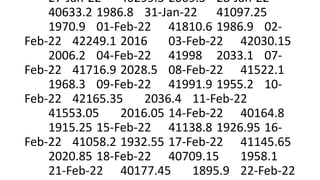
- The document compares the closing prices of the Nifty Next 50 index and Adani Transmission Ltd stock (ADANITRANS) from January 3rd to August 30th 2022.
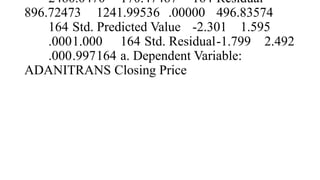
- Descriptive statistics show the median, mean, standard deviation, minimum and maximum closing prices for both, with ADANITRANS having lower values.
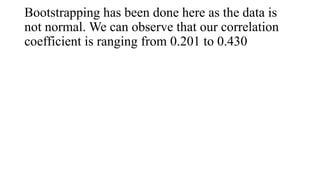
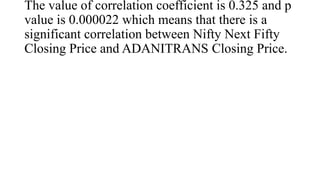
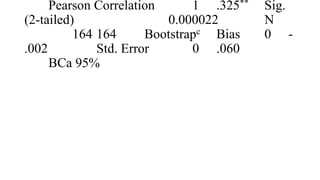
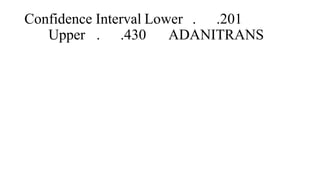
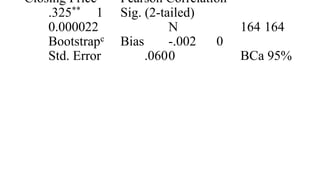
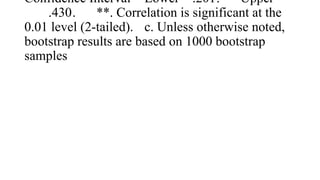
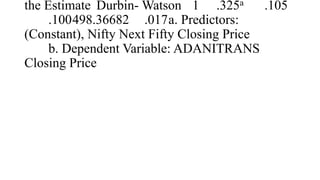
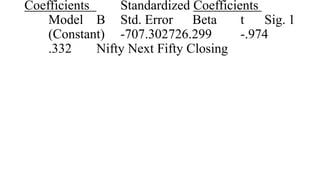
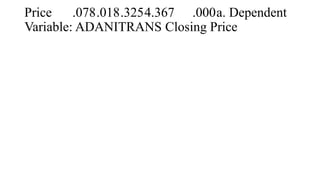
- There is a positive correlation between the two closing prices, with the correlation coefficient estimated at 0.325, indicating a moderate relationship.