QNBFS Daily Technical Trader - Qatar for August 14 2019 التحليل الفني اليومي لبورصة قطر
•
0 likes•116 views

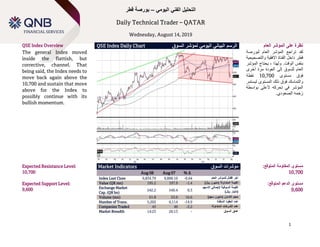
The general Index moved inside the flattish, but corrective, channel. That being said, the Index needs to move back again above the 10,700 and sustain that move above for the Index to possibly continue with its bullish momentum.

Recommended
More Related Content
What's hot
What's hot (20)
Similar to QNBFS Daily Technical Trader - Qatar for August 14 2019 التحليل الفني اليومي لبورصة قطر
Similar to QNBFS Daily Technical Trader - Qatar for August 14 2019 التحليل الفني اليومي لبورصة قطر (20)
More from QNB Group
More from QNB Group (20)
Recently uploaded
Recently uploaded (20)
QNBFS Daily Technical Trader - Qatar for August 14 2019 التحليل الفني اليومي لبورصة قطر
- 1. Technical Spotlight Sunday, January 14, 2018 1 اليومي الفني التحليل–قطر بورصة Daily Technical Trader – QATAR Wednesday, August 14, 2019 QSE Index Overview QSE Index Daily Chart الرسمالسوق لمؤشر اليومي البياني العام المؤشر على نظرة The general Index moved inside the flattish, but corrective, channel. That being said, the Index needs to move back again above the 10,700 and sustain that move above for the Index to possibly continue with its bullish momentum. تراجع لقدالمؤشرالعاملبورصة قطرداخلالقناةاالو قفقةةالتصحةحةة الوقت بنفس.ولهذا،ةحتاجالمؤشر للسوق العامإلىالعودةمرةأخرى قفوقمستوى10,700نقطة والتماسكالمستوى ذلك قفوقلةستمر قفي المؤشرتحركهأللعلىبواسطة زخمهالصعودي. Expected Resistance Level: 10,700 Expected Support Level: 9,600 Market Indicators السوق مؤشرات Aug 08 Aug 07 % ∆ Index Last Close 9,834.79 9,898.10 -0.64 العام للمؤشر إقفال آخر Value (QR mn) 195.2 197.9 -1.4 )لاير (مليون المتداولة القيمة Exchange Market Cap. (QR bn) 542.2 540.4 0.3 السوقية القيمةإلجمالياالسهم )لاير (مليار Volume (mn) 61.8 53.0 16.6 )سهم (مليون التداول حجم Number of Trans. 5,202 6,114 -14.9 المنفذة العقود عدد Companies Traded 45 46 -2.2 المتداولة الشركات عدد Market Breadth 14:23 26:13 – السوق عمق :المتوقع المقاومة مستوى 10,700 :المتوقع الدعم مستوى 9,600
- 2. 2 MASRAF AL RAYAN مصرفالريان Stock Overview Daily Chart البياني الرسماليومي نظرةعلىالسهم There is a chance for a relief bounce off the current levels as the price has created a bullish reversal candlestick pattern on the daily chart. That could be used for a quick trade because the price remains to be moving below its moving averages. هناكقفرصةالرتدادالسعرلعن المستوةاتالحالةة،حةثكون السعرنموذج)ةابانةة (شموع انعكاسيصعوديلعلىالرسم البةانيالةومي.وةمكناستخدام ذلكلتداولسرةعألنالسعرال ةزالةتحركدونمتوسطاته المتحركة. Expected Target Price: QR3.76 – QR3.86 A price breakout above QR3.65 triggers the buy idea. Suggested Stop-Loss Level: Discretionary Last Px. االقفال سعر %∆ %التغير Volume التداول حجم 3.60 1.69 3,718,005 Resistance/Support / الدعمالمقاومة Level 1st األول 2nd الثاني 3rd الثالث المستوى Resistance 3.65 3.76 3.82 مقاومة Support 3.56 3.50 3.40 دعم :المتوقعة السعرية األهداف 3.76لاير–3.86لاير نرجحالشراءاختراق حال قفي السعرقفوقمستوى3.65.لاير المقترح الخسارة ايقاف مستوى: المتداول يالئم ما حسب
- 3. 3 :التعريفات :اليابانية الشموعمح قفترة خالل السهم وصله سعر أدنى و ألعلى و اإلغالق و االقفتتاح سعر الرسم ةحدد .قدةمة ةابانةة طرةقة لعلى األسعار رسم طرق أحد هي وو .ددة ال و االقفتتاح سعر من أقل اإلغالق سعر أن تعني الملونة الشمعة .اإلغالق و اإلقفتتاح بسعر تتحدد حةث الشمعة ""جسم من الشمعة تتكون.البةضاء للشمعة بالنسبة صحةح عكس ال شكل قفإن ,لعامة بصورة .المطلوبة الفترة خالل السهم وصله سعر أقل و ألعلى ةحدد لظل هذا و الشمعة ""ظل بـ ةسمى ما الةابانةة للشمعةاستمرار من كثةرة دالالت له شمعة .انعكاسه أو السهم التجاه :الدعم مستوىقفةه ةتوقع الذي المستوى هو و.دنةة مستوةات إلى السهم انخفاض احتمال من ةقلل هذا و ,البةع من أكثر الشراء لعلى قفةه المتداولةن ةشارك أن :المقاومة مستوى.ألعلى مستوةات الى السهم ارتفاع احتمال من ةقلل ذلك و ,الشراء من أكثر بالبةع المتداولون ةقوم أن ةتوقع حةث ,الدلعم مستوى لعكس هو و المتوسط:البسيط المتحركو البةع لعالمات إلعطاء قفي متأخر المؤشر هذا ةعتبر السبب لهذا المختارة الفترات من محدد لعدد لعلى السهم سعر معدل ةحسب حسابي متوسط هو اتج لمعرقفة أداة مثل ،كثةرة أغراضا للمتوسطات ،لعام بشكل .اإلغالق أسعار تستخدم تحلةلنا قفي المستخدمة المتوسطات .الشراءو السعر تقلبات حدة تقلةل ،تأشةري السعر اه .االستخدامات من ذلك غةر إلى و المقاومة و للدلعم المحتملة المستوةات ال عمق:سوق.معةن ةوم تبادل قفي المتراجعة األسهم لعدد مقابل ارتفاع لعلى أقفلت و تداولها تم التي المالةة األوراق لعدد إلى ةشةر / التقارب المتحرك المتوسط( التباعدMACD:)و اتجاه و قوة قفي التغةرات لعلى ةدل تداول مؤشر هوحسابات مجمولعة خالل من األسهم أسعار زخممكونةثالثة من اإلغالق أسعار بةانات من محسوبة زمنةة سالسل.التارةخةة ( النسبية القوة مؤشرRSI:)معةنة قفترة خالل السهم سعر تحرك قوة ةقارن قفني مؤشر هو وبةن المؤشر ةتذبذب .المتداولةن قبل من البةع أو الشراء ذروة لتحدةد منه محاولة ال0ال و100ال قفوق قراءات الى المؤشر وصول ةعتبر ,لعام بشكل و .درجة70ال تحت و الشراء ذروة مناطق الى وصل قد السعر بأن درجة30لمستوةات درجة .البةع ذروة :األسعار شكل / نمطاس هو والرأس (مثل مختلفة أشكال قفي السعرةة األنماط هذه تأتي و .الفني التحلةل وسط قفي تداولها ةتم معةنة أشكال حسب السهم سعر لحركة تقراء و والخروج الدخول ونقاط انعكاسها أو السهم لحركة المحتملة االتجاهات لتحدةد األشكال تستخدم و .)الخ ،واأللعالم ،والمثلثات والكتفةنغةره.االستخدامات من ا :فيبوناتشي انسحابات,قفةبوناتشي لةوناردو الرةاضةات لعالم االنسحابات هذه نسبتولعلى السهم لسعر المقاومة أو للدلعم المتوقعة المناطق إلى تشةر التي األقفقةة الخطوط هي مستوةات كأهم للسهم التالةة المستوةات تستخدم .السابقة األسعار حركة أساسهي و السهم لذلك السابقة للحركة المحتملة االنسحابات23.6,%38.2,%50.0,%61.8% ال مستوى و100.0.السابقة الحركة أجزاء من % :البينية المقاومة و الدعم مستويات و فيبوناتشي محوراإلغالق سعر من معةنة حسابات المحور لهذا .ألعاله المذكورة لالنسحابات تماما مختلف هذا وأقل و سعر ألعلى مع .الةومي للتداول متوقعة بةنةة مقاومة و دلعم مستوةات منها ةستخلص السابق للةوم سعر
- 4. 4 Definitions Candlestick: A chart that displays the high, low, opening and closing prices for a security in a single period. The body of the candle is made up by the opening and the closing prices, i.e., the taller the body the greater the range between these two prices and vice versa. A colored candle denotes a closing price that is lower than the opening price, while a white candle shows the opposite. The candlestick's shadows or wicks show the period's high and low prices and how they compare to the opening and closing price. In general, the shape of the candle will vary upon the positions of the period's high, low, opening and closing prices. Support: A level that could cause more buyers to step in in order to prevent the security from falling or causing the security price to head higher. Resistance: An inverse of a support level. A resistance area or level could cause more sellers to step in in order to prevent the security from rising or causing the security price to head lower. SMA (Simple Moving Average): Is an arithmetic average, which calculates the average price of a security over a defined number of periods and is thus considered a lagging indicator. SMAs used in our analysis refer to closing prices. In general, SMAs serve many purposes, such as a smoothing tool, an indicative price direction and potential support/resistance levels. Market Breadth: Breadth indicates the number of securities that have closed higher vs. the number of decliners in a particular exchange. MACD (Moving Average Convergence/Divergence): Is a trading indicator, which shows changes in the strength, direction, momentum and duration of a trend in a stock's price through a collection of three time series calculated from historical closing price data. RSI (Relative Strength Index): Is a momentum indicator that compares a security’s price gains to its losses for a predetermined number of periods (we generally use 14 periods). The RSI attempts to point out how a security, in relative terms, is in the overbought/oversold zone. Securities with a RSI above 70 could be considered as overbought, and below 30 could be considered as oversold. Pattern/Formation: Is a graphical presentation of a security’s price activity over a certain period of time. Formations come in different shapes (such as, head & shoulders, triangles, flags, and so on). They can be used to identify potential trends, reversal of trends, price targets, entry and exit points, etc. Fibonacci Retracements: Are horizontal lines that indicate expected areas of support/resistance for a security based on a predetermined price movement. These levels are usually indicated by Fibonacci ratios of 23.6%, 38.2%, 50.0%, 61.8% and 100% from that particular movement. Fibonacci Pivot and Intraday Support/Resistance: A Pivot Point is generally used to formulate expected future support/resistance levels. From the base Pivot Point, Fibonacci multiples of the high-low differential are added to form resistance levels and subtracted to form support levels.
- 5. 5 Contacts Zaid al-Nafoosi, CMT, CFTe Senior Research Analyst Tel: (+974) 4476 6535 zaid.alnafoosi@qnbfs.com.qa Shahan Keushgerian Senior Research Analyst Tel: (+974) 4476 6509 shahan.keushgerian@qnbfs.com.qa Mehmet Aksoy, PhD Senior Research Analyst Tel: (+974) 4476 6589 mehmet.aksoy@qnbfs.com.qa Saugata Sarkar, CFA, CAIA Head of Research Tel: (+974) 4476 6534 saugata.sarkar@qnbfs.com.qa Ahmed El-Khudary Head of Trading Tel: (+974) 4476 6533 ahmed.elkhudary@qnbfs.com.qa Feras al-Sarraj Head of Sales Tel: (+974) 4476 6514 feras.alsarraj@qnbfs.com.qa QNB Financial Services Contact Center: (+974) 4476 6666 PO Box 24025 Doha, Qatar Disclaimer and Copyright Notice: This publication has been prepared by QNB Financial Services Co. W.L.L. (“QNBFS”) a wholly-owned subsidiary of Qatar National Bank (Q.P.S.C.) (“QNB”). QNBFS is regulated by the Qatar Financial Markets Authority and the Qatar Exchange QNB SAQ is regulated by the Qatar Central Bank. This publication expresses the views and opinions of QNBFS at a given time only. It is not an offer, promotion or recommendation to buy or sell securities or other investments, nor is it intended to constitute legal, tax, accounting, or financial advice. QNBFS accepts no liability whatsoever for any direct or indirect losses arising from use of this report. Any investment decision should depend on the individual circumstances of the investor and be based on specifically engaged investment advice. We therefore strongly advise potential investors to seek independent professional advice before making any investment decision. Although the information in this report has been obtained from sources that QNBFS believes to be reliable, we have not independently verified such information and it may not be accurate or complete. QNBFS does not make any representations or warranties as to the accuracy and completeness of the information it may contain, and declines any liability in that respect. For reports dealing with Technical Analysis, expressed opinions and/or recommendations may be different or contrary to the opinions/recommendations of QNBFS Fundamental Research as a result of depending solely on the historical technical data (price and volume). QNBFS reserves the right to amend the views and opinions expressed in this publication at any time. It may also express viewpoints or make investment decisions that differ significantly from, or even contradict, the views and opinions included in this report. This report may not be reproduced in whole or in part without permission from QNBFS.