QNBFS Daily Technical Trader - Qatar - September 11 2019 التحليل الفني اليومي...QNB Group
The Index started a move above its SMAS, which is a good sign and we may see the Index move to our next expected resistance between the 10,700 and the 10,800 levels.
QNBFS Daily Technical Trader - Qatar for April 23, 2018 التحليل الفني اليومي ...QNB Group
The Index remains strong
after it broke above the 9,200
level and we are positive on
the general direction of the
Index. That being said,
corrections are possible and
the 9,000 level is now our
strong support.
QNBFS Daily Technical Trader - Qatar for April 29, 2019 التحليل الفني اليومي ...QNB Group
The Index continued to go up inside its uptrend channel in the short term, but it remains under the pressure of the rising-wedge formation in the longer term.
QNBFS Daily Technical Trader - Qatar for April 21, 2019 التحليل الفني اليومي ...QNB Group
The Index continued to go up inside its uptrend channel in the short term, but it remains under the pressure of the rising-wedge formation in the longer term.
QNBFS Daily Technical Trader - Qatar for April 30, 2019 التحليل الفني اليومي ...QNB Group
The Index continued to go up inside its uptrend channel in the short term, but it remains under the pressure of the rising-wedge formation in the longer term.
QNBFS Daily Technical Trader - Qatar for August 20 2019 التحليل الفني اليومي ...QNB Group
The general Index continued with its correction and reached the strong support level of 9,600; the Index has also created a bullish reversal candlestick signal at that support. We are expecting a relief rally from here and we update the immediate resistance level to the 10,000 mark.
QNBFS Daily Technical Trader - Qatar for September 10, 2018 التحليل الفني الي...QNB Group
The General Index stabilized as seen from the chart but the main trend remains up. We await a reversal signal against the recent correction to accumulate.
QNBFS Daily Technical Trader - Qatar for October 18, 2018 التحليل الفني اليوم...QNB Group
The Index managed to break above the 10,000 major psychological level on relatively higher volumes; the main trend remains up and as a result, we expect the Index to continue with its rally.
QNBFS Daily Technical Trader Qatar - December 05 2019 التحليل الفني اليومي لب...QNB Group
The Index reached the upper side of the flattish, and now testing the moving averages after it broke below the short- term uptrend channel. That being said, a breakout above that side of the flattish channel means a stronger possibility of a bullish move towards the 11,000 mark.
QNBFS Daily Technical Trader - Qatar for June 23, 2019 التحليل الفني اليومي ل...QNB Group
The Index started to breakout above the corrective channel and has moved above its moving averages; both actions are favorable, but need to be sustained.
QNBFS Daily Technical Trader - Qatar for November 08, 2018 التحليل الفني اليو...QNB Group
The trend has been up on the Index and seems to be intact. Corrections are possible and can be used to add positions. A solid breakout above the 10,360 would take the index to the 10,550-10,600 levels.
QNBFS Daily Technical Trader - Qatar - September 02 2019 التحليل الفني اليومي...QNB Group
The Index passed the 10,000 mark and continued all the way to the 10,200 level where the SMAs meet the Index. The current level (around the 10,200 points) is considered a tough resistance to challenge. If breached upwards, then we may see the Index move to our next expected resistance between the 10,700 and the 10,800 levels.
QNBFS Daily Technical Trader - Qatar - September 09 2019 التحليل الفني اليومي...QNB Group
The Index passed the 10,000 mark and continued all the way to the 10,200 level where the SMAs meet the Index. The current level (around the 10,200 points) is considered a tough resistance to challenge. If breached upwards, then we may see the Index move to our next expected resistance between the 10,700 and the 10,800 levels.
QNBFS Daily Technical Trader - Qatar - September 01 2019 التحليل الفني اليومي...QNB Group
The Index passed the 10,000 mark and continued all the way to the 10,200 level where the SMAs meet the Index. The current level (around the 10,200 points) is considered a tough resistance to challenge. If breached upwards, then we may see the Index move to our next expected resistance between the 10,700 and the 10,800 levels.
QNBFS Daily Technical Trader - Qatar - September 03 2019 التحليل الفني اليومي...QNB Group
The Index passed the 10,000 mark and continued all the way to the 10,200 level where the SMAs meet the Index. The current level (around the 10,200 points) is considered a tough resistance to challenge. If breached upwards, then we may see the Index move to our next expected resistance between the 10,700 and the 10,800 levels.
QNBFS Daily Technical Trader Qatar - October 08 2019 التحليل الفني اليومي لبو...QNB Group
The Index reached the upper side of the flattish, and now testing the moving averages after it broke below the short- term uptrend channel. That being said, a breakout above that side of the flattish channel means a stronger possibility of a bullish move towards the 11,000 mark.
QNBFS Daily Technical Trader - Qatar for August 27 2019 التحليل الفني اليومي ...QNB Group
The QSE Index has created longer upper shadows after the recent bounce above the 9,600 level and it remain below its major moving averages. As a result, the index may weaken further if it does not move above the 10,000 immediate resistance level.
QNBFS Daily Technical Trader Qatar - October 14 2019 التحليل الفني اليومي لبو...QNB Group
The Index reached the upper side of the flattish, and now testing the moving averages after it broke below the short- term uptrend channel. That being said, a breakout above that side of the flattish channel means a stronger possibility of a bullish move towards the 11,000 mark.
QNBFS Daily Technical Trader - Qatar - September 12 2019 التحليل الفني اليومي...QNB Group
The Index started a move above its SMAS, which is a good sign and we may see the Index move to our next expected resistance between the 10,700 and the 10,800 levels.
QNBFS Daily Market Report December 24, 2023QNB Group
The QE Index rose 0.8% to close at 10,285.3. Gains were led by the Transportation and Banks & Financial Services indices, gaining 1.4% and 1.2%, respectively.
QNBFS Daily Market Report October 04, 2023QNB Group
The QE Index rose 0.2% to close at 10,273.3. Gains were led by the Transportation and Consumer Goods & Services indices, gaining 1.7% and 0.1%, respectively.
QNBFS Daily Technical Trader Qatar - October 04, 2023 التحليل الفني اليومي لب...QNB Group
The General Index failed to sustain its breakout above the double-bottom formation’s neckline and continued with its decline into the formation’s territory.
QNBFS Daily Technical Trader Qatar - September 28, 2023 التحليل الفني اليومي ...QNB Group
The General Index failed to sustain its breakout above the double-bottom formation’s neckline and continued with its decline into the formation’s territory.
QNBFS Daily Market Report September 24, 2023QNB Group
The QE Index rose 0.3% to close at 10,323.0. Gains were led by the Transportation and Industrials indices, gaining 0.8% each. Top gainers were Qatar Navigation and Al Khaleej Takaful Insurance Co., rising 3.3% and 2.0%, respectively.
QNBFS Daily Technical Trader Qatar - September 24, 2023 التحليل الفني اليومي ...QNB Group
The General Index failed to sustain its breakout above the double-bottom formation’s neckline and continued with its decline into the formation’s territory.
QNBFS Daily Technical Trader Qatar - September 19, 2023 التحليل الفني اليومي ...QNB Group
The General Index failed to sustain its breakout above the double-bottom formation’s neckline and continued with its decline into the formation’s territory.
QNBFS Daily Market Report September 17, 2023QNB Group
The QE Index declined 0.5% to close at 10,319.3. Losses were led by the Industrials and Consumer Goods & Services indices, falling 1.4% and 1.1%, respectively.
QNBFS Daily Technical Trader Qatar - September 07, 2023 التحليل الفني اليومي ...QNB Group
The General Index failed to
sustain its breakout above the
double-bottom formation’s
neckline and continued with
its decline into the
formation’s territory.
how can i use my minded pi coins I need some funds.DOT TECH
If you are interested in selling your pi coins, i have a verified pi merchant, who buys pi coins and resell them to exchanges looking forward to hold till mainnet launch.
Because the core team has announced that pi network will not be doing any pre-sale. The only way exchanges like huobi, bitmart and hotbit can get pi is by buying from miners.
Now a merchant stands in between these exchanges and the miners. As a link to make transactions smooth. Because right now in the enclosed mainnet you can't sell pi coins your self. You need the help of a merchant,
i will leave the telegram contact of my personal pi merchant below. 👇 I and my friends has traded more than 3000pi coins with him successfully.
@Pi_vendor_247
What website can I sell pi coins securely.DOT TECH
Currently there are no website or exchange that allow buying or selling of pi coins..
But you can still easily sell pi coins, by reselling it to exchanges/crypto whales interested in holding thousands of pi coins before the mainnet launch.
Who is a pi merchant?
A pi merchant is someone who buys pi coins from miners and resell to these crypto whales and holders of pi..
This is because pi network is not doing any pre-sale. The only way exchanges can get pi is by buying from miners and pi merchants stands in between the miners and the exchanges.
How can I sell my pi coins?
Selling pi coins is really easy, but first you need to migrate to mainnet wallet before you can do that. I will leave the telegram contact of my personal pi merchant to trade with.
Tele-gram.
@Pi_vendor_247
how to sell pi coins effectively (from 50 - 100k pi)DOT TECH
Anywhere in the world, including Africa, America, and Europe, you can sell Pi Network Coins online and receive cash through online payment options.
Pi has not yet been launched on any exchange because we are currently using the confined Mainnet. The planned launch date for Pi is June 28, 2026.
Reselling to investors who want to hold until the mainnet launch in 2026 is currently the sole way to sell.
Consequently, right now. All you need to do is select the right pi network provider.
Who is a pi merchant?
An individual who buys coins from miners on the pi network and resells them to investors hoping to hang onto them until the mainnet is launched is known as a pi merchant.
debuts.
I'll provide you the Telegram username
@Pi_vendor_247
Exploring Abhay Bhutada’s Views After Poonawalla Fincorp’s Collaboration With...beulahfernandes8
The financial landscape in India has witnessed a significant development with the recent collaboration between Poonawalla Fincorp and IndusInd Bank.
The launch of the co-branded credit card, the IndusInd Bank Poonawalla Fincorp eLITE RuPay Platinum Credit Card, marks a major milestone for both entities.
This strategic move aims to redefine and elevate the banking experience for customers.
The Evolution of Non-Banking Financial Companies (NBFCs) in India: Challenges...beulahfernandes8
Role in Financial System
NBFCs are critical in bridging the financial inclusion gap.
They provide specialized financial services that cater to segments often neglected by traditional banks.
Economic Impact
NBFCs contribute significantly to India's GDP.
They support sectors like micro, small, and medium enterprises (MSMEs), housing finance, and personal loans.
how to sell pi coins on Bitmart crypto exchangeDOT TECH
Yes. Pi network coins can be exchanged but not on bitmart exchange. Because pi network is still in the enclosed mainnet. The only way pioneers are able to trade pi coins is by reselling the pi coins to pi verified merchants.
A verified merchant is someone who buys pi network coins and resell it to exchanges looking forward to hold till mainnet launch.
I will leave the telegram contact of my personal pi merchant to trade with.
@Pi_vendor_247
how to swap pi coins to foreign currency withdrawable.DOT TECH
As of my last update, Pi is still in the testing phase and is not tradable on any exchanges.
However, Pi Network has announced plans to launch its Testnet and Mainnet in the future, which may include listing Pi on exchanges.
The current method for selling pi coins involves exchanging them with a pi vendor who purchases pi coins for investment reasons.
If you want to sell your pi coins, reach out to a pi vendor and sell them to anyone looking to sell pi coins from any country around the globe.
Below is the contact information for my personal pi vendor.
Telegram: @Pi_vendor_247
US Economic Outlook - Being Decided - M Capital Group August 2021.pdfpchutichetpong
The U.S. economy is continuing its impressive recovery from the COVID-19 pandemic and not slowing down despite re-occurring bumps. The U.S. savings rate reached its highest ever recorded level at 34% in April 2020 and Americans seem ready to spend. The sectors that had been hurt the most by the pandemic specifically reduced consumer spending, like retail, leisure, hospitality, and travel, are now experiencing massive growth in revenue and job openings.
Could this growth lead to a “Roaring Twenties”? As quickly as the U.S. economy contracted, experiencing a 9.1% drop in economic output relative to the business cycle in Q2 2020, the largest in recorded history, it has rebounded beyond expectations. This surprising growth seems to be fueled by the U.S. government’s aggressive fiscal and monetary policies, and an increase in consumer spending as mobility restrictions are lifted. Unemployment rates between June 2020 and June 2021 decreased by 5.2%, while the demand for labor is increasing, coupled with increasing wages to incentivize Americans to rejoin the labor force. Schools and businesses are expected to fully reopen soon. In parallel, vaccination rates across the country and the world continue to rise, with full vaccination rates of 50% and 14.8% respectively.
However, it is not completely smooth sailing from here. According to M Capital Group, the main risks that threaten the continued growth of the U.S. economy are inflation, unsettled trade relations, and another wave of Covid-19 mutations that could shut down the world again. Have we learned from the past year of COVID-19 and adapted our economy accordingly?
“In order for the U.S. economy to continue growing, whether there is another wave or not, the U.S. needs to focus on diversifying supply chains, supporting business investment, and maintaining consumer spending,” says Grace Feeley, a research analyst at M Capital Group.
While the economic indicators are positive, the risks are coming closer to manifesting and threatening such growth. The new variants spreading throughout the world, Delta, Lambda, and Gamma, are vaccine-resistant and muddy the predictions made about the economy and health of the country. These variants bring back the feeling of uncertainty that has wreaked havoc not only on the stock market but the mindset of people around the world. MCG provides unique insight on how to mitigate these risks to possibly ensure a bright economic future.
Empowering the Unbanked: The Vital Role of NBFCs in Promoting Financial Inclu...Vighnesh Shashtri
In India, financial inclusion remains a critical challenge, with a significant portion of the population still unbanked. Non-Banking Financial Companies (NBFCs) have emerged as key players in bridging this gap by providing financial services to those often overlooked by traditional banking institutions. This article delves into how NBFCs are fostering financial inclusion and empowering the unbanked.
what is the best method to sell pi coins in 2024DOT TECH
The best way to sell your pi coins safely is trading with an exchange..but since pi is not launched in any exchange, and second option is through a VERIFIED pi merchant.
Who is a pi merchant?
A pi merchant is someone who buys pi coins from miners and pioneers and resell them to Investors looking forward to hold massive amounts before mainnet launch in 2026.
I will leave the telegram contact of my personal pi merchant to trade pi coins with.
@Pi_vendor_247
Poonawalla Fincorp and IndusInd Bank Introduce New Co-Branded Credit Cardnickysharmasucks
The unveiling of the IndusInd Bank Poonawalla Fincorp eLITE RuPay Platinum Credit Card marks a notable milestone in the Indian financial landscape, showcasing a successful partnership between two leading institutions, Poonawalla Fincorp and IndusInd Bank. This co-branded credit card not only offers users a plethora of benefits but also reflects a commitment to innovation and adaptation. With a focus on providing value-driven and customer-centric solutions, this launch represents more than just a new product—it signifies a step towards redefining the banking experience for millions. Promising convenience, rewards, and a touch of luxury in everyday financial transactions, this collaboration aims to cater to the evolving needs of customers and set new standards in the industry.
Poonawalla Fincorp and IndusInd Bank Introduce New Co-Branded Credit Card
QNBFS Daily Technical Trader - Qatar for January 28, 2019 التحليل الفني اليومي لبورصة قطر
1. Technical Spotlight
Sunday, January 14, 2018
1
اليومي الفني التحليل–قطر بورصة
Daily Technical Trader – QATAR
Monday, January 28, 2019
QSE Index Overview QSE Index Daily Chart الرسمالسوق لمؤشر اليومي البياني العام المؤشر على نظرة
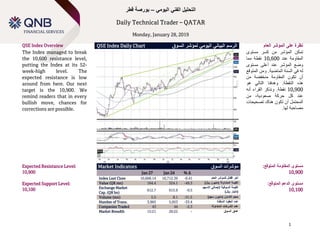
The Index managed to break
the 10,600 resistance level,
putting the Index at its 52-
week-high level. The
expected resistance is low
around from here. Our next
target is the 10,900. We
remind readers that in every
bullish move, chances for
corrections are possible.
تمكنالمؤشرمنكسرمستوى
المقاومةعند10,600نقطةمما
وضعالمؤشرعندأعلىمستوى
لهفيالماضية السنة.المتوقع ومن
أنتكونالمقاومةمنخفضةمن
النقطة هذه.وهدفناالتاليهو
10,900نقطة.ونذكرالقراءأنه
عندكلحركة،صعوديةمن
المحتملأنتكونهناكتصحيحات
.لها مصاحبة
Expected Resistance Level:
10,900
Expected Support Level:
10,100
Market Indicators السوق مؤشرات
Jan 27 Jan 24 % ∆
Index Last Close 10,668.14 10,712.39 -0.41 إقفال آخرالعام للمؤشر
Value (QR mn) 164.4 324.1 -49.3 )لاير (مليون المتداولة القيمة
Exchange Market
Cap. (QR bn)
612.7 615.9 -0.5
السوقية القيمةإلجمالياالسهم
)لاير (مليار
Volume (mn) 5.5 8.1 -31.5 )سهم (مليون التداول حجم
Number of Trans. 3,965 5,953 -33.4 عددالمنفذة العقود
Companies Traded 43 44 -2.3 المتداولة الشركات عدد
Market Breadth 15:21 20:22 – السوق عمق
:المتوقع المقاومة مستوى
10,900
:المتوقع الدعم مستوى
10,100
2. 2
COMMERCIAL BANK التجاري
Stock Overview Daily Chart البياني الرسماليومي نظرةعلىالسهم
The stock has been trading
inside a wide price range
(42.50-38.00) with well-
defined peaks and troughs
since August of last year. A
move above those peaks is
expected to have positive
impact on the upcoming
direction to the name.
يتداولسعرالسهمضمننطاق
افقي سعريالـ مستويي بين واسع
(42.50-38.00)هذ ومعالما
واضحة النطاقأنه حيث من
وقيعان قمم متكونو محددةمستوية
منذشهرأﻏسطسمنالعام
الماضي.منالمتوقعأنيكون
للحركةفوقتلكالقممتأثير
إيجابيعلىاالتجاهالقادمللسهم.
Expected Target Price:
QR44.20 – QR45.25
A price breakout above
QR42.50 triggers the buy
idea.
Suggested Stop-Loss Level:
Discretionary
Last Px. االقفال سعر %∆ %التغير Volume التداول حجم
42.00 0.00 24,544
Daily Resistance/Support والمقاومة الدعماليومية
Level 1st
األول 2nd
الثاني 3rd
الثالث المستوى
Resistance 42.50 44.20 45.25 مقاومة
Support 40.00 38.00 36.00 دعم
:المتوقعة السعرية األهداف
44.20لاير–45.25لاير
نرجحالشراءاختراق حال في
السعرمستوى فوق42.50لاير.
المقترح الخسارة ايقاف مستوى:
المتداول يالئم ما حسب
4. 4
Definitions
Candlestick: A chart that displays the high, low, opening and closing prices for a security in a single period. The body of the candle is made up by
the opening and the closing prices, i.e., the taller the body the greater the range between these two prices and vice versa. A colored candle
denotes a closing price that is lower than the opening price, while a white candle shows the opposite. The candlestick's shadows or wicks show
the period's high and low prices and how they compare to the opening and closing price. In general, the shape of the candle will vary upon the
positions of the period's high, low, opening and closing prices.
Support: A level that could cause more buyers to step in in order to prevent the security from falling or causing the security price to head higher.
Resistance: An inverse of a support level. A resistance area or level could cause more sellers to step in in order to prevent the security from rising
or causing the security price to head lower.
SMA (Simple Moving Average): Is an arithmetic average, which calculates the average price of a security over a defined number of periods and is
thus considered a lagging indicator. SMAs used in our analysis refer to closing prices. In general, SMAs serve many purposes, such as a
smoothing tool, an indicative price direction and potential support/resistance levels.
Market Breadth: Breadth indicates the number of securities that have closed higher vs. the number of decliners in a particular exchange.
MACD (Moving Average Convergence/Divergence): Is a trading indicator, which shows changes in the strength, direction, momentum and
duration of a trend in a stock's price through a collection of three time series calculated from historical closing price data.
RSI (Relative Strength Index): Is a momentum indicator that compares a security’s price gains to its losses for a predetermined number of periods
(we generally use 14 periods). The RSI attempts to point out how a security, in relative terms, is in the overbought/oversold zone. Securities with
a RSI above 70 could be considered as overbought, and below 30 could be considered as oversold.
Pattern/Formation: Is a graphical presentation of a security’s price activity over a certain period of time. Formations come in different shapes
(such as, head & shoulders, triangles, flags, and so on). They can be used to identify potential trends, reversal of trends, price targets, entry and
exit points, etc.
Fibonacci Retracements: Are horizontal lines that indicate expected areas of support/resistance for a security based on a predetermined price
movement. These levels are usually indicated by Fibonacci ratios of 23.6%, 38.2%, 50.0%, 61.8% and 100% from that particular movement.
Fibonacci Pivot and Intraday Support/Resistance: A Pivot Point is generally used to formulate expected future support/resistance levels. From
the base Pivot Point, Fibonacci multiples of the high-low differential are added to form resistance levels and subtracted to form support levels.
5. 5
Contacts
Zaid al-Nafoosi, CMT, CFTe
Senior Research Analyst
Tel: (+974) 4476 6535
zaid.alnafoosi@qnbfs.com.qa
Saugata Sarkar, CFA, CAIA
Head of Research
Tel: (+974) 4476 6534
saugata.sarkar@qnbfs.com.qa
Shahan Keushgerian
Senior Research Analyst
Tel: (+974) 4476 6509
shahan.keushgerian@qnbfs.com.qa
Ahmed El-Khudary
Head of Trading
Tel: (+974) 4476 6533
ahmed.elkhudary@qnbfs.com.qa
Feras al-Sarraj
Head of Sales
Tel: (+974) 4476 6514
feras.alsarraj@qnbfs.com.qa
QNB Financial Services
Contact Center: (+974) 4476 6666
PO Box 24025
Doha, Qatar
Disclaimer and Copyright Notice: This publication has been prepared by QNB Financial Services Co. W.L.L. (“QNBFS”) a wholly-owned subsidiary of Qatar National Bank (Q.P.S.C.)
(“QNB”). QNBFS is regulated by the Qatar Financial Markets Authority and the Qatar Exchange QNB SAQ is regulated by the Qatar Central Bank. This publication expresses the
views and opinions of QNBFS at a given time only. It is not an offer, promotion or recommendation to buy or sell securities or other investments, nor is it intended to constitute legal,
tax, accounting, or financial advice. QNBFS accepts no liability whatsoever for any direct or indirect losses arising from use of this report. Any investment decision should depend on
the individual circumstances of the investor and be based on specifically engaged investment advice. We therefore strongly advise potential investors to seek independent
professional advice before making any investment decision. Although the information in this report has been obtained from sources that QNBFS believes to be reliable, we have not
independently verified such information and it may not be accurate or complete. QNBFS does not make any representations or warranties as to the accuracy and completeness of the
information it may contain, and declines any liability in that respect. For reports dealing with Technical Analysis, expressed opinions and/or recommendations may be different or
contrary to the opinions/recommendations of QNBFS Fundamental Research as a result of depending solely on the historical technical data (price and volume). QNBFS reserves the
right to amend the views and opinions expressed in this publication at any time. It may also express viewpoints or make investment decisions that differ significantly from, or even
contradict, the views and opinions included in this report. This report may not be reproduced in whole or in part without permission from QNBFS.