QNBFS Daily Technical Trader Qatar - November 02, 2020 التحليل الفني اليومي لبورصة قطر
•
0 likes•40 views

The QE Index recently rebounded off moving averages but failed to move back above resistance at 9,850 points. The index is expected to weaken and test support again at 9,500 points. Doha Bank stock price corrected to an uptrend support level and formed a bullish candlestick pattern, indicating a possible bounce from current levels between QR2.53-QR2.65 per share. Technical terms like candlesticks, support/resistance levels, and moving averages are discussed.

Recommended
More Related Content
What's hot
What's hot (20)
Similar to QNBFS Daily Technical Trader Qatar - November 02, 2020 التحليل الفني اليومي لبورصة قطر
Similar to QNBFS Daily Technical Trader Qatar - November 02, 2020 التحليل الفني اليومي لبورصة قطر (20)
More from QNB Group
More from QNB Group (20)
Recently uploaded
Recently uploaded (20)
QNBFS Daily Technical Trader Qatar - November 02, 2020 التحليل الفني اليومي لبورصة قطر
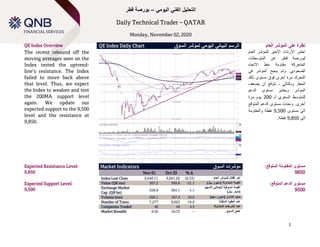
- 1. Technical Spotlight Sunday, January 14, 2018 1 اليومي الفني التحليل–قطر بورصة Daily Technical Trader – QATAR Monday, November 02, 2020 QE Index Overview QE Index Daily Chart السوق لمؤشر اليومي البياني الرسم العام المؤشر على نظرة The recent rebound off the moving averages seen on the Index tested the uptrend- line’s resistance. The Index failed to move back above that level. Thus, we expect the Index to weaken and test the 200MA support level again. We update our expected support to the 9,500 level and the resistance at 9,850. األخير االرتداد اختبرللمؤشرالعام قطر لبورصةعالمتوسطات ن المتحركةاالتجاه خط مقاومة .الصعوديينجح ولمافي لمؤشر فوق أخرى مرة التحركمستوىذلك الخطيضعف أن نتوقع ، وبالتالي . الدعم مستوى ويختبر المؤشر لـ السعري للمتوسط200يوممرة .أخرىالمتوقع الدعم مستوى ونحدث مستوى الى9,500والمقاومة نقطة الى9,850.نقطة Expected Resistance Level: 9,850 Expected Support Level: 9,500 Market Indicators السوق مؤشرات Nov 01 Oct 29 % ∆ Index Last Close 9,640.11 9,691.02 (0.53) العام للمؤشر إقفال آخر Value (QR mn) 307.2 389.6 -21.1 )لاير (مليون المتداولة القيمة Exchange Market Cap. (QR bn) 558.8 565.1 -1.1 السوقية القيمةإلجمالياالسهم )لاير (مليار Volume (mn) 206.1 187.4 10.0 )سهم (مليون التداول حجم Number of Trans. 7,277 8,662 -16.0 المنفذة العقود عدد Companies Traded 46 44 4.5 المتداولة الشركات عدد Market Breadth 9:36 10:33 – السوق عمق :المتوقع المقاومة مستوى 9850 :المتوقع الدعم مستوى 9500
- 2. 2 Doha Bank الدوحة بنك Stock Overview Daily Chart اليومي البياني الرسم نظرةعلىالسهم The price has corrected and reached the uptrend support level. The price has also created a bullish-reversal candlesticks formation against that correction; that indicates a possible bounce from the current levels. مستوى إلى ووصل السعر تصحيح تم دعمخط.الصعودي االتجاهوكون تشكيل اًضأي السعرمن سعري الشمعداناتاالنعكاسيةالصعودية مقابلالتصحيحالمذكوريشير ؛ذلك المستويات من محتمل ارتداد إلى .الحالية Expected Target Price: QR2.53 – QR2.65 A price breakout above QR2.45 triggers the buy idea. Suggested Stop-Loss Level: Discretionary Last Px. االقفال سعر %∆ %التغير Volume التداول حجم 2.44 0.41 718,377 Resistance/Support / الدعمالمقاومة Level 1st األول 2nd الثاني 3rd الثالث المستوى Resistance 2.45 2.53 2.65 مقاومة Support 2.37 2.30 2.20 دعم األ:المتوقعة السعرية هداف 2.53لاير–2.65لاير نرجحالشراءالسعر اختراق حال في مستوى فوق2.45.لاير المقترح الخسارة ايقاف مستوى: المتداول يالئم ما حسب
- 3. 3 :التعريفات :اليابانية الشموع.محددة فترة خالل السهم وصله سعر وأدنى وأعلى واإلغالق االفتتاح سعر الرسم يحدد .قديمة يابانية طريقة على األسعار رسم طرق أحد وهيوتتكون ا ""جسم من الشمعةبسعر تتحدد حيث لشمعةاالفتتاحوسع أن تعني الملونة الشمعة .اإلغالقو االفتتاح سعر من أقل اإلغالق رصحي العكسللشمعة .البيضاء للشمعة بالنسبة ح عامة بصورة .المطلوبة الفترة خالل السهم وصله سعر وأقل أعلى يحدد لظل وهذا الشمعة ""ظل بـ يسمى ما اليابانية،التجاه استمرار من كثيرة دالالت له الشمعة شكل فإن .انعكاسه أو السهم :الدعم مستوىوهوا يشارك أن فيه يتوقع الذي المستوىلمتداولالبيع من أكثر الشراء على فيه ين،.دنية مستويات إلى السهم انخفاض احتمال من يقلل وهذا :المقاومة مستوىالدعم مستوى عكس وهو،الشراء من أكثر بالبيع المتداولون يقوم أن يتوقع حيث،.أعلى مستويات الى السهم ارتفاع احتمال من يقلل وذلك :البسيط المتحرك المتوسطالمؤش هذا يعتبر السبب لهذا المختارة الفترات من محدد عدد على السهم سعر معدل يحسب حسابي متوسط هوالبيع عالمات إعطاء في متأخر ر وت السعر اتجاه لمعرفة أداة مثل ،كثيرة أغراضا للمتوسطات ،عام بشكل .اإلغالق أسعار تستخدم تحليلنا في المستخدمة المتوسطات .الشراء،أشيريالسعر تقلبات حدة تقليل و.االستخدامات من ذلك غير وإلى والمقاومة للدعم المحتملة المستويات ال عمق:سوقاأل عدد إلى يشيرو تداولها تم التي المالية وراق.معين يوم تبادل في المتراجعة األسهم عدد مقابل ارتفاع على أقفلت ( التباعد / التقارب المتحرك المتوسطMACD:)مؤشر هوو قوة في التغيرات على يدل تداولحسابات مجموعة خالل من األسهم أسعار وزخم اتجاهمكونةسالسل ثالثة من اإلغالق أسعار بيانات من محسوبة زمنية.التاريخية ( النسبية القوة مؤشرRSI:)وهوذروة لتحديد منه محاولة معينة فترة خالل السهم سعر تحرك قوة يقارن فني مؤشرال يتذبذب .المتداولين قبل من البيع أو الشراءبين مؤشر ال0وال100و .درجةعام بشكل،ال فوق قراءات الى المؤشر وصول يعتبر70ال وتحت الشراء ذروة مناطق الى وصل قد السعر بأن درجة30ذروة لمستويات درجة .البيع :األسعار شكل / نمطوهوالرأ (مثل مختلفة أشكال في السعرية األنماط هذه وتأتي .الفني التحليل وسط في تداولها يتم معينة أشكال حسب السهم سعر لحركة استقراءوالكتف سين و .)الخ ،واألعالم ،والمثلثاتوغيره والخروج الدخول ونقاط انعكاسها أو السهم لحركة المحتملة االتجاهات لتحديد األشكال تستخدم.االستخدامات من ا :فيبوناتشي انسحاباتلعا االنسحابات هذه نسبتفيبوناتشي ليوناردو الرياضيات لم،وعلى السهم لسعر المقاومة أو للدعم المتوقعة المناطق إلى تشير التي األفقية الخطوط هي االنسحاب مستويات كأهم للسهم التالية المستويات تستخدم .السابقة األسعار حركة أساسوهي السهم لذلك السابقة للحركة المحتملة ات23.6,%38.2,%50.0,%61.8% ال ومستوى100.0.السابقة الحركة أجزاء من % و فيبوناتشي محور:البينية والمقاومة الدعم مستوياتمع اإلغالق سعر من معينة حسابات المحور لهذا .أعاله المذكورة لالنسحابات تماما مختلف وهذاسعر أعلىوسعر أقل ا لليومو دعم مستويات منها يستخلص لسابق.اليومي للتداول متوقعة بينية مقاومة
- 4. 4 Definitions Candlestick: A chart that displays the high, low, opening and closing prices for a security in a single period. The body of the candle is made up by the opening and the closing prices, i.e., the taller the body the greater the range between these two prices and vice versa. A colored candle denotes a closing price that is lower than the opening price, while a white candle shows the opposite. The candlestick's shadows or wicks show the period's high and low prices and how they compare to the opening and closing price. In general, the shape of the candle will vary upon the positions of the period's high, low, opening and closing prices. Support: A level that could cause more buyers to step in in order to prevent the security from falling or causing the security price to head higher. Resistance: An inverse of a support level. A resistance area or level could cause more sellers to step in in order to prevent the security from rising or causing the security price to head lower. SMA (Simple Moving Average): Is an arithmetic average, which calculates the average price of a security over a defined number of periods and is thus considered a lagging indicator. SMAs used in our analysis refer to closing prices. In general, SMAs serve many purposes, such as a smoothing tool, an indicative price direction and potential support/resistance levels. Market Breadth: Breadth indicates the number of securities that have closed higher vs. the number of decliners in a particular exchange. MACD (Moving Average Convergence/Divergence): Is a trading indicator, which shows changes in the strength, direction, momentum and duration of a trend in a stock's price through a collection of three-time series calculated from historical closing price data. RSI (Relative Strength Index): Is a momentum indicator that compares a security’s price gains to its losses for a predetermined number of periods (we generally use 14 periods). The RSI attempts to point out how a security, in relative terms, is in the overbought/oversold zone. Securities with a RSI above 70 could be considered as overbought, and below 30 could be considered as oversold. Pattern/Formation: Is a graphical presentation of a security’s price activity over a certain period of time. Formations come in different shapes (such as, head & shoulders, triangles, flags, and so on). They can be used to identify potential trends, reversal of trends, price targets, entry and exit points, etc. Fibonacci Retracements: Are horizontal lines that indicate expected areas of support/resistance for a security based on a predetermined price movement. These levels are usually indicated by Fibonacci ratios of 23.6%, 38.2%, 50.0%, 61.8% and 100% from that particular movement. Fibonacci Pivot and Intraday Support/Resistance: A Pivot Point is generally used to formulate expected future support/resistance levels. From the base Pivot Point, Fibonacci multiples of the high-low differential are added to form resistance levels and subtracted to form support levels.
- 5. 5 Contacts Zaid al-Nafoosi, CMT, CFTe Senior Research Analyst Tel: (+974) 4476 6535 zaid.alnafoosi@qnbfs.com.qa Shahan Keushgerian Senior Research Analyst Tel: (+974) 4476 6509 shahan.keushgerian@qnbfs.com.qa Mehmet Aksoy, PhD Senior Research Analyst Tel: (+974) 4476 6589 mehmet.aksoy@qnbfs.com.qa Saugata Sarkar, CFA, CAIA Head of Research Tel: (+974) 4476 6534 saugata.sarkar@qnbfs.com.qa Ahmed El-Khudary Head of Trading Tel: (+974) 4476 6533 ahmed.elkhudary@qnbfs.com.qa Feras al-Sarraj Head of Sales Tel: (+974) 4476 6514 feras.alsarraj@qnbfs.com.qa QNB Financial Services Contact Center: (+974) 4476 6666 PO Box 24025 Doha, Qatar Disclaimer and Copyright Notice: This publication has been prepared by QNB Financial Services Co. W.L.L. (“QNBFS”) a wholly-owned subsidiary of Qatar National Bank (Q.P.S.C.) (“QNB”). QNBFS is regulated by the Qatar Financial Markets Authority and the Qatar Exchange QNB SAQ is regulated by the Qatar Central Bank. This publication expresses the views and opinions of QNBFS at a given time only. It is not an offer, promotion or recommendation to buy or sell securities or other investments, nor is it intended to constitute legal, tax, accounting, or financial advice. QNBFS accepts no liability whatsoever for any direct or indirect losses arising from use of this report. Any investment decision should depend on the individual circumstances of the investor and be based on specifically engaged investment advice. We therefore strongly advise potential investors to seek independent professional advice before making any investment decision. Although the information in this report has been obtained from sources that QNBFS believes to be reliable, we have not independently verified such information and it may not be accurate or complete. QNBFS does not make any representations or warranties as to the accuracy and completeness of the information it may contain, and declines any liability in that respect. For reports dealing with Technical Analysis, expressed opinions and/or recommendations may be different or contrary to the opinions/recommendations of QNBFS Fundamental Research as a result of depending solely on the historical technical data (price and volume). QNBFS reserves the right to amend the views and opinions expressed in this publication at any time. It may also express viewpoints or make investment decisions that differ significantly from, or even contradict, the views and opinions included in this report. This report may not be reproduced in whole or in part without permission from QNBFS.