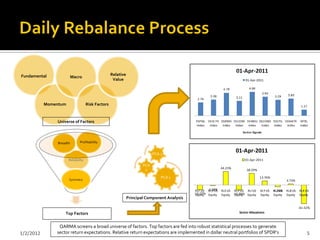
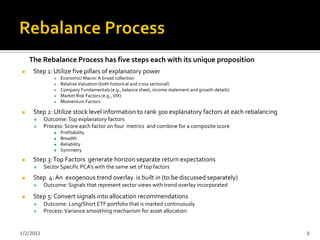
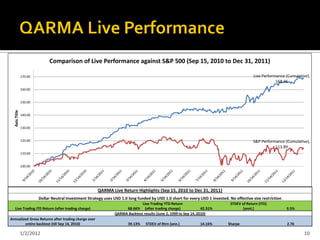
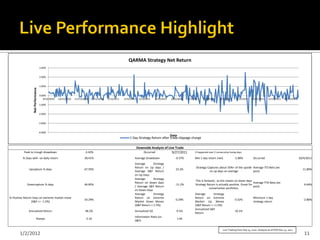
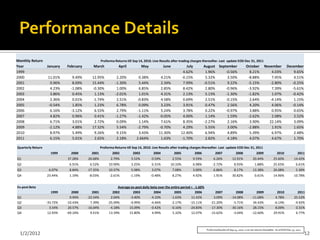
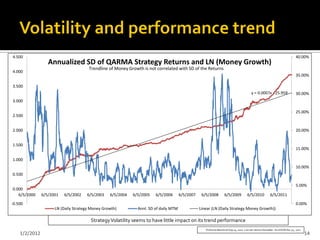
Proprietary and Confidential


Investor Presentation

Partha Chakraborty, Ph.D., CFA
    Introduction (Page 3)

    Strategy Discussion (Pages 4 - 9)
          Investment Strategy and Rebalancing Process
          Investment and Implementation Edge
          Risk Management

    Performance Presentation (Pages 10 – 16)
          Live Performance
          Pro-forma results analyses

    Live Performance when S&P return < = -1.5% (Page 17)

    Future Directions (Page 18)
‘
    Manager and Advisor Profile (Page 19)

    Fund Details (Page 20)

1/2/2012                                                    2
QARMA is a unique, risk aware and quantitative approach to Equity
     Investments that monetizes relative performance of GICS sectors with Dollar
     Neutral Portfolios of highly liquid unlevered ETF’s.
            GICS Sector Relative Performance is the source of Alpha
             ▪     GICS Sectors are traditionally considered “too big to be imperfect” based solely on top down analyses and on any given
                   day, returns of GICS sectors are different
             ▪     Relative GICS sector betas can be a source of Alpha that is impossible to arbitrage away
             ▪     Model generates dollar neutral portfolios that implements views on relative return expectations over a 1 day horizon
            Unique, Systematic and Dynamic Approach
             ▪     Only known model meeting all necessary conditions for a supernormal economic profits in a factor universe
             ▪     Factors are chosen based on bottom-up security data with distribution free methodology
             ▪     Model rebalances daily, essentially “recalibrating” itself dynamically using newly selected factors
            Risk Aware Investments
             ▪     All instruments are exchange traded, liquid and unlevered- no counterparty risk, no hidden leverage, full price discovery
             ▪     Current implementation is Reg-T, no explicit or implicit leverage; model very adaptable to other specifications

                                        Absolute Performance                                       Relative Performance
     As of                                                                              Index = S&P 500                 Index = US Cash
                                                                                                                                    Relative
  12/31/2011           Strategy (Net)      St Dev     Sharpe     Average Beta   Index Perf    Relative Performance   Index Perf   Performance

                 ITD           68.66%         9.46%       5.18        11.80%         13.89%                 54.77%       0.34%          68.32%
                 YTD           42.31%        10.16%       4.11         6.82%          0.95%                 41.36%       0.25%          42.05%

             QTD               10.78%        12.10%       4.13         6.77%         11.23%                 -0.44%       0.05%          10.73%
             MTD                1.70%         7.84%       2.86         1.60%          0.86%                  0.84%       0.02%           1.68%
1/2/2012                                                                                                                                         3
    Macro Investments based on GICS Sectors
           ▪ GICS sectors will almost never move in parallel, a relative performance strategy may be
             profitable
           ▪ Macro sectors are not “too big to be imperfect”
           ▪ Top down relative performance analyses have proven ineffective, no known research on a
             bottom up approach

    Quantitative core has key advantages
           ▪ Comprehensive factor modeling with a novel filtering tool
           ▪ Top down and bottom up approaches combined together in a harmonious whole
           ▪ Dynamic modeling approach “rebuilds” the model from scratch at every rebalance

    Trend Overlay accommodates short holding period
           ▪ QARMA utilizes a 10D view on flow and stock variables at multiple horizons

    Portfolio Construction
           ▪   Dollar neutral Reg-T portfolio of highly liquid unlevered ETF’s
           ▪   No counterparty risk, no pricing risk, no hidden leverage
           ▪   No specific risk - sector beta is the only source of alpha
           ▪   Extensive and rigorous back-test over entire lifetime of the instruments used
           ▪   Hard coded risk mitigation never hit in live trading or extensive back-test


1/2/2012                                                                                               4
Fundamental                                        Relative
                          Macro
                                                    Value


           Momentum                 Risk Factors


               Universe of Factors


                Breadth       Profitability


                                                                            PCA 3
                                                                                                                       01-Apr-2011
                      Reliability                                                                                           01-Apr-2011
                                                                      PCA
                                                                                                              44.23%
                                                                       2                                                     38.29%

                                                                                PCA 1                                                 13.76%
                      Symmetry                                                                                                                           3.73%

                                                                                              XLF US -1.68%
                                                                                                     XLV US   XLE US XLP US XLI US     XLY US   XLU US
                                                                                                                                                -5.78%   XLB US   XLK US
                                                                                             -15.07% Equity
                                                                                              Equity          Equity -15.95% Equity
                                                                                                                      Equity           Equity   Equity   Equity   Equity
                                                              Principal Component Analysis

                                                                                                                                                                  -61.52%
                    Top Factors                                                                                         Sector Allocations


                QARMA screens a broad universe of factors. Top factors are fed into robust statistical processes to generate
1/2/2012       sector return expectations. Relative return expectations are implemented in dollar neutral portfolios of SPDR’s                                         5
The Rebalance Process has five steps each with its unique proposition
    Step 1: Utilize five pillars of explanatory power
                  Economic/ Macro: A broad collection
                  Relative Valuation (both historical and cross sectional)
                  Company Fundamentals (e.g., balance sheet, income statement and growth details)
                  Market Risk Factors (e.g., VIX)
                  Momentum Factors

    Step 2: Utilize stock level information to rank 300 explanatory factors at each rebalancing
          Outcome: Top explanatory factors
          Process: Score each factor on four metrics and combine for a composite score
                  Profitability
                  Breadth
                  Reliability
                  Symmetry
    Step 3: Top Factors generate horizon separate return expectations
          Sector Specific PCA’s with the same set of top factors
    Step 4: An exogenous trend overlay is built in (to be discussed separately)
          Outcome: Signals that represent sector views with trend overlay incorporated

    Step 5: Convert signals into allocation recommendations
          Outcome: Long/Short ETF portfolio that is marked continuously
          Process: Variance smoothing mechanism for asset allocation


1/2/2012                                                                                             6
QARMA has an explicit trend overlay built in.

    Higher frequency implies elevated importance of market microstructure
          QARMA has about 190% daily turnover at 200% gross exposure
          Price moves may move reflect opportunities otherwise unexplored

    9 Sector ETF’s imply 10D views
          Nine sector ETF’s lend themselves to 10D view
          Both sector composition in S&P (“stock”) and price moves (“flow”) can be viewed in 10D
          Each can be viewed at multiple horizons

    QARMA utilizes 10D stock and flow views at shorter horizons
          Stock and flow each are ranked in 10D at 1 week, 2 weeks, 1 & 3 month horizons
          A proprietary process combines these data points into a score for each sector
          Scores are then combined with sector return expectations to come up with Sector Signals (input to
           Step 5 of Rebalance Process).


1/2/2012                                                                                                       7
Strategy implementation has district advantages built in.

    Instrument Choice: Deliberate commensurate with value proposition
          All instruments are exchange traded, highly liquid and low cost
          Shorting allowed on downticks
          Deliberate choice of instruments to avoid hidden leverage

    Capacity and Market Liquidity: Highly favorable
          ETF market size exceeds USD 1 trillion and no explicit cap on size
          Expense ratios average 21bps annualized. Estimated average bid offer spread 38 bps annualized.
          Financing costs contained by self-imposed explicit cap on leverage
          Much lower borrow risk than single stocks

    Strategy Unwind: Performance drag built into back-test data
          Portfolio trade at target @OPEN currently, improvements possible
          A performance drag per rebalancing is already built in for pro-forma calculations


1/2/2012                                                                                                    8
Strategy takes a comprehensive approach to risk

    Risk Philosophy
          Risk and return are two sides of the same coin
          Risk management built in at the level of portfolio construction

    Portfolio Risk
          Leverage: Capped at +1/-1 units for 1 unit of capital
          Liquidity: Trade only the most liquid, unlevered, exchange traded ETFs
          Concentration: No single stock risk, though we will take concentrated long/short sector positions
          Model: Models and data continually undergo scrutiny/sanity checks
          Factors: Exposure to certain risk factors can be easily constrained

    Operational Risk
          Madoff: Third Party Fund Administrator independently will certify prices and reconciles trades
          Galleon: Process explicitly depends only on publicly available information, with no first call


1/2/2012                                                                                                       9
Comparison of Live Performance against S&P 500 (Sep 15, 2010 to Dec 31, 2011)

               170.00                                                                                                                        Live Performance (Cumulative),
                                                                                                                                                         168.66
               160.00


               150.00
  Axis Title


               140.00


               130.00


               120.00                                                                                                                        S&P Performance (Cumulative),
                                                                                                                                                        113.89
               110.00


               100.00


                                                        QARMA Live Return Highlights (Sep 15, 2010 to Dec 31, 2011)
                        Dollar Neutral Investment Strategy uses USD 1.0 long funded by USD 1.0 short for every USD 1 invested. No effective size restriction
                                                                               Live Trading YTD Return                          STDEV of Return (ITD)
   Live Trading ITD Return (after trading charge)                     68.66% (after trading charge)                42.31%              (annl.)                 9.5%
                                                                 QARMA Backtest results (June 2, 1999 to Sep 14, 2010)
Annualized Gross Returns after trading charge over
         entire backtest (till Sep 14, 2010)                            39.13%    STDEV of Rtrn (ann.)            14.16%      Sharpe                           2.76

               1/2/2012                                                                                                                                                10
QARMA Strategy Net Return
                                   3.00%


                                   2.00%


                                   1.00%
                 Net Performance


                                   0.00%
                                      9/15/2010   10/15/2010   11/15/2010   12/15/2010   1/15/2011   2/15/2011    3/15/2011   4/15/2011   5/15/2011   6/15/2011   7/15/2011      8/15/2011      9/15/2011    10/15/2011    11/15/2011     12/15/2011

                                   -1.00%


                                   -2.00%


                                   -3.00%


                                   -4.00%
                                                                                                                                     Date
                                                                                                         1 Day Strategy Return after trade slippage charge

                                                                                                                 Downside Analysis of Live Trade
          Peak to trough drawdown                                     -3.42%                                        Occurred             9/27/2011         It happened over 2 consecutive losing days

         % Days with -ve daily return                                 38.41%                                 Average Drawdown                -0.37%        Min 1 day return (net)             -2.80%          Occurred                                 10/4/2011
                                                                                                             Average       Strategy
                                                                                                             Return on Up days /                            Strategy Captures about 50%+ of the upside Average ITD Beta (ex-
              Upcapture % days                                        67.93%                                                                 23.2%                                                                                                       11.80%
                                                                                                             Average S&P Return                                        on up days on average           post)
                                                                                                             on Up Days
                                                                                                             Average       Strategy
                                                                                                                                                            This is fantastic, as this means on down days
                                                                                                             Return on Down days                                                                            Average YTD Beta (ex-
            Downcapture % days                                        46.85%                                                                 -11.2%         Strategy Return is actually positive. Great for                                               6.64%
                                                                                                             / Average S&P Return                                                                           post)
                                                                                                                                                                        conservative portfolios.
                                                                                                             on Down Days
                                                                                                             Average       Strategy                        Average       Strategy
% Positive Return Days on extreme market move                                                                Return on Extreme                             Return on Extreme                                  Minimum 1 day
                                                                      54.29%                                                                 0.29%                                             0.32%                                                      -2.80%
                 (S&P <= -1.5%)                                                                              Market Down Moves                             Market Up Moves                                    strategy return
                                                                                                             (S&P Return <-1.5%)                           (S&P Return > +1.5%)
                                                                                                                                                           Annualized S&P
              Annualized Return                                        48.2%                                 Annualized SD                    9.5%                                             10.1%
                                                                                                                                                           Return
                                                                                                             Information Ratio (vs
                           Sharpe                                       5.10                                                                  1.64
                                                                                                             S&P)


                                                                                                                                                                                   Live Trading from Sep 15, 2010. Analysis as of EOD Dec 31, 2011
       1/2/2012                                                                                                                                                                                                                                           11
Monthly Return                                    Proforma Returns till Sep 14, 2010. Live Results after trading charges thereafter. Last update EOD Dec 31, 2011
Year               January   February      March              April            May            June          July           August September                     October          November            December
1999                                                                                                      4.62%             1.96%     -0.56%                      8.21%              4.03%               9.65%
2000                11.01%      9.49%      12.95%            2.20%         0.38%          4.21%          -0.15%             5.32%      3.50%                     -8.88%              7.45%               4.51%
2001                 0.96%      8.69%      15.44%           -1.30%         5.44%          2.34%           7.99%            -0.51%      9.22%                     -5.15%             -2.80%              -0.25%
2002                 4.23%     -1.08%      -0.30%            1.00%         6.85%          2.85%           8.42%             2.80%     -0.96%                     -3.92%              7.39%              -5.61%
2003                 3.86%      0.45%       1.13%           -2.01%         1.01%          4.31%           2.13%             5.13%     -1.30%                     -1.82%              1.07%              -0.42%
2004                 2.36%      0.01%      -1.74%            2.51%        -0.83%          4.58%           0.69%             2.51%     -0.15%                      2.64%             -4.14%               1.15%
2005                -0.54%      1.85%       1.23%            6.78%         0.09%          3.23%           3.91%             0.47%      2.56%                      4.20%              4.06%              -0.14%
2006                 6.16%     -3.12%       6.55%            2.79%        -1.11%          5.24%           3.78%             0.22%     -0.97%                      3.88%              0.95%               0.65%
2007                 4.82%      0.96%       0.41%           -1.27%        -1.42%         -0.05%           4.00%             1.14%      1.59%                     -2.62%              2.08%               2.52%
2008                 6.71%      3.01%       2.72%            0.09%         1.14%          7.61%           8.35%            -2.27%      2.16%                      3.90%            22.14%                3.09%
2009                -2.12%      4.88%      17.32%            5.54%        -2.79%         -0.70%           4.29%             5.55%      3.00%                     -2.88%              1.91%               1.65%
2010                 8.97%      5.49%       9.26%            9.15%         3.43%         11.30%          12.40%             6.94%      4.89%                      5.39%              6.97%               2.48%
2011                 6.15%      5.01%       2.65%            2.18%        2.664%          1.63%          -1.70%             2.82%      4.18%                      4.07%              4.67%               1.70%

Quarterly Return                                  Proforma Returns till Sep 14, 2010. Live Results after trading charges thereafter. Last update EOD Dec 31, 2011
                     1999      2000       2001            2002          2003          2004           2005          2006            2007               2008               2009               2010               2011
Q1                           37.28%     26.68%           2.79%         5.52%         0.59%           2.55%         9.59%          6.26%            12.91%             20.44%             25.60%             14.42%
Q2                            6.91%      6.52%         10.99%          3.25%         6.31%        10.33%           6.98%         -2.72%              8.93%              1.88%            25.65%               6.61%
Q3                  6.07%     8.84%     17.35%         10.37%          5.98%         3.07%           7.08%         3.00%          6.86%              8.17%            13.38%             26.08%               5.30%
Q4                 23.44%     1.19%      -8.03%         -2.61%        -1.19%         -0.48%          8.27%         4.92%          1.91%            30.82%               0.61%            14.96%             10.78%


Ex-post Beta                                                 Average ex-post daily beta over the entire period = -1.60%
                     1999       2000       2001           2002        2003           2004          2005          2006             2007               2008               2009               2010               2011
Q1                             0.94%    -22.54%          2.04%      -3.40%         -4.10%        -1.63%        11.42%            3.09%            -14.08%            -11.68%              4.78%             25.52%
Q2                 -33.72%   -10.43%      7.39%        -25.09%      -0.99%         -4.46%        -2.17%       -15.11%          -21.20%             -5.71%             34.43%             -6.14%             -4.92%
Q3                   3.54%    20.57%    -16.04%         -4.18%      15.09%         -0.42%        -0.16%       -24.83%          -17.30%            -30.16%             28.15%              8.00%              0.31%
Q4                  12.93%   -69.24%      9.41%         13.39%      15.80%          4.99%         5.32%        12.07%          -15.62%             -3.04%            -12.60%             29.91%              6.77%


                                                                                                                            Proforma Results till Sep 14, 2010. Live net returns thereafter. As of EOD Dec 31, 2011
 1/2/2012                                                                                                                                                                                                             12
0
                                                                                                                                                                                                                          0


                                                                                                                                           20
                                                                                                                                           40
                                                                                                                                           60
                                                                                                                                           80
                                                                                                                                                                                                                              50


                                                                                                                                          100
                                                                                                                                          120
                                                                                                                                          140
                                                                                                                                          160
                                                                                                                                          180
                                                                                                                                                                                                                                   100
                                                                                                                                                                                                                                         150
                                                                                                                                                                                                                                               200
                                                                                                                                                                                                                                                     250
                                                                                                                                 -10.3%                                                                          -8.58%


1/2/2012
                                                                                                                                  -9.5%                                                                          -8.15%
                                                                                                                                  -8.7%                                                                          -7.71%
                                                                                                                                  -7.9%                                                                          -7.28%
                                                                                                                                  -7.1%                                                                          -6.85%
                                                                                                                                  -6.3%                                                                          -6.41%
                                                                                                                                  -5.4%                                                                          -5.98%
                                                                                                                                  -4.6%                                                                          -5.54%
                                                                                                                                  -3.8%                                                                          -5.11%
                                                                                                                                  -3.0%                                                                          -4.68%
                                                                                                                                  -2.2%                                                                          -4.24%
                                                                                                                                  -1.4%                                                                          -3.81%
                                                                                                                                  -0.6%                                                                          -3.38%
                                                                                                                                   0.2%                                                                          -2.94%
                                                                                                                                   1.0%                                                                          -2.51%
                                                                                                                                   1.8%                                                                          -2.07%
                                                                                                                                   2.7%                                                                          -1.64%
                                                                                                                                   3.5%                                                                          -1.21%
                                                                                                                                   4.3%                                                                          -0.77%
                                                                                                                                   5.1%                                                                          -0.34%
                                                                                                                                   5.9%                                                                           0.09%
                                                                                                                                   6.7%                                                                           0.53%
                                                                                                                                   7.5%                                                                           0.96%
                                                                                                                                   8.3%                                                                           1.40%
                                                                                                                                   9.1%                                                                           1.83%
                                                                                                                                  10.0%                                                                           2.26%
                                                                                                                                  10.8%                                                                           2.70%
                                                                                                                                  11.6%                                                                           3.13%
                                                                                                                                  12.4%                                                                           3.56%
                                                                                                                                                                                   Histogram of Weekly Returns


                                                                                                  Histogram of 1 Month Returns
                                                                                                                                  13.2%                                                                           4.00%
                                                                                                                                  14.0%                                                                           4.43%
                                                                                                                                  14.8%                                                                           4.87%
                                                                                                                                                                                                                                                           5 Trading Day Return Histogram


                                                                                                                                  15.6%                                                                           5.30%
                                                                                                                                                1 Month Rolling Return Histogram


                                                                                                                                  16.4%                                                                           5.73%
                                                                                                                                  17.2%                                                                           6.17%
                                                                                                                                  18.1%                                                                           6.60%
                                                                                                                                  18.9%                                                                           7.03%
                                                                                                                                  19.7%                                                                           7.47%
                                                                                                                                  20.5%                                                                           7.90%
                                                                                                                                  21.3%                                                                           8.34%
                                                                                                                                  22.1%                                                                           8.77%
                                                                                                                                  22.9%                                                                           9.20%
                                                                                                                                  23.7%                                                                           9.64%
                                                                                                                                  24.5%                                                                          10.07%
                                                                                                                                  25.3%                                                                          10.50%
                                                                                                                                  26.2%                                                                          10.94%
                                                                                                                                  27.0%                                                                          11.37%
                                                                                                                                  27.8%                                                                          11.81%
                                                                                                                                  28.6%                                                                          12.24%
                                                                                                                                  29.4%                                                                          12.67%
       Proforma Results till Sep 14, 2010. Live net returns thereafter. As of EOD Dec 31,, 2011
13
4.500                                                                                                                                                                                  40.00%
                  Annualized SD of QARMA Strategy Returns and LN (Money Growth)
                                      Trendline of Money Growth is not correlated with SD of the Returns
4.000
                                                                                                                                                                                       35.00%

3.500
                                                                                                                                              y = 0.0007x - 25.959                     30.00%
3.000

                                                                                                                                                                                       25.00%
2.500


2.000                                                                                                                                                                                  20.00%


1.500
                                                                                                                                                                                       15.00%

1.000
                                                                                                                                                                                       10.00%
0.500

                                                                                                                                                                                       5.00%
0.000
   6/5/2000    6/5/2001   6/5/2002   6/5/2003    6/5/2004   6/5/2005   6/5/2006       6/5/2007    6/5/2008           6/5/2009             6/5/2010             6/5/2011

-0.500                                                                                                                                                                                 0.00%
                     LN (Daily Strategy Money Growth)         Annl. SD of daily MTM              Linear (LN (Daily Strategy Money Growth))

                                       Strategy Volatility seems to have little impact on its trend performance
                                                                                                    Proforma Results till Sep 14, 2010. Live net returns thereafter. As of EOD Dec 31,, 2011
    1/2/2012                                                                                                                                                                                   14
Daily Perf against Daily VIX level
    10.00%

D
     8.00%
a
i
l    6.00%
y
     4.00%
P
e 2.00%
r
                                                                                                                            y = 6E-05x - 4E-05
f 0.00%
o        0          10              20              30             40          50                 60                         70                          80                           90
r -2.00%
m
a -4.00%
n
c -6.00%
e
    -8.00%
                                                                        VIX

               1 Day Strategy Return after trade slippage charge        Linear (1 Day Strategy Return after trade slippage charge)

                                      QARMA is not an explicit nor implicit bet on market volatility

                                                                                            Proforma Results till Sep 14, 2010. Live net returns thereafter. As of EOD Dec 31, 2011
    1/2/2012                                                                                                                                                                          15
Perf attrib. to largest bet                                 Biggest bets on average contributed positive amount every month (64.9 bps per day on avg)
Year          January        February             March           April            May             June           July              August           September October     November December
1999                                                                                                      0.47%             0.43%            0.58%         0.81%     0.71%      0.64%    0.60%
2000                      0.82%           0.85%           1.12%            1.16%           0.89%          0.75%             0.66%            0.62%         0.88%     1.08%      0.94%    0.84%
2001                      0.79%           0.92%           0.83%            0.74%           0.66%          0.52%             0.76%            0.35%         1.57%     0.90%      0.74%    0.52%
2002                      0.63%           0.59%           0.56%            0.48%           0.59%          0.61%             1.57%            1.02%         0.87%     1.30%      1.07%    0.48%
2003                      0.68%           0.60%           0.86%            0.62%           0.67%          0.61%             0.50%            0.37%         0.50%     0.35%      0.41%    0.34%
2004                      0.48%           0.36%           0.54%            0.46%           0.42%          0.41%             0.35%            0.44%         0.41%     0.35%      0.48%    0.47%
2005                      0.50%           0.44%           0.43%            0.53%           0.51%          0.35%             0.40%            0.44%         0.56%     0.80%      0.46%    0.39%
2006                      0.52%           0.51%           0.44%            0.53%           0.59%          0.70%             0.52%            0.42%         0.62%     0.51%      0.34%    0.25%
2007                      0.55%           0.37%           0.51%            0.41%           0.36%          0.44%             0.47%            0.81%         0.48%     0.46%      0.85%    0.58%
2008                      0.90%           0.79%           1.19%            0.65%           0.58%          0.71%             1.24%            0.94%         1.16%     2.41%      2.14%    1.20%
2009                      1.59%           1.40%           1.54%            0.85%           0.95%          0.78%             0.60%            0.54%         0.52%     0.56%      0.56%    0.39%
2010                      0.51%           0.46%           0.29%            0.31%           0.65%          0.70%             0.60%            0.34%             0.51%                0.32%                0.51%              0.26%
2011                      0.32%           0.30%           0.41%            0.18%           0.19%          0.28%             0.22%            0.75%             0.64%                0.45%                0.59%              0.32%

                                                                    Concentrated bets contribute positively to QARMA


As of Dec 31, 2011                                        1999       2000          2001       2002        2003           2004        2005         2006            2007            2008            2009            2010            2011
Average of Same Day S&P Perf                          0.09%         -0.03%     -0.04%        -0.09%       0.11%          0.04%      0.02%        0.06%           0.03%          -0.15%           0.11%          0.06%           0.01%
Average of Daily Performance                          0.18%         0.20%          0.16%     0.09%        0.05%          0.04%      0.11%        0.10%           0.05%           0.23%           0.14%          0.33%           0.14%
Average of Perf due to biggest bet (same day)         0.60%         0.88%          0.75%     0.82%        0.54%          0.43%      0.49%        0.50%           0.53%           1.16%           0.85%          0.45%           0.39%
Average of Perf due to Biggest Long (same day)        0.25%         0.39%          0.28%     0.24%        0.23%          0.20%      0.24%        0.27%           0.22%           0.45%           0.34%          0.15%           0.06%
Average of Perf due to biggest Short (same day)       0.21%         0.34%          0.29%     0.34%        0.17%          0.17%      0.21%        0.19%           0.18%           0.37%           0.28%          0.10%           0.02%
Average of Ex-post Beta                               2.32%        -14.54%     -5.15%        -3.55%       6.77%      -0.94%         0.34%       -4.17%        -12.90%         -13.24%            9.73%          9.15%           6.82%

                                                                          QARMA Performance is better across many metrics

                                                                                                                                             Proforma Results till Sep 14, 2010. Live net returns thereafter. As of EOD Dec 31,, 2011

  1/2/2012                                                                                                                                                                                                                               16
10.00%

                  QARMA Return Premium over S&P on Extreme Market Days (S&P Return < = -1.5%)
 8.00%
                                                            8.30%

 6.00%                                                               6.62%
                                                                                         5.43%
 4.00%                                                   4.54%   4.80%
                                                                                              4.29%                            4.27%
                                                    3.69%                                                 3.90%            3.70%
                                    3.40%                                                                     3.46%
 2.00%                                          2.74%                            2.84%
                                                                                     2.81%                        2.68%                2.72%
                                                                                                  2.43%
                                                                                                      2.39%
                1.79%           1.87%       1.84%                                                                                              2.01%
            1.45% 1.68% 1.69%           1.28%                                 1.14%                                                1.37%   1.59% 1.50%
 0.00% 0.75%             0.76%                                            1.09%
                                                                                                                    0.48%
       -1.59% -1.78% -1.57%
           -1.59%                                                      -1.50%
                                                                           -1.55%                                               -1.66% -1.86%
                                                                                                                                    -1.68%
                               -1.95% -1.74% -2.03%
                    -2.05% -1.89% -2.27% -1.81%                                                -2.04%      -1.94%
                                                                                                               -2.00%                          -2.11%
                                                                                                                                           -2.21%
-2.00%                                              -2.56%                     -2.52%
                                                                                   -2.67%          -2.50%          -2.47%
                                                                                                                        -2.79%
                                                                                       -2.94%
                                                                                           -3.19%      -2.85%
                                                                                                                            -3.67%
-4.00%                                                         -4.37%
                                                                   -4.45%
                                                        -4.78%

-6.00%                                                      -6.65%

-8.00%

                                                                         S&P   Alpha


     Observations
         There were exactly 35 trading days when S&P went down by more than -1.5% between Sep 15, 2010 and Dec 31, 2011.
         Strategy Alpha (=(QARMA net performance – S&P Performance)) is positive on every single trading day when S&P went down by more than 1.5%.
         On 54% of the days QARMA had a net positive return.
         Average QARMA return = +0.29%, while S&P return = -2.49% on these 35 days.


    1/2/2012                                                                                                                                          17
QARMA concept can be extended to other markets and implemented using a
     range of liquid instruments. Research ongoing to increase capacity and scale.
    Instrument & Market Extension: QARMA process is inherently adaptable
          Eligible Instruments should have low “Tracking Error” to the sub-universe
          Can be applied to any liquid broad market universe with liquid tradable sub-universes
          Other implementation examples where this technique can be employed includes credit derivatives,
           equity baskets, Euro STOXX, All Cap, Global Macro

    On-going Research: Research covers a wide angle
          Research under way on intra-day rebalancing, liquidity enhancement and microstructure issues
          Implementation:
           ▪   @VWAP Trades (vs. @OPEN trades currently): A mechanism is being tested to trade @VWAP selectively, with
               100% success rate
           ▪   Trade Segmentation: We are researching dividing rebalance trades into
                ▪ Approximation Trade @CLOSE the prior day
                ▪ A “completion” trade @VWAP on rebalance date to the target weight
           ▪   Hard coded stop loss can already be implemented under the current model

    Plan for 1st year: Raise AUM to USD 30MM – USD 35 MM
           ▪ Setup fund operations and establish processes to invest larger amounts of capital


1/2/2012                                                                                                                 18
Manager: Partha Chakraborty, Ph.D., CFA
    Education:
         ▪ Harvard Business School: Investment Management Workshop (2010)
         ▪ CFA Institute: CFA Charter (2005)
         ▪ Cornell University (Ph.D. Economics and Finance 1999, Masters 1998)
              ▪ Advisor: Professor Robert Jarrow, Johnson Graduate School of Management, Cornell University
         ▪ Indian Statistical Institute (M.Stat. 1995; B.Stat. 1993)
    Experience
         ▪ President and CIO, Arko Asset Management (Dec 2011 - )
         ▪ Founder and Managing Partner: Angle Light Partners (2009 – 2011)
         ▪ Head of Investment Risk Reporting and Risk Analysis: WAMCO (2008 – 2009)
         ▪ Head of Investment Management: Flagstone Reinsurance (2007 – 2008)
         ▪ Director, Asset Allocation and Head of Quantitative Asset Allocation: Bank of America (2005 – 2007)
         ▪ VP, Portfolio Allocation Analyst: Citigroup (2005)
         ▪ VP, Head of US Financials Research and Investments: Nomura Asset Mgmt. (2001 – 2005)
         ▪ Associate: Lehman Brothers (1999 – 2001)
         ▪ Founder: Bookwormbooks.com (1997 -1999)

Research Advisor: Professor Robert Jarrow of Cornell University
    Prof. Jarrow is the Ronald P. and Susan E. Lynch Professor of Investment Management at the Johnson Graduate School of Management, Cornell University. Through
    a 30 year career spanning both academia and the practice of finance, his numerous contributions to cutting edge theory and practice have resonated through the
    finance community. His research has brought together latest thoughts in mathematics, finance and economics and spawned advanced valuation and risk
    frameworks that have become industry standards. Included in the list are the Heath Jarrow Morton (HJM) framework for valuation of Interest Rate Derivatives,
    Reduced form credit risk models and Forward price martingale measures, among others. He is author of over 135 papers in leading Finance and Economics Journals
    and serves on the editorial or advisory board of numerous publications including Mathematical Finance. He has published 5 books. Prof. Jarrow is currently Senior
    Fellow of IAFE and FDIC and on the boards of several firms and professional societies. He graduated magna cum laude from Duke University in 1974 with a major in
    mathematics, received an MBA from Dartmouth College in 1976 with highest distinction, and in 1979 obtained a PhD in finance from the Massachusetts Institute of
    Technology under Nobel laureate Prof. Robert Merton.

1/2/2012                                                                                                                                                                19
1.  Investment Manager: Kent Avenue Capital Partners (a DE entity)
 2. Fund Name: QARMA (a DE LP)
 3. Fee Structure:
      i. Management Fee:2%
      ii. Incentive Fee: 20% over a performance threshold of 5% annualized return.
  4. Lock Up: None
  5. Liquidity: End of Month.
  6. Legal Counsel: Donald S. Mendelsohn of Thompson, Hine, LP in Cincinnati and Brian Hoye of Gipson,
      Hoffman & Pancione, LLP in Los Angeles
  7. Prime Broker: Interactive Brokers of Chicago
  8. Third Party Administrator: Custom House Group of Chicago
  9. Custodian: JP Morgan Chase
  10. Fund Auditor: TBD
  11. Contact:
      i. Partha Chakraborty, CEO and CIO of Kent Avenue Capital Partners +1 (917) 655-9263
      ii. Patralika Chatterjee: COO of Kent Avenue Capital Partners +1 (917) 734-3642


1/2/2012                                                                                                 20

Qarma investor presentation eoy 2011

  • 1.
    Proprietary and Confidential InvestorPresentation Partha Chakraborty, Ph.D., CFA
  • 2.
    Introduction (Page 3)  Strategy Discussion (Pages 4 - 9)  Investment Strategy and Rebalancing Process  Investment and Implementation Edge  Risk Management  Performance Presentation (Pages 10 – 16)  Live Performance  Pro-forma results analyses  Live Performance when S&P return < = -1.5% (Page 17)  Future Directions (Page 18) ‘  Manager and Advisor Profile (Page 19)  Fund Details (Page 20) 1/2/2012 2
  • 3.
    QARMA is aunique, risk aware and quantitative approach to Equity Investments that monetizes relative performance of GICS sectors with Dollar Neutral Portfolios of highly liquid unlevered ETF’s.  GICS Sector Relative Performance is the source of Alpha ▪ GICS Sectors are traditionally considered “too big to be imperfect” based solely on top down analyses and on any given day, returns of GICS sectors are different ▪ Relative GICS sector betas can be a source of Alpha that is impossible to arbitrage away ▪ Model generates dollar neutral portfolios that implements views on relative return expectations over a 1 day horizon  Unique, Systematic and Dynamic Approach ▪ Only known model meeting all necessary conditions for a supernormal economic profits in a factor universe ▪ Factors are chosen based on bottom-up security data with distribution free methodology ▪ Model rebalances daily, essentially “recalibrating” itself dynamically using newly selected factors  Risk Aware Investments ▪ All instruments are exchange traded, liquid and unlevered- no counterparty risk, no hidden leverage, full price discovery ▪ Current implementation is Reg-T, no explicit or implicit leverage; model very adaptable to other specifications Absolute Performance Relative Performance As of Index = S&P 500 Index = US Cash Relative 12/31/2011 Strategy (Net) St Dev Sharpe Average Beta Index Perf Relative Performance Index Perf Performance ITD 68.66% 9.46% 5.18 11.80% 13.89% 54.77% 0.34% 68.32% YTD 42.31% 10.16% 4.11 6.82% 0.95% 41.36% 0.25% 42.05% QTD 10.78% 12.10% 4.13 6.77% 11.23% -0.44% 0.05% 10.73% MTD 1.70% 7.84% 2.86 1.60% 0.86% 0.84% 0.02% 1.68% 1/2/2012 3
  • 4.
    Macro Investments based on GICS Sectors ▪ GICS sectors will almost never move in parallel, a relative performance strategy may be profitable ▪ Macro sectors are not “too big to be imperfect” ▪ Top down relative performance analyses have proven ineffective, no known research on a bottom up approach  Quantitative core has key advantages ▪ Comprehensive factor modeling with a novel filtering tool ▪ Top down and bottom up approaches combined together in a harmonious whole ▪ Dynamic modeling approach “rebuilds” the model from scratch at every rebalance  Trend Overlay accommodates short holding period ▪ QARMA utilizes a 10D view on flow and stock variables at multiple horizons  Portfolio Construction ▪ Dollar neutral Reg-T portfolio of highly liquid unlevered ETF’s ▪ No counterparty risk, no pricing risk, no hidden leverage ▪ No specific risk - sector beta is the only source of alpha ▪ Extensive and rigorous back-test over entire lifetime of the instruments used ▪ Hard coded risk mitigation never hit in live trading or extensive back-test 1/2/2012 4
  • 5.
    Fundamental Relative Macro Value Momentum Risk Factors Universe of Factors Breadth Profitability PCA 3 01-Apr-2011 Reliability 01-Apr-2011 PCA 44.23% 2 38.29% PCA 1 13.76% Symmetry 3.73% XLF US -1.68% XLV US XLE US XLP US XLI US XLY US XLU US -5.78% XLB US XLK US -15.07% Equity Equity Equity -15.95% Equity Equity Equity Equity Equity Equity Principal Component Analysis -61.52% Top Factors Sector Allocations QARMA screens a broad universe of factors. Top factors are fed into robust statistical processes to generate 1/2/2012 sector return expectations. Relative return expectations are implemented in dollar neutral portfolios of SPDR’s 5
  • 6.
    The Rebalance Processhas five steps each with its unique proposition  Step 1: Utilize five pillars of explanatory power  Economic/ Macro: A broad collection  Relative Valuation (both historical and cross sectional)  Company Fundamentals (e.g., balance sheet, income statement and growth details)  Market Risk Factors (e.g., VIX)  Momentum Factors  Step 2: Utilize stock level information to rank 300 explanatory factors at each rebalancing  Outcome: Top explanatory factors  Process: Score each factor on four metrics and combine for a composite score  Profitability  Breadth  Reliability  Symmetry  Step 3: Top Factors generate horizon separate return expectations  Sector Specific PCA’s with the same set of top factors  Step 4: An exogenous trend overlay is built in (to be discussed separately)  Outcome: Signals that represent sector views with trend overlay incorporated  Step 5: Convert signals into allocation recommendations  Outcome: Long/Short ETF portfolio that is marked continuously  Process: Variance smoothing mechanism for asset allocation 1/2/2012 6
  • 7.
    QARMA has anexplicit trend overlay built in.  Higher frequency implies elevated importance of market microstructure  QARMA has about 190% daily turnover at 200% gross exposure  Price moves may move reflect opportunities otherwise unexplored  9 Sector ETF’s imply 10D views  Nine sector ETF’s lend themselves to 10D view  Both sector composition in S&P (“stock”) and price moves (“flow”) can be viewed in 10D  Each can be viewed at multiple horizons  QARMA utilizes 10D stock and flow views at shorter horizons  Stock and flow each are ranked in 10D at 1 week, 2 weeks, 1 & 3 month horizons  A proprietary process combines these data points into a score for each sector  Scores are then combined with sector return expectations to come up with Sector Signals (input to Step 5 of Rebalance Process). 1/2/2012 7
  • 8.
    Strategy implementation hasdistrict advantages built in.  Instrument Choice: Deliberate commensurate with value proposition  All instruments are exchange traded, highly liquid and low cost  Shorting allowed on downticks  Deliberate choice of instruments to avoid hidden leverage  Capacity and Market Liquidity: Highly favorable  ETF market size exceeds USD 1 trillion and no explicit cap on size  Expense ratios average 21bps annualized. Estimated average bid offer spread 38 bps annualized.  Financing costs contained by self-imposed explicit cap on leverage  Much lower borrow risk than single stocks  Strategy Unwind: Performance drag built into back-test data  Portfolio trade at target @OPEN currently, improvements possible  A performance drag per rebalancing is already built in for pro-forma calculations 1/2/2012 8
  • 9.
    Strategy takes acomprehensive approach to risk  Risk Philosophy  Risk and return are two sides of the same coin  Risk management built in at the level of portfolio construction  Portfolio Risk  Leverage: Capped at +1/-1 units for 1 unit of capital  Liquidity: Trade only the most liquid, unlevered, exchange traded ETFs  Concentration: No single stock risk, though we will take concentrated long/short sector positions  Model: Models and data continually undergo scrutiny/sanity checks  Factors: Exposure to certain risk factors can be easily constrained  Operational Risk  Madoff: Third Party Fund Administrator independently will certify prices and reconciles trades  Galleon: Process explicitly depends only on publicly available information, with no first call 1/2/2012 9
  • 10.
    Comparison of LivePerformance against S&P 500 (Sep 15, 2010 to Dec 31, 2011) 170.00 Live Performance (Cumulative), 168.66 160.00 150.00 Axis Title 140.00 130.00 120.00 S&P Performance (Cumulative), 113.89 110.00 100.00 QARMA Live Return Highlights (Sep 15, 2010 to Dec 31, 2011) Dollar Neutral Investment Strategy uses USD 1.0 long funded by USD 1.0 short for every USD 1 invested. No effective size restriction Live Trading YTD Return STDEV of Return (ITD) Live Trading ITD Return (after trading charge) 68.66% (after trading charge) 42.31% (annl.) 9.5% QARMA Backtest results (June 2, 1999 to Sep 14, 2010) Annualized Gross Returns after trading charge over entire backtest (till Sep 14, 2010) 39.13% STDEV of Rtrn (ann.) 14.16% Sharpe 2.76 1/2/2012 10
  • 11.
    QARMA Strategy NetReturn 3.00% 2.00% 1.00% Net Performance 0.00% 9/15/2010 10/15/2010 11/15/2010 12/15/2010 1/15/2011 2/15/2011 3/15/2011 4/15/2011 5/15/2011 6/15/2011 7/15/2011 8/15/2011 9/15/2011 10/15/2011 11/15/2011 12/15/2011 -1.00% -2.00% -3.00% -4.00% Date 1 Day Strategy Return after trade slippage charge Downside Analysis of Live Trade Peak to trough drawdown -3.42% Occurred 9/27/2011 It happened over 2 consecutive losing days % Days with -ve daily return 38.41% Average Drawdown -0.37% Min 1 day return (net) -2.80% Occurred 10/4/2011 Average Strategy Return on Up days / Strategy Captures about 50%+ of the upside Average ITD Beta (ex- Upcapture % days 67.93% 23.2% 11.80% Average S&P Return on up days on average post) on Up Days Average Strategy This is fantastic, as this means on down days Return on Down days Average YTD Beta (ex- Downcapture % days 46.85% -11.2% Strategy Return is actually positive. Great for 6.64% / Average S&P Return post) conservative portfolios. on Down Days Average Strategy Average Strategy % Positive Return Days on extreme market move Return on Extreme Return on Extreme Minimum 1 day 54.29% 0.29% 0.32% -2.80% (S&P <= -1.5%) Market Down Moves Market Up Moves strategy return (S&P Return <-1.5%) (S&P Return > +1.5%) Annualized S&P Annualized Return 48.2% Annualized SD 9.5% 10.1% Return Information Ratio (vs Sharpe 5.10 1.64 S&P) Live Trading from Sep 15, 2010. Analysis as of EOD Dec 31, 2011 1/2/2012 11
  • 12.
    Monthly Return Proforma Returns till Sep 14, 2010. Live Results after trading charges thereafter. Last update EOD Dec 31, 2011 Year January February March April May June July August September October November December 1999 4.62% 1.96% -0.56% 8.21% 4.03% 9.65% 2000 11.01% 9.49% 12.95% 2.20% 0.38% 4.21% -0.15% 5.32% 3.50% -8.88% 7.45% 4.51% 2001 0.96% 8.69% 15.44% -1.30% 5.44% 2.34% 7.99% -0.51% 9.22% -5.15% -2.80% -0.25% 2002 4.23% -1.08% -0.30% 1.00% 6.85% 2.85% 8.42% 2.80% -0.96% -3.92% 7.39% -5.61% 2003 3.86% 0.45% 1.13% -2.01% 1.01% 4.31% 2.13% 5.13% -1.30% -1.82% 1.07% -0.42% 2004 2.36% 0.01% -1.74% 2.51% -0.83% 4.58% 0.69% 2.51% -0.15% 2.64% -4.14% 1.15% 2005 -0.54% 1.85% 1.23% 6.78% 0.09% 3.23% 3.91% 0.47% 2.56% 4.20% 4.06% -0.14% 2006 6.16% -3.12% 6.55% 2.79% -1.11% 5.24% 3.78% 0.22% -0.97% 3.88% 0.95% 0.65% 2007 4.82% 0.96% 0.41% -1.27% -1.42% -0.05% 4.00% 1.14% 1.59% -2.62% 2.08% 2.52% 2008 6.71% 3.01% 2.72% 0.09% 1.14% 7.61% 8.35% -2.27% 2.16% 3.90% 22.14% 3.09% 2009 -2.12% 4.88% 17.32% 5.54% -2.79% -0.70% 4.29% 5.55% 3.00% -2.88% 1.91% 1.65% 2010 8.97% 5.49% 9.26% 9.15% 3.43% 11.30% 12.40% 6.94% 4.89% 5.39% 6.97% 2.48% 2011 6.15% 5.01% 2.65% 2.18% 2.664% 1.63% -1.70% 2.82% 4.18% 4.07% 4.67% 1.70% Quarterly Return Proforma Returns till Sep 14, 2010. Live Results after trading charges thereafter. Last update EOD Dec 31, 2011 1999 2000 2001 2002 2003 2004 2005 2006 2007 2008 2009 2010 2011 Q1 37.28% 26.68% 2.79% 5.52% 0.59% 2.55% 9.59% 6.26% 12.91% 20.44% 25.60% 14.42% Q2 6.91% 6.52% 10.99% 3.25% 6.31% 10.33% 6.98% -2.72% 8.93% 1.88% 25.65% 6.61% Q3 6.07% 8.84% 17.35% 10.37% 5.98% 3.07% 7.08% 3.00% 6.86% 8.17% 13.38% 26.08% 5.30% Q4 23.44% 1.19% -8.03% -2.61% -1.19% -0.48% 8.27% 4.92% 1.91% 30.82% 0.61% 14.96% 10.78% Ex-post Beta Average ex-post daily beta over the entire period = -1.60% 1999 2000 2001 2002 2003 2004 2005 2006 2007 2008 2009 2010 2011 Q1 0.94% -22.54% 2.04% -3.40% -4.10% -1.63% 11.42% 3.09% -14.08% -11.68% 4.78% 25.52% Q2 -33.72% -10.43% 7.39% -25.09% -0.99% -4.46% -2.17% -15.11% -21.20% -5.71% 34.43% -6.14% -4.92% Q3 3.54% 20.57% -16.04% -4.18% 15.09% -0.42% -0.16% -24.83% -17.30% -30.16% 28.15% 8.00% 0.31% Q4 12.93% -69.24% 9.41% 13.39% 15.80% 4.99% 5.32% 12.07% -15.62% -3.04% -12.60% 29.91% 6.77% Proforma Results till Sep 14, 2010. Live net returns thereafter. As of EOD Dec 31, 2011 1/2/2012 12
  • 13.
    0 0 20 40 60 80 50 100 120 140 160 180 100 150 200 250 -10.3% -8.58% 1/2/2012 -9.5% -8.15% -8.7% -7.71% -7.9% -7.28% -7.1% -6.85% -6.3% -6.41% -5.4% -5.98% -4.6% -5.54% -3.8% -5.11% -3.0% -4.68% -2.2% -4.24% -1.4% -3.81% -0.6% -3.38% 0.2% -2.94% 1.0% -2.51% 1.8% -2.07% 2.7% -1.64% 3.5% -1.21% 4.3% -0.77% 5.1% -0.34% 5.9% 0.09% 6.7% 0.53% 7.5% 0.96% 8.3% 1.40% 9.1% 1.83% 10.0% 2.26% 10.8% 2.70% 11.6% 3.13% 12.4% 3.56% Histogram of Weekly Returns Histogram of 1 Month Returns 13.2% 4.00% 14.0% 4.43% 14.8% 4.87% 5 Trading Day Return Histogram 15.6% 5.30% 1 Month Rolling Return Histogram 16.4% 5.73% 17.2% 6.17% 18.1% 6.60% 18.9% 7.03% 19.7% 7.47% 20.5% 7.90% 21.3% 8.34% 22.1% 8.77% 22.9% 9.20% 23.7% 9.64% 24.5% 10.07% 25.3% 10.50% 26.2% 10.94% 27.0% 11.37% 27.8% 11.81% 28.6% 12.24% 29.4% 12.67% Proforma Results till Sep 14, 2010. Live net returns thereafter. As of EOD Dec 31,, 2011 13
  • 14.
    4.500 40.00% Annualized SD of QARMA Strategy Returns and LN (Money Growth) Trendline of Money Growth is not correlated with SD of the Returns 4.000 35.00% 3.500 y = 0.0007x - 25.959 30.00% 3.000 25.00% 2.500 2.000 20.00% 1.500 15.00% 1.000 10.00% 0.500 5.00% 0.000 6/5/2000 6/5/2001 6/5/2002 6/5/2003 6/5/2004 6/5/2005 6/5/2006 6/5/2007 6/5/2008 6/5/2009 6/5/2010 6/5/2011 -0.500 0.00% LN (Daily Strategy Money Growth) Annl. SD of daily MTM Linear (LN (Daily Strategy Money Growth)) Strategy Volatility seems to have little impact on its trend performance Proforma Results till Sep 14, 2010. Live net returns thereafter. As of EOD Dec 31,, 2011 1/2/2012 14
  • 15.
    Daily Perf againstDaily VIX level 10.00% D 8.00% a i l 6.00% y 4.00% P e 2.00% r y = 6E-05x - 4E-05 f 0.00% o 0 10 20 30 40 50 60 70 80 90 r -2.00% m a -4.00% n c -6.00% e -8.00% VIX 1 Day Strategy Return after trade slippage charge Linear (1 Day Strategy Return after trade slippage charge) QARMA is not an explicit nor implicit bet on market volatility Proforma Results till Sep 14, 2010. Live net returns thereafter. As of EOD Dec 31, 2011 1/2/2012 15
  • 16.
    Perf attrib. tolargest bet Biggest bets on average contributed positive amount every month (64.9 bps per day on avg) Year January February March April May June July August September October November December 1999 0.47% 0.43% 0.58% 0.81% 0.71% 0.64% 0.60% 2000 0.82% 0.85% 1.12% 1.16% 0.89% 0.75% 0.66% 0.62% 0.88% 1.08% 0.94% 0.84% 2001 0.79% 0.92% 0.83% 0.74% 0.66% 0.52% 0.76% 0.35% 1.57% 0.90% 0.74% 0.52% 2002 0.63% 0.59% 0.56% 0.48% 0.59% 0.61% 1.57% 1.02% 0.87% 1.30% 1.07% 0.48% 2003 0.68% 0.60% 0.86% 0.62% 0.67% 0.61% 0.50% 0.37% 0.50% 0.35% 0.41% 0.34% 2004 0.48% 0.36% 0.54% 0.46% 0.42% 0.41% 0.35% 0.44% 0.41% 0.35% 0.48% 0.47% 2005 0.50% 0.44% 0.43% 0.53% 0.51% 0.35% 0.40% 0.44% 0.56% 0.80% 0.46% 0.39% 2006 0.52% 0.51% 0.44% 0.53% 0.59% 0.70% 0.52% 0.42% 0.62% 0.51% 0.34% 0.25% 2007 0.55% 0.37% 0.51% 0.41% 0.36% 0.44% 0.47% 0.81% 0.48% 0.46% 0.85% 0.58% 2008 0.90% 0.79% 1.19% 0.65% 0.58% 0.71% 1.24% 0.94% 1.16% 2.41% 2.14% 1.20% 2009 1.59% 1.40% 1.54% 0.85% 0.95% 0.78% 0.60% 0.54% 0.52% 0.56% 0.56% 0.39% 2010 0.51% 0.46% 0.29% 0.31% 0.65% 0.70% 0.60% 0.34% 0.51% 0.32% 0.51% 0.26% 2011 0.32% 0.30% 0.41% 0.18% 0.19% 0.28% 0.22% 0.75% 0.64% 0.45% 0.59% 0.32% Concentrated bets contribute positively to QARMA As of Dec 31, 2011 1999 2000 2001 2002 2003 2004 2005 2006 2007 2008 2009 2010 2011 Average of Same Day S&P Perf 0.09% -0.03% -0.04% -0.09% 0.11% 0.04% 0.02% 0.06% 0.03% -0.15% 0.11% 0.06% 0.01% Average of Daily Performance 0.18% 0.20% 0.16% 0.09% 0.05% 0.04% 0.11% 0.10% 0.05% 0.23% 0.14% 0.33% 0.14% Average of Perf due to biggest bet (same day) 0.60% 0.88% 0.75% 0.82% 0.54% 0.43% 0.49% 0.50% 0.53% 1.16% 0.85% 0.45% 0.39% Average of Perf due to Biggest Long (same day) 0.25% 0.39% 0.28% 0.24% 0.23% 0.20% 0.24% 0.27% 0.22% 0.45% 0.34% 0.15% 0.06% Average of Perf due to biggest Short (same day) 0.21% 0.34% 0.29% 0.34% 0.17% 0.17% 0.21% 0.19% 0.18% 0.37% 0.28% 0.10% 0.02% Average of Ex-post Beta 2.32% -14.54% -5.15% -3.55% 6.77% -0.94% 0.34% -4.17% -12.90% -13.24% 9.73% 9.15% 6.82% QARMA Performance is better across many metrics Proforma Results till Sep 14, 2010. Live net returns thereafter. As of EOD Dec 31,, 2011 1/2/2012 16
  • 17.
    10.00% QARMA Return Premium over S&P on Extreme Market Days (S&P Return < = -1.5%) 8.00% 8.30% 6.00% 6.62% 5.43% 4.00% 4.54% 4.80% 4.29% 4.27% 3.69% 3.90% 3.70% 3.40% 3.46% 2.00% 2.74% 2.84% 2.81% 2.68% 2.72% 2.43% 2.39% 1.79% 1.87% 1.84% 2.01% 1.45% 1.68% 1.69% 1.28% 1.14% 1.37% 1.59% 1.50% 0.00% 0.75% 0.76% 1.09% 0.48% -1.59% -1.78% -1.57% -1.59% -1.50% -1.55% -1.66% -1.86% -1.68% -1.95% -1.74% -2.03% -2.05% -1.89% -2.27% -1.81% -2.04% -1.94% -2.00% -2.11% -2.21% -2.00% -2.56% -2.52% -2.67% -2.50% -2.47% -2.79% -2.94% -3.19% -2.85% -3.67% -4.00% -4.37% -4.45% -4.78% -6.00% -6.65% -8.00% S&P Alpha Observations  There were exactly 35 trading days when S&P went down by more than -1.5% between Sep 15, 2010 and Dec 31, 2011.  Strategy Alpha (=(QARMA net performance – S&P Performance)) is positive on every single trading day when S&P went down by more than 1.5%.  On 54% of the days QARMA had a net positive return.  Average QARMA return = +0.29%, while S&P return = -2.49% on these 35 days. 1/2/2012 17
  • 18.
    QARMA concept canbe extended to other markets and implemented using a range of liquid instruments. Research ongoing to increase capacity and scale.  Instrument & Market Extension: QARMA process is inherently adaptable  Eligible Instruments should have low “Tracking Error” to the sub-universe  Can be applied to any liquid broad market universe with liquid tradable sub-universes  Other implementation examples where this technique can be employed includes credit derivatives, equity baskets, Euro STOXX, All Cap, Global Macro  On-going Research: Research covers a wide angle  Research under way on intra-day rebalancing, liquidity enhancement and microstructure issues  Implementation: ▪ @VWAP Trades (vs. @OPEN trades currently): A mechanism is being tested to trade @VWAP selectively, with 100% success rate ▪ Trade Segmentation: We are researching dividing rebalance trades into ▪ Approximation Trade @CLOSE the prior day ▪ A “completion” trade @VWAP on rebalance date to the target weight ▪ Hard coded stop loss can already be implemented under the current model  Plan for 1st year: Raise AUM to USD 30MM – USD 35 MM ▪ Setup fund operations and establish processes to invest larger amounts of capital 1/2/2012 18
  • 19.
    Manager: Partha Chakraborty,Ph.D., CFA  Education: ▪ Harvard Business School: Investment Management Workshop (2010) ▪ CFA Institute: CFA Charter (2005) ▪ Cornell University (Ph.D. Economics and Finance 1999, Masters 1998) ▪ Advisor: Professor Robert Jarrow, Johnson Graduate School of Management, Cornell University ▪ Indian Statistical Institute (M.Stat. 1995; B.Stat. 1993)  Experience ▪ President and CIO, Arko Asset Management (Dec 2011 - ) ▪ Founder and Managing Partner: Angle Light Partners (2009 – 2011) ▪ Head of Investment Risk Reporting and Risk Analysis: WAMCO (2008 – 2009) ▪ Head of Investment Management: Flagstone Reinsurance (2007 – 2008) ▪ Director, Asset Allocation and Head of Quantitative Asset Allocation: Bank of America (2005 – 2007) ▪ VP, Portfolio Allocation Analyst: Citigroup (2005) ▪ VP, Head of US Financials Research and Investments: Nomura Asset Mgmt. (2001 – 2005) ▪ Associate: Lehman Brothers (1999 – 2001) ▪ Founder: Bookwormbooks.com (1997 -1999) Research Advisor: Professor Robert Jarrow of Cornell University Prof. Jarrow is the Ronald P. and Susan E. Lynch Professor of Investment Management at the Johnson Graduate School of Management, Cornell University. Through a 30 year career spanning both academia and the practice of finance, his numerous contributions to cutting edge theory and practice have resonated through the finance community. His research has brought together latest thoughts in mathematics, finance and economics and spawned advanced valuation and risk frameworks that have become industry standards. Included in the list are the Heath Jarrow Morton (HJM) framework for valuation of Interest Rate Derivatives, Reduced form credit risk models and Forward price martingale measures, among others. He is author of over 135 papers in leading Finance and Economics Journals and serves on the editorial or advisory board of numerous publications including Mathematical Finance. He has published 5 books. Prof. Jarrow is currently Senior Fellow of IAFE and FDIC and on the boards of several firms and professional societies. He graduated magna cum laude from Duke University in 1974 with a major in mathematics, received an MBA from Dartmouth College in 1976 with highest distinction, and in 1979 obtained a PhD in finance from the Massachusetts Institute of Technology under Nobel laureate Prof. Robert Merton. 1/2/2012 19
  • 20.
    1. InvestmentManager: Kent Avenue Capital Partners (a DE entity) 2. Fund Name: QARMA (a DE LP) 3. Fee Structure: i. Management Fee:2% ii. Incentive Fee: 20% over a performance threshold of 5% annualized return. 4. Lock Up: None 5. Liquidity: End of Month. 6. Legal Counsel: Donald S. Mendelsohn of Thompson, Hine, LP in Cincinnati and Brian Hoye of Gipson, Hoffman & Pancione, LLP in Los Angeles 7. Prime Broker: Interactive Brokers of Chicago 8. Third Party Administrator: Custom House Group of Chicago 9. Custodian: JP Morgan Chase 10. Fund Auditor: TBD 11. Contact: i. Partha Chakraborty, CEO and CIO of Kent Avenue Capital Partners +1 (917) 655-9263 ii. Patralika Chatterjee: COO of Kent Avenue Capital Partners +1 (917) 734-3642 1/2/2012 20