- The document provides an investor presentation for Teradata's second quarter 2016 results.
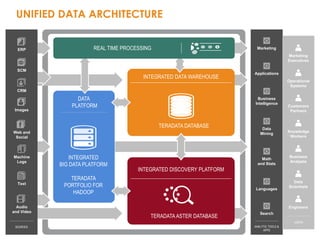
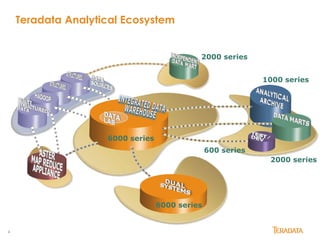
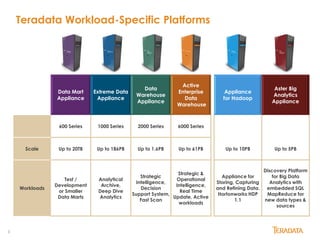
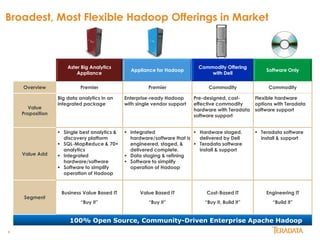
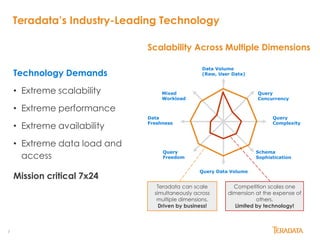
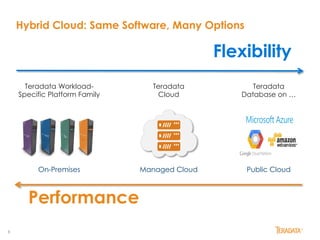
- It highlights Teradata's portfolio of workload-specific platforms and hybrid cloud offerings that provide scalability, performance, and flexibility.
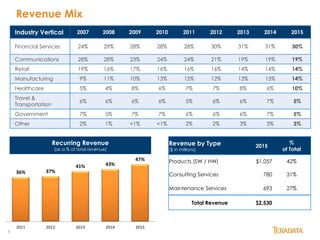
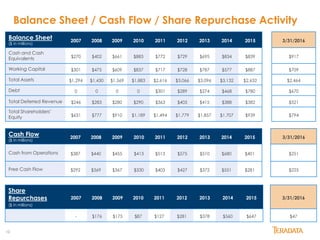
- Charts show Teradata's revenue mix by industry and type over recent years as well as its balance sheet, cash flow, and share repurchase activity.