Download to read offline


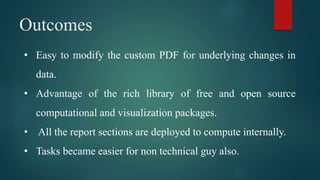

The American Public Power Association collects data about electric utilities but saw increased delays in report generation as subscriber counts rose. In 2021, an analyst used Python with statistics, Matplotlib and seaborn libraries to compute the data, allowing easy modification of PDF reports for data changes and taking advantage of Python's open source packages. Using Python made generating reports easier for both technical and non-technical staff.